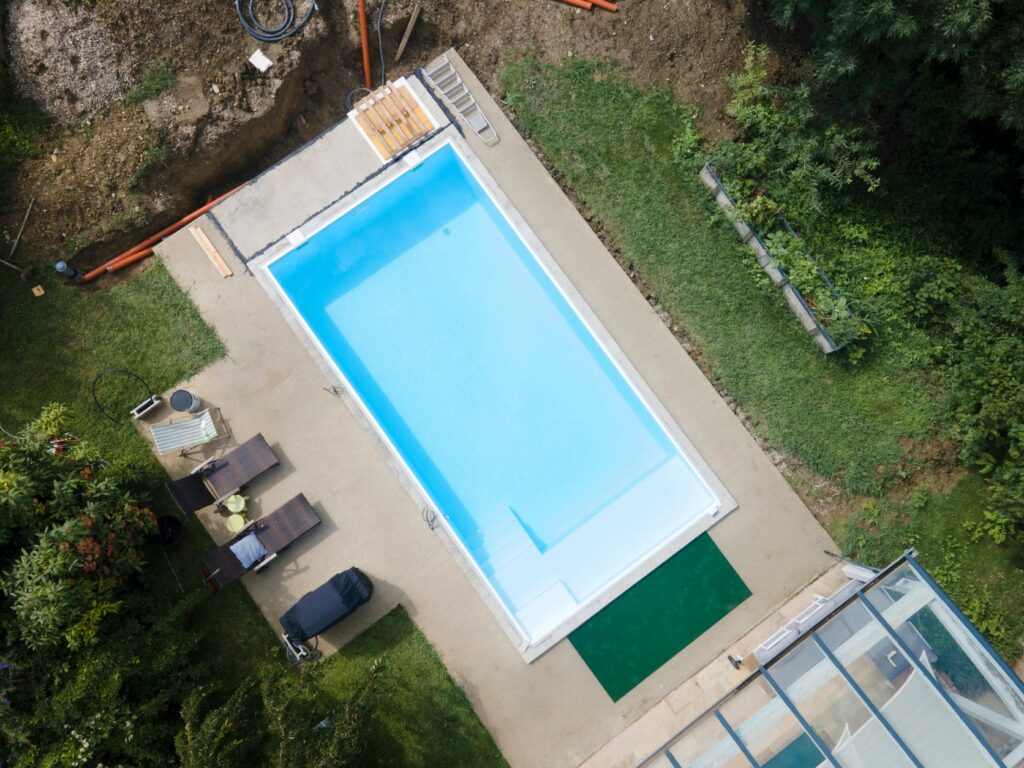
Texas Swimming Pool Construction Review – August 2023

Every month, HBW reviews and publishes the latest stats on permit data available from the HBW database, providing readers a glimpse into just some of the information that is available to HBW subscribers.  Not only does this information allow readers a sneak peek into the market from a monthly, quarterly, and annual basis, but it also allows users to understand patterns in the market, as well as prospects and opportunities for expanding business.

Today, we are looking specifically at the latest data on new swimming pool construction in the four major metro areas of Texas (Dallas, Houston, Austin, San Antonio) during the month of August.  Last month, there approximately 675 new swimming pool construction permits with a total value in excess of $42.6 million added to the HBW database for Texas.  Out of the four regions reviewed, the highest concentration of pool starts could be found in Dallas (286 permits), while the highest average value of new swimming pool construction could be found in Houston (average value: $79,750).

Here is a closer look at the total permits, average value of construction, top counties, and leading pool contractors by region for the Lone Star State last month:

Dallas

Total # of Permits: 286

Average Value of Construction: $59,075

Top Counties for New Construction (based on total permits): Dallas County (90 permits); Tarrant County (73 permits)

Top three Pool Builders (based on total new permits in August 2023):

BuilderTotal Permits
1-Riverbend Pools22
2-Puryear Custom Pools13
3-Gold Medal Pools10

Houston

Total # of Permits: 218

Average Value of Construction: $79,750

Top County for New Construction (based on total permits): Harris County (153 permits)

Top three Pool Builders (based on total new permits in August 2023):

BuilderTotal Permits
1-Platinum Pools16
2-Cypress Custom Pools10
3-Backyard Oasis7

Austin

Total # of Permits: 101

Average Value of Construction: $60,766

Top County for New Construction (based on total permits): Travis County (71 permits)

Top three Pool Builders (based on total new permits in August 2023):

BuilderTotal Permits
1-Cody Pools10
2-Anthony & Sylvan Pools7
3-Premier Pools & Spas of Austin6

San Antonio

Total # of Permits: 68

Average Value of Construction: $32,721

Top County for New Construction (based on total permits): Bexar County (49 permits)

Top three Pool Builders (based on total new permits in August 2023):

BuilderTotal Permits
1-Cody Pools8
2-Keith Zars Pools7
3-Backyard Vacation Oasis6

To gain more information on the builders, homeowners and permits for the construction activity above, check out HBW for your copy of the latest construction data reports. To gain access to the HBW database and receive custom and detailed reports on the latest residential and commercial building activity in Florida, Georgia, Texas, Alabama, and Oklahoma, please contact HBW for details.

Refreshers for Improving Your Online Presence

Let’s face it – Technology and social media preferences are seemingly everchanging. From new platforms being launched or changed to social media trends going from hot to not in less than a day, there is a lot to keep up with when it comes to building your online presence. That being stated, there are certain things that you can count on – simple areas that you can give attention as a contractor without breaking the bank or adding a new team member.

Sometimes, it is just a matter of giving your website and social profiles a little “refresh”. Whether you need to update content on your website or remove and update your socials, here are a few key areas to focus on to ensure that you’re making the most of your online presence:

  1. Get Social – If you are already on social media, then it is important that all of your profiles (on all platforms) are active. Often, if social media profiles are not regularly managed, then months can quickly go by without a post; this can lead to loss in your audience and engagement. For this reason, check your pages/profiles to ensure that they have been properly maintained and are updated with your latest and greatest happenings. Remove any unwanted or duplicate profiles, and work on streamlining your content sharing process.
  2. Update Your Website – To have an updated website doesn’t necessarily mean that you need to make radical changes or create an entirely new site. Sometimes, a simple “cleaning up” of text and images can give your business a refreshed look. More importantly, if you have added a blog, have new pages or profiles on social media, or have changed your location or contact information, make sure that all appropriate updates have been made and links have been added to your website.
  3. Invest in SEO – In order for your website to show up “higher” in search results, you should consider checking in on your current SEO (Search Engine Optimization) efforts. SEO isn’t a one-time action; rather, it is something that takes time and continual attention to maintain momentum. To start, you will need to choose the best “keywords” for your industry and products/services; keep in mind that these can change over time depending on how most people search for your type of service. There are a variety of online tools to find the best keywords; be sure to include short and long-tail keywords such as “flooring contractors in Orlando, Florida”. Be sure to have keywords positioned properly throughout the front and back-end of your website. Additional optimization efforts that you can make include improving page loading speed, accessibility, navigation, and adding links to partner sites.

For contractors, and HBW subscribers who are contacting new leads, it is important that you make a positive first impression when potential clients are searching for your business online. By sticking with consistent brand representation, active social profiles and an updated website that is easy to locate and navigate, you will be well on your way to attracting and retaining customers for the long-term.

For more information on construction business marketing tips, stay connected with the HBW Blog.  To get ahead of construction activity and gain access to the latest permitting data in Florida, Texas, Georgia, Alabama and Oklahoma, contact HBW for more information on construction data reports and industry leads.

Florida Top Home Builders – July 2023

As reported on the HBW blog last week, there were approximately 8,760 new residential construction permits with a total value in excess of $2.6B on record for Florida during the month of July 2023.  Across the state (Southwest, Tampa, Orlando, Jacksonville, Southeast), two major players in the market continued their lead for new residential construction – those home builders are Lennar Homes and D.R. Horton; for the one-month period, both mega builders had 1,362 and 1,042 new permits on record with HBW respectively, and Lennar Homes ranked #1 for new home construction activity (based on total permits) in three out of five regions reviewed.

Here is a closer look at the leading home builders by Florida region for the month of July 2023:

Southwest

Last month, there were more than 360 home builders in the southwestern region of Florida with new home construction activity on record with HBW, and the following ranked as the top five for total new permits:

BuilderTotal Permits Average Value
1-Lennar Homes332 $        177,100.00
2-Pulte Homes232 $        215,083.00
3-D.R. Horton221 $        214,143.00
4-Taylor Morrison149 $        229,908.00
5-Neal Communities of SW FL100 $        248,820.00

Tampa

In Tampa, there were 205 home builders with new construction activity on record last month, and the following ranked as the top five for total new permits:

BuilderTotal Permits Average Value
1-Lennar Homes573 $      316,102.00
2-D.R. Horton359 $      258,589.00
3-Meritage Homes143 $      311,664.00
4-KB Homes93 $      188,754.00
5-Pulte Homes87 $      224,022.00

Orlando

There were 170 home builders in the Orlando area that had new residential construction activity on record with HBW last month, and the following ranked as the top five for total new permits:

BuilderTotal Permits Average Value
1-D.R. Horton181 $        326,988.00
2-Lennar Homes166 $        193,065.00
3-Pulte Homes145 $        383,809.00
4-Meritage Homes111 $        288,606.00
5-Mattamy Homes67 $        273,556.00

Jacksonville

Last month, there were nearly 135 contractors with new residential construction activity on record in the Jacksonville area, and the following ranked as the top five for total new permits:

BuilderTotal Permits Average Value
1-D.R. Horton199 $      189,264.00
2-Lennar Homes152 $      307,145.00
3-Pulte Homes119 $      280,934.00
4-Richmond American Homes66 $      276,909.00
5-Dream Finders Homes63 $      217,359.00

Southeast

In the southeastern region of Florida there were 115 home builders with new residential construction activity on record with HBW last month, and the following ranked as the top five for total new permits:

BuilderTotal Permits Average Value
1-Lennar Homes139 $      264,489.00
2-GL Building Corporation102 $      415,449.00
3-D.R. Horton82 $      192,641.00
4-Mattamy Homes69 $      193,758.00
5-Pulte Homes55 $      319,023.00

To gain more information on the builders, homeowners and permits for the construction activity above, check out HBW for your copy of the latest construction data reports. To gain access to the HBW database and receive custom and detailed reports on the latest residential and commercial building activity in Florida, Georgia, Texas, Alabama, and Oklahoma, please contact HBW for details.

Florida New Home Construction Summary – July 2023

In Florida, there were approximately 8,760 new residential construction permits with a total value in excess of $2.6B during the month of July 2023.  Out of the five major regions reviewed (Tampa, Southwest, Orlando, Jacksonville, Southeast), Tampa held the highest volume of new permitting activity (2,520 permits), while the highest average value of new home construction could be found in Orlando (average value: $342,098).

Here is a closer look at the total permits, average value of construction and leading counties for new home construction in Florida by region during the month of July:

Tampa

As previously noted, Tampa took the lead last month for new home construction, having 2,520 new permits with a total value in excess of $733 million.  The average value of new home construction was $290,962, and the majority of permits originated from the counties of Pasco (853 permits) and Polk (781 permits).

Southwest

Last month, there were 2,460 new residential construction permits with a total value in excess of $696 million added to the HBW database for Southwest Florida.  The average value of new home construction was $283,062, and the counties with the highest concentration of new permitting activity were Manatee (741 permits) and Lee (732 permits).

Orlando

The Orlando area had 1,582 new residential construction permits with a total value in excess of $541 million on record with HBW last month.  The average value of new home construction was highest in the Orlando area (average value: $342,098) in comparison to other regions reviewed, and more than half of all new home construction took place in the counties of Orange (522 permits) and Brevard (359 permits).

Jacksonville

In Jacksonville, there were 1,270 new residential construction permits with a total value of nearly $350 million added to the HBW database last month. The average value of new home construction was lowest in Jacksonville (average value: $275,355) in comparison to other Florida regions reviewed, and the bulk of all new residential construction activity took place in the counties of St. Johns (624 permits) and Duval (223 permits).

Southeast

Last month, there were approximately 925 new residential construction permits with a total value of nearly $305 million in the southeastern region of Florida. The average value of new home construction landed on the higher end of the spectrum (average value: $329,061) in comparison to other Florida regions reviewed, and the county with the greatest concentration of new residential construction activity was St. Lucie County (550 permits).

To gain more information on the builders, homeowners and permits for the construction activity above, check out HBW for your copy of the latest construction data reports. To gain access to the HBW database and receive custom and detailed reports on the latest residential and commercial building activity in Florida, Georgia, Texas, Alabama, and Oklahoma, please contact HBW for details.
Florida Swimming Pool Construction Report – July 2023

Based on HBW’s latest construction data reports, there were 2,270 new swimming pool construction permits with a total value of nearly $166.4 million added to the HBW database for Florida last month. Out of the five regions included in the report (Southwest, Tampa, Southeast, Orlando, Jacksonville), the greatest amount of new pool construction could be found in the southwestern region (725 permits), while the highest average value of construction could be found in Tampa (average value: $81,916).

Here is a closer look at the permit data for new swimming pool construction in the Sunshine State during the month of July 2023:

Southwest

Total Permits: 725

Average Value of Construction: $74,976

Top Counties (based on total permits): Lee (199 permits), Manatee (173 permits)

Top Three Pool Builders (based on total permits):

BuilderTotal Permits
1-Pinnacle USA40
2-Aragon Pools & Spas37
3-Coast to Coast Pools30

Southeast

Total Permits: 481

Average Value of Construction: $65,810

Top Counties (based on total permits): Palm Beach (156 permits), Miami-Dade (102 permits)

Top Three Pool Builders (based on total permits):

BuilderTotal Permits
1-A&G Concrete Pools20
2-Fountain Blue Pool17
3-Craft Master Custom Pools15

Tampa

Total Permits: 415

Average Value of Construction: $81,916

Top Counties (based on total permits): Hillsborough (158 permits), Polk (69 permits)

Top Three Pool Builders (based on total permits):

BuilderTotal Permits
1-T&D Pool & Spa Construction29
2-Cody Pools22
3-Tampa Bay Pools20

Orlando

Total Permits: 411

Average Value of Construction: $65,610

Top Counties (based on total permits): Orange (167 permits), Brevard (81 permits)

Top Three Pool Builders (based on total permits):

BuilderTotal Permits
1-Bob’s Pool Service35
2-All Seasons32
3-Dreamscapes Pools & Spas23

Jacksonville

Total Permits: 237

Average Value of Construction: $81,871

Top Counties (based on total permits): St. Johns (88 permits), Duval (51 permits)

Top Three Pool Builders (based on total permits):

BuilderTotal Permits
1-Paragon Pools of North Florida12
2-Agua Pools & Spas9
3-Blue Haven Pools9

To gain more information on the builders, homeowners and permits for the construction activity above, check out HBW for your copy of the latest construction data reports. To gain access to the HBW database and receive custom and detailed reports on the latest residential and commercial building activity in Florida, Georgia, Texas, Alabama, and Oklahoma, please contact HBW for details.

Texas Top Home Builders – July 2023

Earlier this week, we reported on the latest permit data for new home construction in Texas and discovered that there were 7,865 new permits on record with HBW for the month of July.  Today, we are taking a closer look at the permit data to uncover the leading contractors in each of the four major metropolitan areas of Texas (Dallas, Houston, Austin, San Antonio). 

Across nearly all regions, D.R. Horton led for highest volume of housing starts last month, carrying approximately 1,215 new permits for the one-month period and landing in the #1 spot in Dallas, Houston, and San Antonio.  Following D.R. Horton, Lennar Homes ranked #2 for new home construction in July, having approximately 580 new permits on record with HBW.

Here is a closer look at the five leading contractors in each metro area based on the total number of new residential construction permits generated during the month of July 2023:

Dallas

In Dallas and surrounding areas, there were 280 home builders with new construction activity on record last month, and the following ranked as the top five for total new permits:

BuilderTotal Permits
1-D.R. Horton560
2-Bloomfield Homes140
3-Lennar Homes103
4-Meritage Homes91
5-Trophy Signature Homes86

Houston

Last month, there were nearly 320 contractors with new residential construction permits on record with HBW for the Houston area, and the following ranked as the top five for total new permits:

BuilderTotal Permits
1-D.R. Horton494
2-Lennar Homes323
3-Perry Homes159
4-K Hovnanian Homes147
5-Westin Homes137

Austin

Out of more than 100 home builders with new construction activity on record in Austin last month, the following ranked as the top five for total new permits:

BuilderTotal Permits
1-Lennar Homes64
2-Perry Homes49
3-KB Homes46
4-Pulte Homes39
5-Taylor Morrison Homes37

San Antonio

Out of the 100 contractors with new permits on record in the San Antonio area for the month of July, the following ranked as the top five for total new permits:

BuilderTotal Permits
1-D.R. Horton145
2-Lennar Homes89
3-KB Homes83
4-Continental Homes of Texas62
5-M/I Homes37

To gain more information on the builders, homeowners and permits for the construction activity above, check out HBW for your copy of the latest construction data reports. To gain access to the HBW database and receive custom and detailed reports on the latest residential and commercial building activity in Florida, Georgia, Texas, Alabama, and Oklahoma, please contact HBW for details.
Texas New Home Construction Review – July 2023

Last month, there were 7,865 new residential construction permits with a total value of nearly $2.2 billion added to the HBW database; this total reflects a 12 percent month-over-month increase in new home construction in the Lone Star State.  Out of the four major metro areas reviewed (Dallas, Houston, Austin, San Antonio), the highest volume of housing starts could be found in Houston (3,686 permits), while the highest average value of new home construction took place in Austin (average value: $381,118).

Here is a closer look at the total permits, average value of construction and leading counties in each Texas metro area during the month of July 2023:

Houston

As previously noted, there were 3,686 new residential construction permits added to the HBW database for the Houston area last month.  The average value of new home construction was $251,735, and the majority of permits originated from the two counties of Harris (1,626 permits) and Montgomery (1,133 permits).

Dallas

Last month, Dallas ranked #2 for new home construction, having just over 2,715 new permits on record with HBW for the one-month period.  The average value of new home construction landed on the higher end of the spectrum in Dallas (average value: $296,192) in comparison to other metro areas reviewed, and the bulk of new permits originated from the counties of Tarrant (940 permits) and Collin (608 permits).

San Antonio

Last month, there were nearly 750 new residential construction permits added to the HBW database for the San Antonio area.  The average value of new home construction was lowest in San Antonio (average value: $212,890) in comparison to other areas reviewed, and well more than half of all new permitting activity took place in Bexar County where there were more than 470 new permits on record for the one-month period.

Austin

In Austin, there were 715 new residential construction permits on record for the month of July. As previously noted, the average value of new home construction was highest in the Austin area (average: $381,118) in comparison to other Texas areas reviewed, and more than half of all new construction took place in Travis County (404 permits).

To gain more information on the builders, homeowners and permits for the construction activity above, check out HBW for your copy of the latest construction data reports. To gain access to the HBW database and receive custom and detailed reports on the latest residential and commercial building activity in Florida, Georgia, Texas, Alabama, and Oklahoma, please contact HBW for details.

Texas Swimming Pool Construction Report – July 2023

Last month, there were approximately 825 new swimming pool construction permits added to the HBW database for Texas, reflecting a 25 percent month-over-month increase in new pool construction.  Out of the four major metropolitan areas reviewed (Dallas, Houston, Austin, San Antonio), Dallas carried the greatest volume of pool starts (365 permits), while the highest average value of new pool construction could be found in Houston (average value: $72,504).

Here is a closer look at new swimming pool construction activity in Texas based on construction data on record with HBW for the month of July 2023:

Dallas

As previously noted, Dallas carried the highest volume of pool permits last month, having 365 new permits with a total construction value of more than $23 million.  The average value of new swimming pool construction was $63,631, and more than half of all new permits originated from the counties of Tarrant (83 permits) and Denton (92 permits).

Houston

Last month, there were more than 235 new residential construction permits with a total value of $17.2 million added to the HBW database for the Houston area.  The average value of new pool construction was highest in Houston (average value: $72,504) in comparison to other areas reviewed, and the greatest concentration of new pool construction activity could be found in Harris County (153 permits).

Austin

In the Austin area, there were just over 120 new swimming pool construction permits with a total of $7.1 million on record last month.  The average value of new swimming pool construction was $58,261, and the majority of all new permits originated from Travis County (95 permits).

San Antonio

Last month, there were 100 new swimming pool construction permits with a total value of nearly $3.9 million in San Antonio.  The average value of new pool construction was lowest in San Antonio (average value: $38,801) in comparison to other areas reviewed, and the county with the greatest concentration of new swimming pool construction activity was Bexar (79 permits).

To gain more information on the builders, homeowners and permits for the construction activity above, check out HBW for your copy of the latest construction data reports. To gain access to the HBW database and receive custom and detailed reports on the latest residential and commercial building activity in Florida, Georgia, Texas, Alabama, and Oklahoma, please contact HBW for details.

Florida New Home Construction Q2-2023

Since the start of this year (thru Q2-2023), Florida has exhibited a 28 percent year-over-year decrease in new residential construction, resulting in 50,920 new permits on record with HBW.  Out of the six regions reviewed (Central, West, Southeast, Southwest, Northeast, Northwest), all of them demonstrated year-over-year declines in new home construction ranging from -16 percent (Northwest) to -34 percent (Southwest Florida), with West Florida carrying the highest level of new construction activity (12,154 permits)

Here is a closer look at total permits and leading counties for each Florida region at the mid-year point:

West Florida

As previously noted, the western region of Florida carried the greatest amount of new residential construction permits (12,154 permits) through Q2, as well as demonstrated a 27 percent decrease in new permits in comparison to the same time last year.  Out of the seven counties that make up the western region, more than half of all new home construction took place in the counties of Pasco (3,366 permits) and Polk (3,112 permits).

Southwest Florida

Not far behind the western region, Southwest Florida ranked #2 for new home construction, having 11,136 new permits through Q2, reflecting a 34 percent year-over-year decrease in new residential construction.  Out of the five counties that make up the area, just over half of all new permits originated from the two counties of Lee (3,588 permits) and Manatee (2,367 permits).

Northeast Florida

In the northeast, there have been 8,924 new residential construction permits added to the HBW database since the start of this year (thru Q2), reflecting a 33 percent year-over-year decrease in new home construction.  Out of the eight counties that make up the area, nearly half of all new permits originated from the counties of St. Johns and Marion where there were 2,249 and 2,144 permits on record respectively for the six-month period.

Central Florida

Through the second quarter of this year, there have been 8,270 new residential construction permits added to the HBW database for Central Florida, reflecting a 25 percent decrease in new home construction in comparison to the same period last year.  Out of the six counties that make up the area, more than half of all new home construction took place in the two counties of Orange and Brevard where there were 2,270 and 2,183 new permits on record with HBW respectively.

Northwest Florida

Out of the six regions reviewed, the northwest is by far the most expansive, consisting of 16 Florida counties as well as 2 bordering counties in Alabama.  Through the second quarter of this year, there have been 5,920 new residential construction permits in the northwest, reflecting a 16 percent year-over-year decrease in new home construction.  Out of the 18 counties included in the report, nearly half of all new permits originated from the counties of Bay, FL (1,177 permits), Baldwin, AL (908 permits), and Escambia, FL (684 permits).

Southeast Florida

Through Q2-2023, there have been 4,516 new residential construction permits added to the HBW database for the southeastern region of Florida, reflecting a 23 percent decrease in new home construction in comparison to the same time last year. Out of the seven counties that make up the area, more than 60 percent of all new permits originated from the counties of St. Lucie and Palm Beach where there were 1,851 and 917 new permits on record respectively.

To gain more information on the builders, homeowners and permits for the construction activity above, check out HBW for your copy of the latest construction data reports. To gain access to the HBW database and receive custom and detailed reports on the latest residential and commercial building activity in Florida, Georgia, Texas, Alabama, and Oklahoma, please contact HBW for details.
Florida Swimming Pool Construction Report: Q2-2023

Since last year, new swimming pool construction has been declining in the Sunshine State. In 2022, Florida exhibited a 6 percent year-over-year decrease in new pool construction, and so far this year (thru Q2-2023), new swimming pool construction activity is down by 28 percent in comparison to the same time last year.

Through Q2-2023, there have been approximately 15,080 new swimming pool construction permits added to the HBW database for Florida. Out of the six Florida regions reviewed (Central, Southeast, Southwest, West, Northwest, Northeast), the highest volume of new swimming pool construction permits could be found in the southwestern region of the state (4,075 permits), while the lowest level of new construction took place in the northeastern region (1,487 permits). All areas reviewed have exhibited year-over-year decreases in new pool construction ranging from 6 percent (Northwest) to 38 percent (Southwest).

Here is a quick view of some of the latest permit data and leading counties by region:

Southwest Florida

As previously noted, there has been a 38 percent year-over-year decrease in new pool construction in the southwestern region of Florida, resulting in nearly 4,075 new permits on record with HBW through the second quarter of this year.  Out of the five counties included in the report, Lee County held the highest volume of new pool construction activity (1,007 permits), as well as the most significant year-over-year decrease in new permits (-50% YTD).

Southeast Florida

In the southeastern region of Florida there have been more than 2,940 new swimming pool construction permits added to the HBW database since the start of this year (thru June 2023), reflecting a 27 percent year-over-year decrease in new pool construction.  Out of the seven counties reviewed, the greatest concentration of new construction activity could be found in Palm Beach (931 permits) and Miami-Dade (674 permits), with both areas demonstrating a 34 percent year-over-year decrease in new pool construction.

West Florida

From January through June 2023, there have been approximately 2,820 new swimming pool construction permits added to the HBW database for West Florida, reflecting a 21 percent year-over-year decrease in new swimming pool construction.  Out of the seven counties reviewed, close to half of all new permits originated from the two counties of Hillsborough (858 permits) and Polk (534 permits), with both counties reflecting a 24 percent year-over-year decrease in pool construction.

Central Florida

Through Q2-2023 there have been 2,200 pool starts in the Central Florida area, reflecting a 24 percent year-over-year decrease in new swimming pool construction.  Out of the six counties reviewed, more than half of all new pool construction originated from the counties of Orange (768 permits) and Brevard (469 permits), with both areas demonstrating year-over-year decreases in new construction of 20 percent (Orange) and 24 percent (Brevard).

Northwest Florida

In the northwestern region of Florida, there have been more than 1,555 new swimming pool construction permits added to the HBW database through the second quarter of this year, reflecting a 6 percent year-over-year decrease in pool starts.  Out of the 18 counties reviewed, the highest concentration of new pool construction could be found in Walton County (315 permits) where there has been a 3 percent year-over-year decrease in new swimming pool construction.

Northeast Florida

Through Q2-2023, the northeastern region of Florida has experienced a 29 percent year-over-year decrease in new swimming pool construction, resulting in nearly 1,490 new permits on record with HBW.  Out of the eight counties reviewed, more than half of all new permitting activity took place in the counties of St. Johns (533 permits) and Duval (283 permits) where there have been year-over-year decreases in pool construction of 35 percent and 28 percent respectively.

To gain more information on the builders, homeowners and permits for the construction activity above, check out HBW for your copy of the latest construction data reports. To gain access to the HBW database and receive custom and detailed reports on the latest residential and commercial building activity in Florida, Georgia, Texas, Alabama, and Oklahoma, please contact HBW for details.