In the construction industry, we spend a lot of time talking about foundations—structural integrity, load paths, permitting, compliance, and the thousands of other elements that make a project stand upright and stay that way. But there is another kind of foundation that supports every successful contractor’s business, and it is one that we don’t discuss nearly enough: the visual foundation of your brand.
Photography—once a specialized, expensive, and occasionally temperamental craft—has become astonishingly accessible. The phone in your pocket now rivals what professional photographers once hauled around (and still do) in padded cases. Drones, once reserved for surveyors and cinematographers, are now standard tools on job sites. And video, once requiring a production crew, is something nearly anyone can capture with a steady hand and a bit of sunlight. That being stated, accessibility doesn’t automatically translate to effectiveness. The real value lies in knowing how to use the given tools to communicate your work, your process, and your professionalism. In an industry where trust is earned through proof, photography (and video) has become one of the most powerful ways to build that trust long before you ever shake a client’s hand.
Authenticity Over Stock
Contractors often underestimate how visually literate clients have become over the years. Homeowners may not remember the exact stock photo they saw last week, but they absolutely know what a real roof looks like, or a real pool excavation, or a real kitchen mid‑demo. They have a mental picture of what they want, and they are looking for a contractor whose work aligns with that picture. This is where real photos make a difference. Authentic imagery does so much more than fill space on a website or brochure; it demonstrates capability, while also displaying the range of your projects. It helps clients imagine their own home in your hands, and under the guidance of your expertise. And, perhaps most importantly, it differentiates you from competitors who rely on the same generic images circulating across the internet.
When you finally reach a solid prospect—thanks to the permit data and lead insights through HBW—they are already forming an impression. Updated, project‑specific photography helps ensure that impression is accurate, compelling, and memorable, not to mention relative to their needs.
Drone Photography
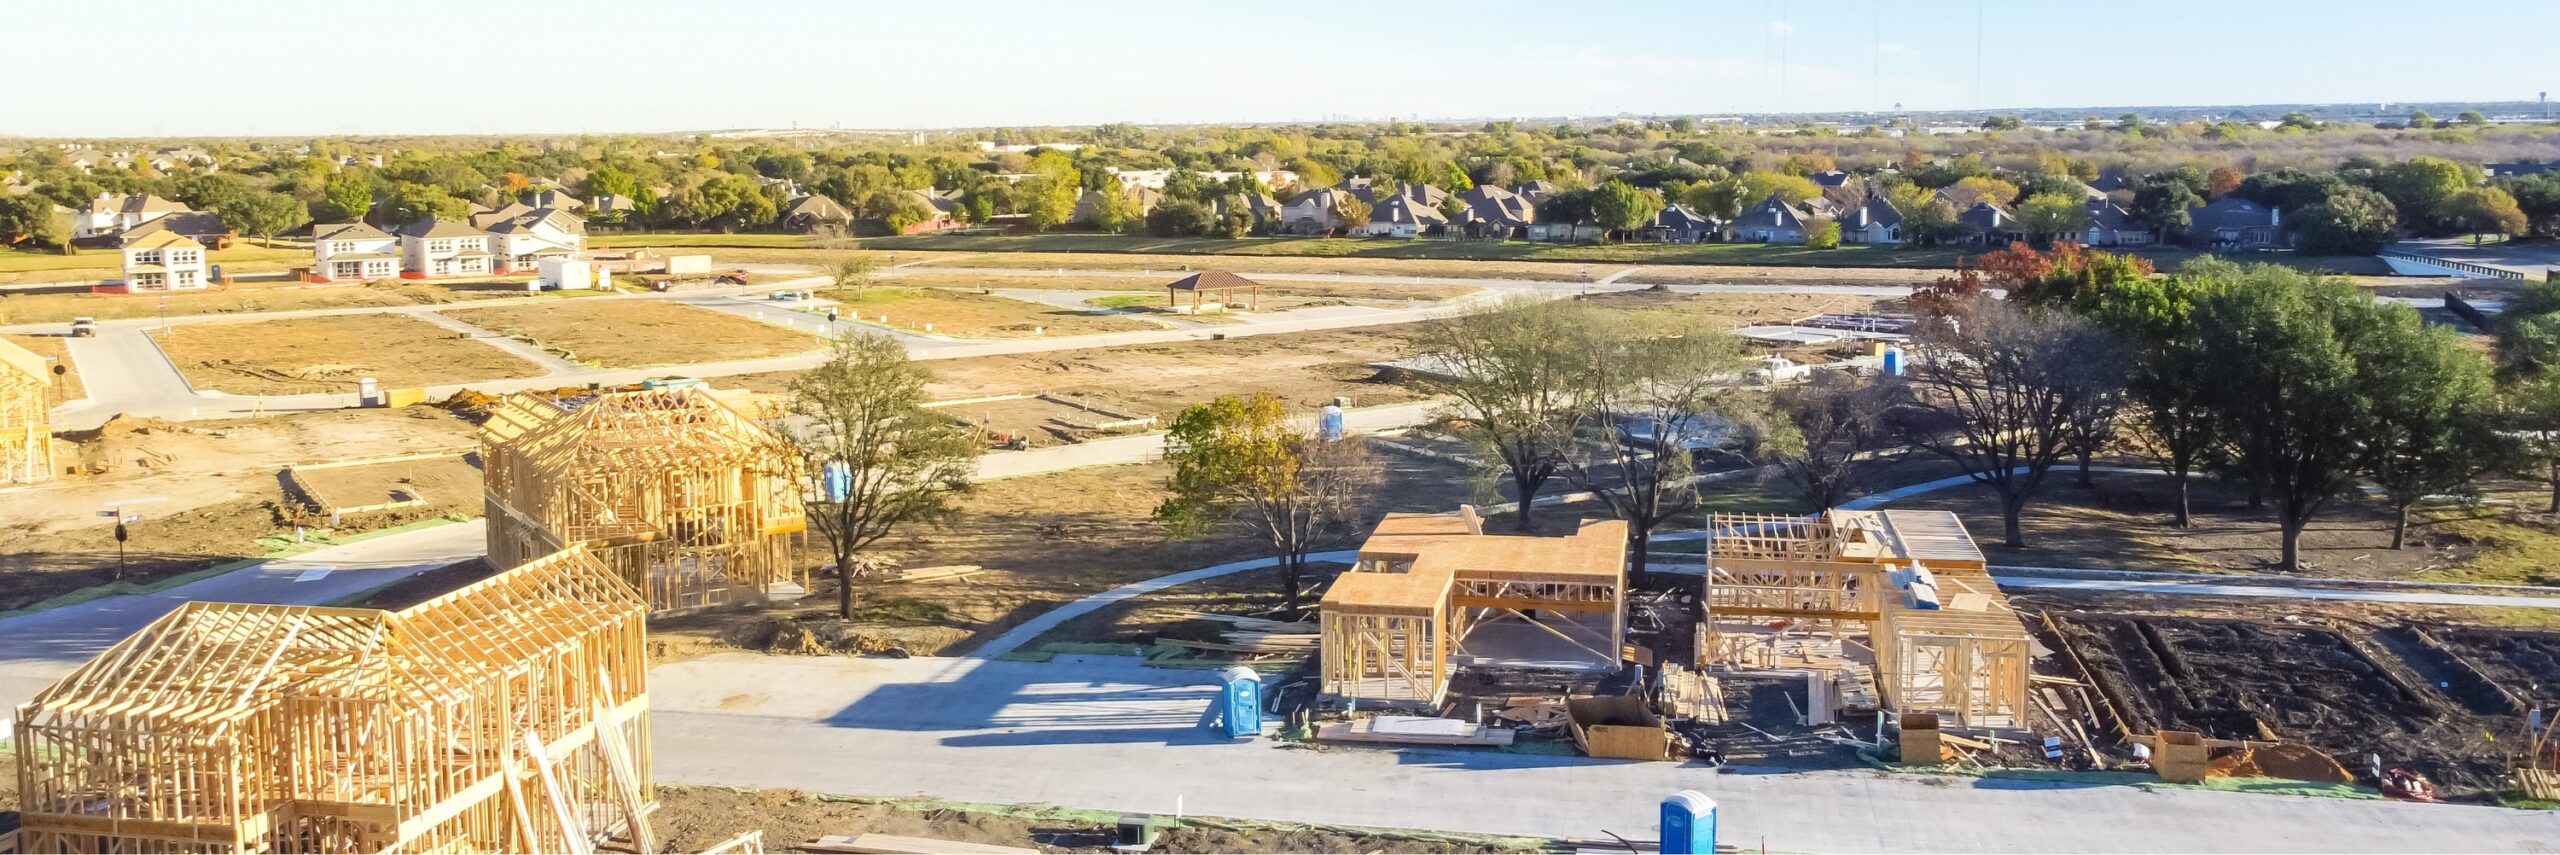
Drones have quickly become one of the most transformative tools in contractor marketing. They offer perspectives that were once impossible without scaffolding, a rented lift, or a helicopter, and they do it with remarkable clarity. Aerial imaging is invaluable for roofers who want to show the true condition of a structure, document installation accuracy, or highlight the craftsmanship of a finished system. It is equally powerful for builders presenting proposals; nothing communicates scope quite like a bird’s‑eye view of a property, especially when identifying issues or illustrating the logic behind a recommended solution.
Clients trust what they can see, and drone photography lets them see essentially everything.
Progress Documentation
The truth is that most clients aren’t on‑site every day; some aren’t on‑site at all. And while written updates are helpful, nothing compares to visual documentation. Photographs and videos of each phase (i.e. foundation work, framing, inspections, finishes) provide reassurance that the project is on track and being executed with care. Structural engineers have long relied on this kind of documentation when reporting to HOAs or property managers, and contractors can benefit from the same practice. A well‑organized visual record reduces questions, builds confidence, and demonstrates professionalism, while also becoming a valuable archive for future marketing.
Before & After
Renovation contractors know that transformation is their calling card, and there are very few things that display transformation more effectively than a simple before‑and‑after comparison; it the closest thing to magic the construction industry offers: two images, side by side, showing the impact of your expertise. From a kitchen expansion or pool installation to a structural repair or a full home remodel, such comparisons are irresistible to clients. Why? Because they are easy to understand, easy to share, and easy to remember.
Video
Statistics consistently prove that video outperforms static imagery in engagement across nearly every platform. People retain more information from video, spend more time watching it, and are more likely to share it. Just think of social media for a moment and you will recognize that video gets the most views, the most engagement, and preferred placement by the algorithm. For contractors, this is an opportunity to simplify complex information (explaining processes, materials, timelines, design decisions, etc.) in a way that feels approachable. Client testimonials are especially powerful in video form. While a written quote is helpful, seeing a real homeowner speak about their experience with your team—their relief, their excitement, their satisfaction—creates a level of trust that is simply unmatched by text alone. Video also excels in behind‑the‑scenes content; providing a look at your team at work, collaborating with partners, or problem‑solving on-site is a great way to humanize your company and demonstrate transparency.
The Human Element
Construction is technical, but hiring a contractor is personal, and most clients do not personally relate to technical information and jargon. Clients want to feel comfortable with the people who will be in their homes, around their families, and responsible for their investment. Photography and video can be a helpful tool in bridging that gap. Team photos that go beyond headshots (images from company events, community involvement, candid moments onsite) create relatability and allow your brand’s personality to shine through. They reflect that your company is more than a logo and tagline; it is a group of real people who care about their work. There is actually a term for this: brand intimacy. It is the emotional connection clients feel with a company, and it is considered to be one of the strongest predictors of loyalty. Visual storytelling is one of the most effective ways to build it.
HBW gives contractors the data they need to find new opportunities (permit insights, market trends, and lead intelligence), but once you have a prospect’s attention, what you show them matters just as much as what you tell them. Photography and video should not be considered as accessories to your marketing; rather, they are core components of your brand identity, communicating your expertise, reliability, and craftsmanship. Imaging plays a critical role in clients understanding your work, trusting your process, and feeling confident choosing you for their project.
For more information on construction business marketing tips, stay connected with the HBW Blog. To get ahead of construction activity and gain access to the latest permitting data in Florida, Texas, Georgia, Alabama and Oklahoma, contact HBW for more information on construction data reports and industry leads.