HBW Report: Top Texas Home Builders – October 2015

hbw top texas builders october 2015

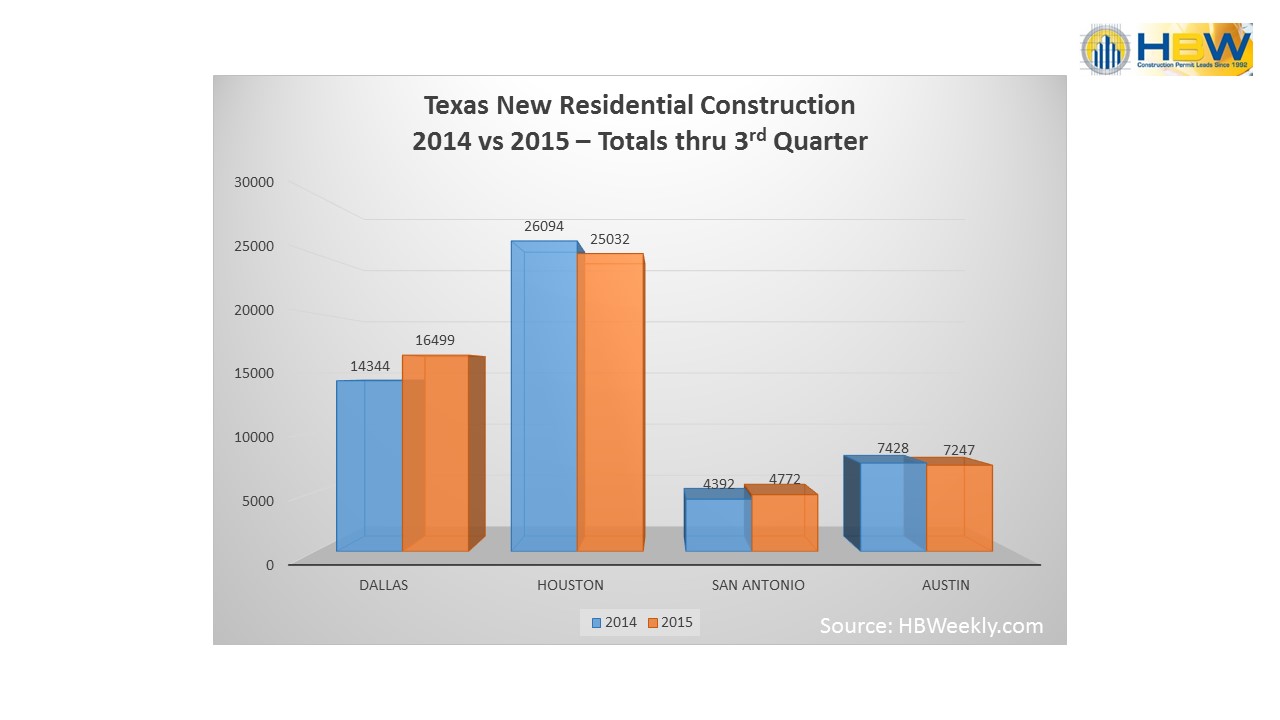
It has been reported that Texas broke a record for rainfall during the month of October. From October 22nd to October 31st, Texas experienced a record 5.32 inches of rain across the state (7.75 in San Antonio).  Despite the rain, home builders were still busy with new permits and starts.  When searching the HBW database for Texas new residential permitting activity throughout October, we found nearly 5,000 new permits in the areas of Dallas, San Antonio, Houston, and Austin.  Houston led the state in total number of starts with 2,174 permits on record for the month, while Dallas led the state in total value of new residential construction with a total of nearly $464 million.

Now that we have an idea of where the bulk of new residential construction occurred in Texas last month, let’s take a look at which builders were busiest and driving the figures in each area:

Houston:  Congratulations Houston – You led the state for new residential construction in October! As previously mentioned, D.R. Horton came in #1 for total number of permits for the month (217 – total value: $29,596,744).  In the #2 spot, Lennar Homes had 122 new starts in the area and an impressive $18,960,795 in total value.  Perry Homes took the third spot for total permits (106) and was #2 in total value with $22,593,350.  Harris County had the highest total value in new construction for the month at more than $203 million.

Houston Top Builders - October 2015

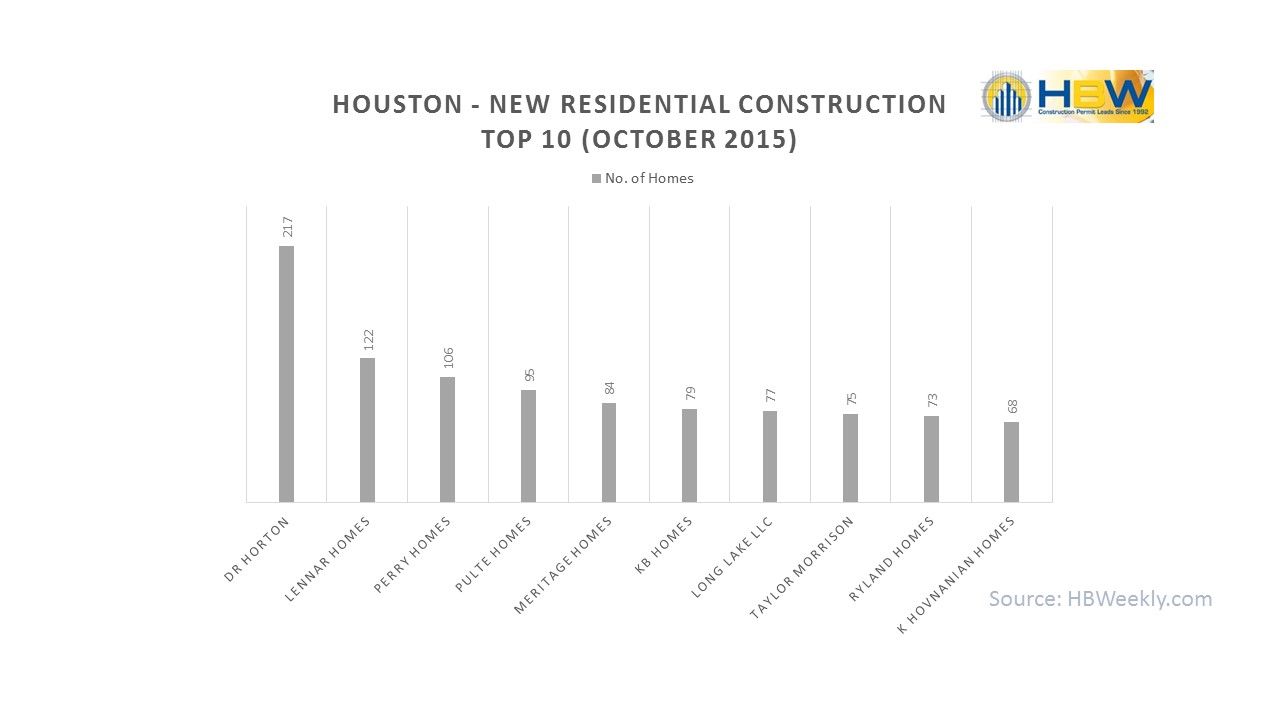
Houston Top Builders – October 2015

Dallas: Dallas is a hot market for real estate.  According to recent report by Market Watch, home prices have increased 12% and even as high as 20% in some areas.  With the continued increase in population, (130k-140k people moving to area every year), the demand for housing certainly outweighs availability. This demand continues to keep home builders active.  During October, D.R. Horton dominated residential construction in the area with 390 starts (total value: $74,664,175), the most new permits on file in October for any one company (for a given area) in the state.  The second and third spots were close with First Texas Homes adding 55 new permits (total value: $16,373,186) to the HBW database and Beazer Homes adding 50 new permits (total value: $13,502,187) for the month.

Dallas Top Builders - October 2015

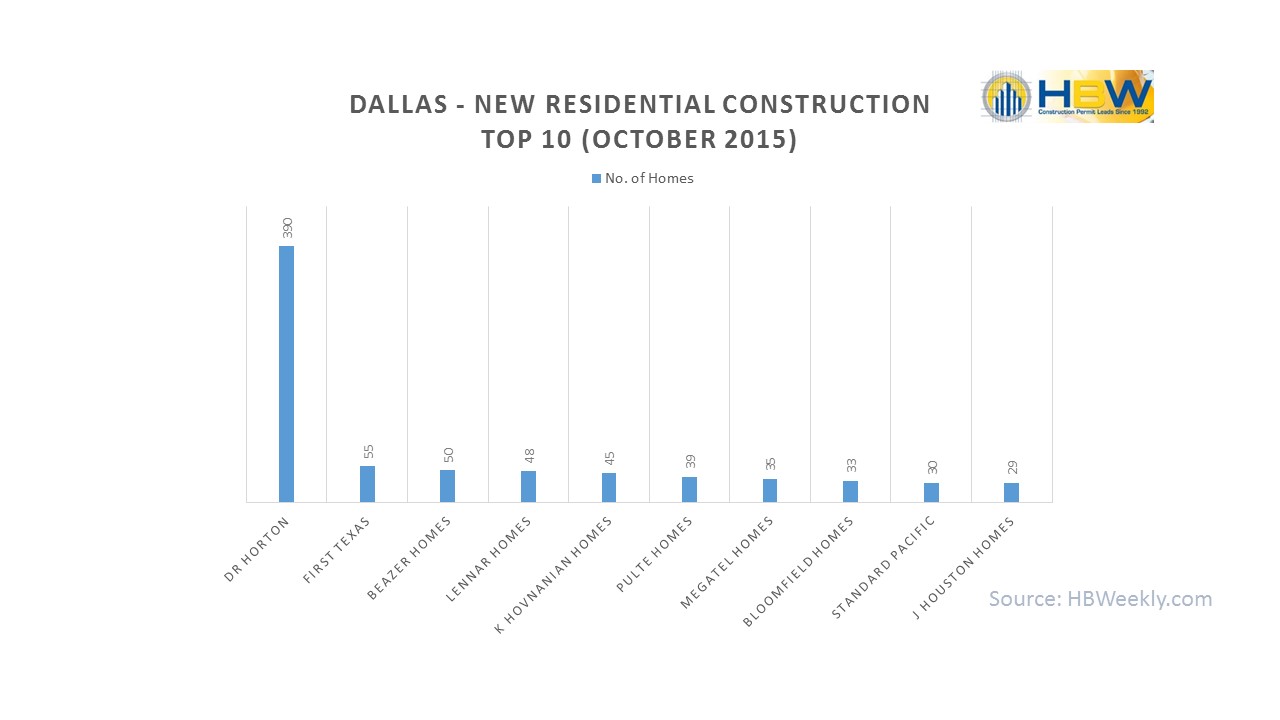
Dallas Top Builders – October 2015

Austin: According to the Austin American-Statesman, home sales and prices in Austin and across Texas continued to rise in Q3. During the 3rd quarter in Central Texas, 9,347 homes sold, an 8.7% increase in comparison to 2014 (source:Texas Quarterly Housing Report). The median price of those sales was $260,000, which is a 7.2% increase from Q3 in 2014.  D.R. Horton held a significant lead (131 permits – total value: $20,866,918) on new construction in the Austin area at the start of Q4, more than double the #2 spot held by KB Homes (61 permits – total value: $10,195,426).  In the third spot, Pulte Homes has 45 new permits on file for the month with a total value of $9,815,758.

Austin Top Builders - October 2015

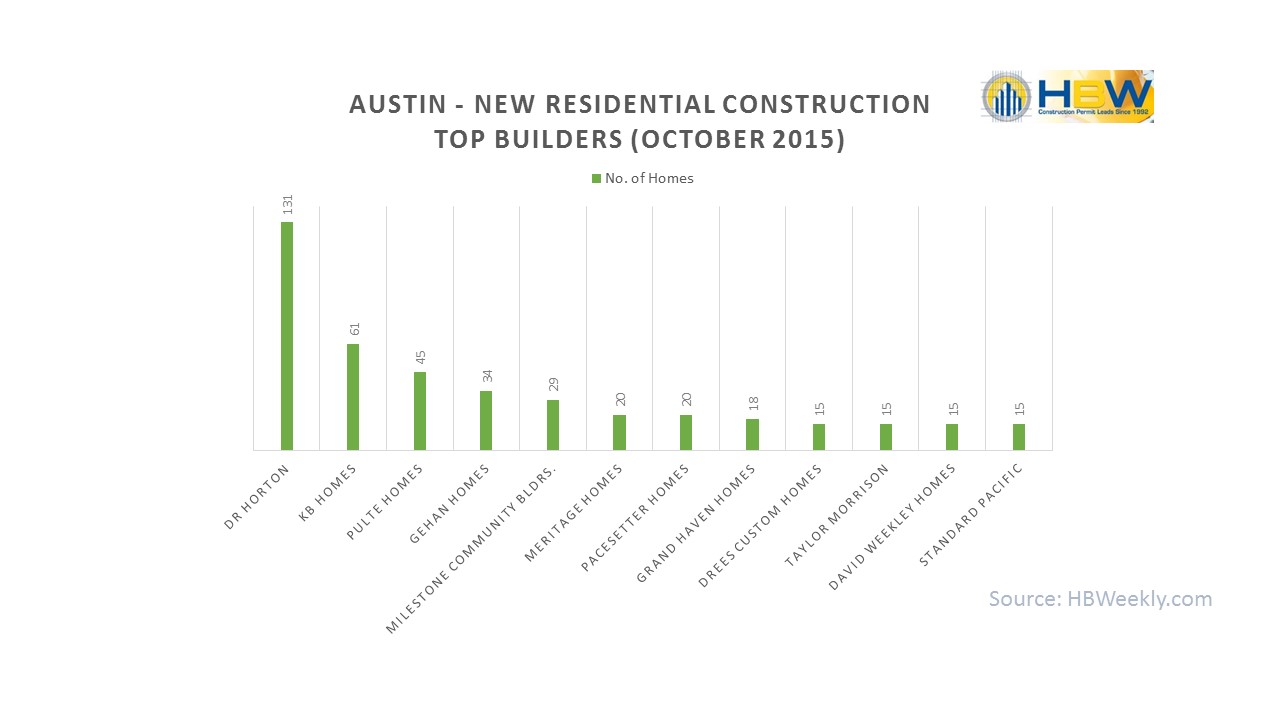
Austin Top Builders – October 2015

San Antonio: When it came to rain, San Antonio experienced the worst of it in October, which may have impacted new construction in the area.  In comparison to August, there was a minor slump in total starts, dropping just over 25% from our August report.  Based on the latest HBW permit report for the area, 433 new permits are on file for the month. KB Homes led the area in total number of permits (51 – total value: $10,205,185), while Continental Homes of Texas came in second for total starts (44) and first for total value ($10,267,437). In the third spot, Bella Vista has 33 new permits (total value: $6,988,830) in the area for October.

San Antonio Top Builders - October 2015

San Antonio Top Builders – October 2015

New construction permit information utilized for the graphs and above listed figures was directly derived from HBW construction data reports. To gain access to the HBW database and receive custom and detailed reports on the latest permits in Texas and beyond, please contact HBW for details.

Getting Started with Content Marketing

Getting started with content marketing can be less overwhelming when you break it down and start with the basics.
HBW reports on content marketing

When developing a marketing strategy, there will need to be room for content marketing.  Everyone is talking about content marketing, but for those just getting started, it can seem like an overwhelming task.  What content should I develop?  Where do I publish content?  Which medium is best for reaching my target audience?  These are all good questions, but to get solid answers and find a direction for your business, you will first need to cover the basics.

  1. Define Content – In short, content marketing provides valuable information to prospects and clients and creates loyalty to the brand. You will want to tell a story, but first you will need to define it. Don’t just post a random article or video because it is available. Be thoughtful about topics, thinking about who it will reach and why it is important to share. The purpose is to drive your audience back to your business, not just to give away information and move on.  Your story should encourage your audience to take the next step, so chart out your goals and the direction to which your content is designed to lead them. Once you have generated your content, you will need to entice the reader to “click”, so make sure your headline is clear and provides enough information about the whitepaper or article to warrant a “click”.
  2. Be Consistent – not only in voice, but in content. Try to create a series or bridges between past and present posts and articles.  Refer back to previous publications for support, and allow the narrative to continue by offering downloadable guides and whitepapers.  Although keeping the message consistent is obvious, frequency of posts may be overlooked.  We all experience an ebb and flow of ideas and useful content, but make sure your distribution of such material does not follow stream of consciousness.  Be strategic with your content and consistent in how often you provide such information.  Once you get started, it is crucial that you stick with a schedule, remain fluid in topics covered and maintain the voice of your brand.
  3. Know Your Audience – and their questions. Put yourself in your target audience’s shoes. What questions would they ask about your product or service? What keywords would they type into Google if they were looking for home building and remodeling advice?  What are the most frequently asked questions you receive from clients? There is no “one size fits all” when it comes to content marketing; if there is a specific segment of your audience that wants to learn more about your latest designs or products, consider offering a regular weekly or monthly update covering that specific area of interest rather than a general e-newsletter to all.
  4. Choose a Medium – and stick with it! Where you post information is just as important as what you post. You have many options: Blog articles, podcasts, downloadable guides/whitepapers, infographics, videos.  Don’t simply base it on what you want to do say, but think about where the best place would be to say it.  If your audience is more active on YouTube, then develop videos that will be of interest to them. If you are looking to reach business professionals, publish articles on LinkedIn and become active in related groups.   Although you will ultimately want to have your content shared in as many mediums as possible, narrow down the point of origin to mediums that are most effective for reaching your audience.  It is better to be effective in one or two areas then spread thin across ten and not effective at all.  Find the medium that works and keep plugging away.
  5. Partner Up – Your content is only effective if your audience reads it. Partner with companies, publications, LinkedIn groups, industry associations, etc. to share your content (and return the favor).  Create a network for the conversation to grow, exchanging links and opportunities for your material to be discovered.  You may also consider developing “exclusives” for your stronger partners which will provide them with an incentive to drive your message out to their networks.  Don’t overlook employees either.  Employee Generated Content (EGC) is vital to developing and sharing information.  Your team is rich with talent and ideas about your business, products and services. By providing them with an opportunity to share their knowledge and enthusiasm for your business, you will open the door to authentic and trusted content that can effectively drive brand engagement. At the same time, you will need to have a management system in place for viewing how and where they share, but once you create a structure and guidelines, they will be a palpable force driving your marketing efforts.


To learn more about ways home builders and construction professionals can be effective in marketing and business development, continue to check the latest from the HBW Blog.  To get ahead and gain leads through custom building activity reports throughout Florida, Texas, Georgia, Oklahoma and Alabama, contact HBW for more information.

Industry Update: U.S. Construction Spending Up 0.6% in September

Construction spending during September 2015 rose 0.6% to a seasonally adjusted annual rate of $1.09 trillion.

construction spending rates may-sept 2015

Earlier this week, the U.S. Department of Commerce reported that construction spending increased to a seasonally adjusted annual rate of $1.09 trillion, which is a 0.6% increase since August.  Normally, I would not report on small percentages, but this figure stood out as it brought construction spending estimates to the highest level since March 2008.  Additionally, the figures for September 2015 are significantly higher than total construction estimates in September 2014, 14.1% higher to be more specific.

Of course, you can easily perform your own research on construction industry statistics by following reports and releases from the Department of Commerce, but to make it easy for you, we have compiled a snapshot of construction spending estimates as reported through September 2015.  In order to gain a better sense of the highs and lows in our industry and identify types of construction that are driving the national rates, here is the breakdown based on the U.S. Census Bureau’s News Release (11/02/15) and September “Value of Construction Put in Place” report.

Through the third quarter (Jan-Sept) of 2015, construction spending totals were 10.5% higher than the same period in 2014.  When looking at public and private construction, there are some significant gains in certain residential construction from August 2015 to September 2015 (multi-family +4.9%, single-family +1.3%), while private nonresidential construction slipped down (-0.7%) below the revised August estimate to a seasonally adjusted annual rate of $399.5 billion.  Overall, private and public construction experienced small increases from August, with September estimates bringing public construction up 0.7% from August to $300.0 billion, and private construction up 0.6% for a seasonally adjusted annual rate of $794.2 billion.

U.S. Construction Spending - Seasonally Adjusted Annual Rate Aug 2015 vs. Sept 2015

U.S. Construction Spending – Seasonally Adjusted Annual Rate Aug 2015 vs. Sept 2015

So what’s driving the increase?  In the private sector, residential construction increased 1.9% since August and 17.1% in comparison to September 2014.  Although nonresidential construction in the private sector dropped -0.7% from August to September to a seasonally adjusted annual rate of $399.5 billion, construction of churches and other religious buildings rose 5.6%.

In the public sector, residential construction increased 1.2% from August and up 22.7% in comparison to September 2014. Educational construction increased 2.4% from August to a seasonally adjusted annual rate of $69.1 billion, while the biggest increase for the month was in public water supply construction (+4.8%).

Although there are slight increases from the months of August 2015 to September 2015, when comparing September 2014 figures and September 2015, total construction spending estimates are up 14.1%.  The standout areas of growth between 2014 and 2015 are as follows: Residential construction (+17.2%); lodging construction (+32.8%); amusement and recreation construction (+30.6%); office building construction (+19.3%).

To learn more about U.S. construction spending, reports and the data listed above, visit www.census.gov.  To gain access to construction permitting data and receive custom and detailed reports on the latest building activity in Florida, Texas, Georgia, Oklahoma and Alabama, contact HBW to request a complimentary construction report.

HBW Report: Top Pool Builders in Florida

If you are looking for leads in Florida, just take a look at the new pool construction permits added to the HBW database in September.

FL POOL BUILDERS HBW

Looking for leads in Florida?  Then look no further – HBW has been busy tracking and organizing pool permitting activity in Florida, and more than 1,500 new permits were added to the database in September!  Looking at Orlando, Jacksonville, Tampa, Southeast and Southwest Florida, there were a number of builders who made it to the top of the leader board last month.  The top swimming pool builders are those that have the most new construction on file for a given month, and there were a number of standout areas and companies.  Let’s take a look at how Florida pools stacked up in September throughout the state:

Overall, Southwest Florida was the busiest in September, with 498 new pool permits (total value: $20,410,392) on record for the month.  Orlando pool builders were also active last month with 338 new pool construction permits (total value: $12,208,399) added to the database.  The Southeast portion of the state was the third busiest area as 278 new pools are on record for September with a total value of $10,680,657.

Florida Pool Permits by County - September 2015

Florida Swimming Pool Permits by County – September 2015

Southwest Florida

With Southwest Florida leading the state for activity in September, it is a good place to start when looking at the leading swimming pool builders. Aragon Pools and Spas made the #1 spot with 37 new pool permits (total value: $1,195,000) added to the database for the month.  Close behind in the second spot for total permits and first for total value is Pinnacle Pool Construction with 35 new pools and a total value of $2,023,470.  Both companies had a primary service area of Collier County with some (but less) activity in Lee County. Two companies tied for third with 24 new swimming pools each on file: Holiday Pools of West FL (total value: $878,000) and Serenity Pool & Spa LLC (total value: $772,000).

Southwest FL Top Pool Builders - Sept. 2015

Southwest FL Top Swimming Pool Builders – Sept. 2015

Orlando

Orlando swimming pool builders were busy for the month as 338 new permits were added to the HBW database in September; the bulk of activity took place in Orange (121 pools), Osceola (84 pools) and Brevard (56 pools) counties.  All Seasons held a strong lead and #1 spot with 68 new pool construction permits for the month and the highest total value of $2,070,454.  Holland Pools followed with 39 new pools (total value: $1,284,908), and Atlas Pools of Central Florida (total value: $787,267) tied with Martin Pools Inc. (total value: $754,296) for the third spot and each with 19 total new permits on file for the month.

Orlando Top Swimming Pool Builders - Sept. 2015

Orlando Top Swimming Pool Builders – Sept. 2015

Southeast Florida

There was a fairly wide distribution of pool building in Southeast Florida, as more than 100 swimming pool builders were responsible for the area’s 278 new permits for the month. Louden Bonded Pools led Southeast Florida in September with 14 new pools on file and a total value of $518,994.  The bulk of Louden’s activity was in Indian River County.  Second and not far behind are two companies that both have 12 new pool permits for the month: Fountain Blue Pools Service (total value: $485,262) and A & G Concrete Pools (total value: $441,800). Two companies also share the #3 spot – Pools by Greg Inc. (total value: $392,248) and Swimming Pool Contractors, LLC (total value: $289,192) with each adding 11 new permits to the HBW database.

Southeast FL Top Swimming Pool Builders - Sept. 2015

Southeast FL Top Swimming Pool Builders – Sept. 2015

Tampa

The Tampa area had 264 new pool permits on file for September, with the majority of building activity taking place in Hillsborough (86), Polk (58) and Pinellas (55) counties.  All Seasons led with 23 new pool permits and a total value of $939,564.  Tampa Bay Pools Inc. took the #2 spot with 16 new pools (total value: $733,805), and Gulfstream Pools & Spas (total value: $632,273) and Challenger Pools (total value: $472,147) both took #3 with 14 new permits each on record for the month.

Tampa Top Swimming Pool Builders - Sept. 2015

Tampa Top Swimming Pool Builders – Sept. 2015

Jacksonville

With 147 total new pool permits in September, Jacksonville pool builders were busiest in St. Johns (43), Duval (40) and Flagler (39) counties.  Waldhauser & Son led the area with 12 new pool permits and a total value of $435,400 for the month.  Not far behind, Stanley Pools Inc. with 11 permits (total value: $372,243) and Blue Haven Pools with 10 permits (total value: $376,727) held the second and third spots respectively.

Jacksonville Top Swimming Pool Builders - Sept. 2015

Jacksonville Top Swimming Pool Builders – Sept. 2015

Information utilized for the graphs and above listed figures was directly derived from HBW construction data reports. To gain access to the HBW database and receive custom and detailed reports on the latest building activity in Florida and beyond, please contact HBW for details.

Instagram for Construction Professionals

Instagram is more than just images; it is a powerful tool that construction professionals can use to build brand awareness.

screenshot source: Instagram.com

screenshot source: Instagram.com

Who has time for another social media platform?  None of us, really, but don’t let that stop you this time.  Instagram is one of the easiest social media platforms to get started, and for construction professionals, it can be the perfect place to make an impact with powerful images and examples of your work.  Unlike your website or blog, you don’t need to craft a lengthy description or provide exhaustive details.  Instagram is short, to the point and all about the image.

Don’t let the overabundance of selfies sway you, Instagram really has a place for business.  According to Instagram’s business site, their network has more than 400 million active users every month, with more than 80 million images added each day.  There are opportunities for creating ads, as well as the ability to create web profiles that capture recently shared photographs and space for information on your business (bio).

If you are new to social media and just getting your feet wet, definitely check out HBW’s Blog post from August “Social Media: It’s Time for a Check-Up“, which will provide basic guidelines for getting started or tighten your current profile.  For those ready to get the latest designs and videos out to the public in an “instant”, here are a few ways to maximize your use of Instagram.

  1. Do Your Research – Although you may want to hit the ground running, just pause for a moment. Before you create your profile and begin snapping away, take a look at other construction professionals and their accounts.  Social networks are communities, and you will want to see what gets the most attention and the latest industry-related conversations.  By taking time to view what other industry professionals are sharing, you will have a better idea of the quality and types of images that are garnering interest in construction and design.  This is a great way to get inspired and gain an understanding of relevant topics, not to duplicate; to stand out in the crowd, you will need to be unique to your business in both image and brand.
  2. Establish Goals – Although it’s easy to snap a pic and post it to Instagram, the thought behind the image may take a little more time. Post with a purpose.  Your goals in your marketing strategy should apply to Instagram… They should be realistic and measurable.  If you are trying to increase traffic to your website, be sure to include appropriate links and a compelling reason to visit/click.  If your intent is to increase mentions of your latest branded hashtag, ask your audience to post their own images using the hashtag; make comments visible, and share images that include your hashtag.  Don’t just add an image because you can and want to expand your collection; create a conversation that aligns with your goals and engages your audience.
  3. Be Mobile – Remember that you have a camera and video camera on your phone and that Instagram is mobile. Capture the latest job site, a new design, a popular product you are using, a completed project or a group photo at the company holiday party. With Instagram’s filters and tools, you can easily make an ordinary photo look extraordinary.  Professional photos are also important, but don’t be afraid to be real.  Your audience is looking to connect with you, not to see a filtered version of an advertisement.  Of course, with being real comes some basic guidelines – Don’t get snap happy with everything; keep #2 (goals) in mind, and stay away from controversial pics that could backfire. Also, make use of the sharing capabilities that Instagram offers; some of your more powerful images can be shared on your Facebook and Twitter accounts through the app as well, keeping images consistent and taking the work out of adding it separately to other profiles.
  4. Be Dynamic – In addition to adding photos, you can share 15-second videos on Instagram. Since they are short videos, they can be used to capture your team at an industry event or tradeshow, a tour of a finished design, or a sneak peek of a work in progress. Allow the audience to get personal (not too personal) with your business; you can provide a behind-the-scenes look at what you do and your team so that the viewer feels connected to your business in a way that goes beyond your finished designs and service list. Be active by responding to comments, liking and commenting on your followers’ photos and sparking discussions about your products and services. Change it up, and remember to keep it positive.
  5. Use Hastags – Don’t rely on the image alone. Develop unique and catchy hashtags that reflect your brand and will drive your audience to your image. Less is more in that you will be more effective in sticking with less (one or two) hashtags that become signature to your brand rather than a new hashtag for every post.  Create a hashtag that does double-duty by embodying your brand and encouraging followers to share photos that fit that image. A strong hashtag and reason to use it provides increased exposure to potential clients, and can be useful in creating a “buzz”. Don’t limit yourself to your company’s branded hashtag; join larger conversations such as  “#ThrowbackThursday”, “#MondayMotivation” or “#NoFilter” to increase visibility in search results. To learn more about developing hashtags, check out the HBW Blog post: “Contractors Ask: How Should I Use #Hashtags?”.

Instagram, just like any social media platform, is only as good as you make it work for your business.  Once you get started, stay active and consistent.  More than just showcasing your work, Instagram gives your potential clients a way to connect to your business and learn a little more about the team behind the product and service.  Keep your goals in mind, and monitor your progress.  Although you won’t see “instant” results, you will find that over time, Instagram can be a useful tool in your marketing strategy and for building brand awareness.

For more tips on marketing your business, check out the latest HBW White Paper Report to gain access to information for successfully marketing your business through HBW construction building and swimming pool permit data. HBW White Papers guide your sales force on how to navigate HBW permit lead reports and use them to achieve a competitive advantage.

Florida’s Top 10 Builders – September 2015

hbw top 10 fl

Housing starts rose 6.5% in September.  Here is a look at the builders that were leading the sunshine state last month.

Looking for leads in Florida is easy; just take a look at the new home starts in September.  HBW subscribers who have been keeping an eye on new residential construction have probably already noticed some of the busier areas throughout Florida.  Taking a look at Jacksonville, Orlando, Tampa, Southeast and Southwest Florida, more than 3,700 new residential construction permits were added to the HBW database in September, and Southwest Florida led the state with 917 total new home starts.

According to the latest from the Commerce Department, housing starts in the U.S. rose by 6.5% in September 2015 to a seasonally adjusted annual rate of 1.21 million homes, with the South being an area where construction is on the rise. Another step in a positive direction was published in the New York Times earlier this month, noting that the National Association of Home Builders/Wells Fargo reported that builder sentiment rose to 64 (>50 = good sales conditions) in September, the highest since October 2005.

Figures from the HBW database also reveal some gains throughout Florida.  Here is a look at new residential construction activity and the top 10 leading companies throughout the state.

Jacksonville

Jacksonville had 652 new home starts in September, with D.R. Horton maintaining the #1 spot at 109 starts (total value: $16,055,936).  Dream Finders Construction followed in second with 63 and close in total value ($15,153,481).  In the third spot, David Weekley Homes started 42 new residential construction projects with a total value of $13,677,913.

Top 10 Builders Jacksonville - September 2015

Top 10 Builders Jacksonville – September 2015

Orlando

Overall, Orlando was the third busiest area in September with 768 new residential permits on record. Still leading since our July report, Lennar Homes maintained the #1 spot with 78 new home starts (total value: $21,435,058), with the bulk of activity occurring in Orange and Osceola counties. Although Meritage Homes came in second for total number of starts (72), they led in total value ($28,055,552).  In third, Taylor Morrison remains thriving in Central Florida with a total of 44 (total value: $19,159,252).

Top 10 Builders Orlando - September 2015

Top 10 Builders Orlando – September 2015

Tampa

The Tampa area has been healthy and holds second place in the state for the month of September with 836 new home starts.  The Villages of Lake Sumter led construction in the Tampa area with 127 starts (total value: $36,665,877), with all activity occurring in Sumter County.  D.R. Horton (69 – total value: $14,286,784) and Lennar Homes (44 – total value: $11,436,860) were busy in Hillsborough, Pasco and Polk counties and are positioned in second and third for September.

Top 10 Builders Tampa - September 2015

Top 10 Builders Tampa – September 2015

Southwest

As previously mentioned, Southwest Florida led the state in September with 917 home starts on record.  Pulte Homes held a strong lead in the area with 112 total new residential construction starts (total value: $29,184,568).  In second, D.R. Horton was at 67 (total value: $17,240,525), and Lennar Homes held strong in third with 57 starts (total value: $12,659,535).

Top 10 Builders Southwest FL - September 2015

Top 10 Builders Southwest FL – September 2015

Southeast

According to a recent article in the New York Times, South Florida has been experiencing a construction boom of its own as the bulk of new activity heads to northern parts of the area.  As prime real estate becomes limited in Miami-Dade (South), developers are moving slightly north to Broward and Palm Beach counties.  In September there were 554 starts, with the #1 builder in the area being Lennar Homes (123 starts – total value: $50,667,078). G.L. Homes followed in the second spot with 74 new residential permits on record for the month (total value: $22,049,176), with all activity following the northern moving trend to Palm Beach County. D.R. Horton held a close third for total new home starts (68) and second for total value ($24,808,055).

Top 10 Builders Southeast FL - September 2015

Top 10 Builders Southeast FL – September 2015

Information utilized for the graphs and above listed figures was directly derived from HBW construction data reports. To gain access to the HBW database and receive custom and detailed reports on the latest building activity in Florida and beyond, please contact HBW for details.

5 Ways to Better Email Marketing

It’s easy to send bulk emails to your mailing list, but getting the most out of it may require a little extra fine-tuning.

email


How many unread emails do you have in your inbox (or your trash)?  Chances are that you have more emails than there are hours in a day to read them, and that’s just your daily business communications.  Beyond that, you have your newsletters, promotions, social updates and advertisements.  We are simply swamped, and getting someone to open an email is becoming more and more challenging as the inboxes hit their limits.  For this reason, it is critical that you make the most of each email to ensure that you are communicating clearly, capturing your audience quickly and providing the links and resources they need to connect with your business.  Here are five tips to get you started:

  1. Track Progress – Tracking your progress goes beyond merely reviewing the number of “opens” for each email. Email campaign analytics and reports are only as good as you make and apply them.  Take the time to recognize patterns with individuals and with subject matter.  Pay attention to key metrics: Click-through rate (CTR), sharing/forwarding and conversion.  Your conversion rate goes beyond the click and focuses on how many of your subscribers took action on your “call to action”.  For example: If you want the reader to download the latest tile sample guide or respond to an invitation, those who download the guide or respond to the invite are considered a conversion. It is great if the reader clicks on your link, but your ultimate goal is to have them take action.  If you have bounced or invalid email addresses, have someone in your office verify and update contact information.  Email service providers (ESP) like Constant Contact and MailChimp have tools already built in for tracking activity with contacts.  With high sensitivity to spam, make sure you have consent (in some form) to email your contacts, and always have the option to “opt-out”. You don’t want to get a bad reputation or increase the likelihood of being blocked or identified as a spammer.
  2. Subject Matters – As you may already know, your subject line matters. Old, boring, repetitive and generic subject titles are destined for the trash.  Just as your content should stay fresh, so should your subject line.  Think about it… With more email being opened on tablets and smartphones, the subject is often the only thing that the reader will see unless he/she opens it. Additionally, what they see may just be the first 4-5 words (50 characters or less), so frontload the subject in a way that grabs attention or requires the reader to view more in order to see the whole message.  Also, don’t forget about the first sentence in the header (above the main body) of the email.  The first line of the email will also be visible to the reader, so it should contain enticing tidbits such as a deal or a limited time offer.  Avoid SPAM trigger words like “Clearance”, “Order”, “Sale”, “Click Here” and “Free”.  Instead, the subject line should pique curiosity with “how to” or include familiar and relatable concepts such as their local area/city or products and services they have used or purchased from you before.  When pursuing an HBW lead, you will already know everything you need to customize your email, from their neighborhood to the various services they may be seeking based on the type of construction and date of start.  Many ESP’s offer a variety of tools to customize the subject line, so consider using merge tags, as well as testing tools for finding related and popular subject titles.
  3. Schedule – The scheduling feature has a variety of benefits, from preparing a cohesive campaign months in advance to saving time in production. That being stated, scheduling also holds value in that you will want to reach your reader at the right time of day and during the week when open rates are at their highest.  As contractors, the day starts before the sun rises, and email is often read before the workday begins.  For customers, this is not so much the case.  Most often, your early morning email will make it to the bottom of their inbox when they view it at 9:00 am, so plan accordingly.  Perhaps a post-lunchtime email or mid-morning break will work best; maybe your readers are more inclined to open in the evening hours – just know your audience.  The day you choose is also important.  Some ESP’s have send time optimization features, and you may determine they are worth the additional investment.  When starting out, you can follow the basic rule of not scheduling emails on Mondays, with popular research showing that Thursday is a prime day for “opens”.  This is where the previously mentioned metrics and tracking will become useful.  Sending on a popular day may just mean that your email will be lost in the mix of the many other email blasts your customer receives.  Start with Tuesday through Thursday for promotions, and follow your metrics to see if there is a “standout” day for responses and activity.
  4. Be Direct & Dynamic – With email being a way to get in front of our audience, it can be tempting to pack it with every detail from company information to descriptions of services. Resist the urge!  Your email should be concise and to the point.  You should have a clear objective, and your call to action should be evident and easy to understand.  Construct your email to include eye-catching headers and brief but effective content.  To elaborate on a subject, add links that lead the reader back to your website or a given download.  Have contact and social media links easy to view and accessible.  Don’t make your reader scroll to the bottom to get to your message.  Your call to action should be in the first few sentences, and additional information, articles and details should be available through links.  Images and videos should follow the same rule.  Images can help in grabbing attention, but multiple images can simply become a distraction.  If you include video, make it one video (not multiple) that drives the viewer back to your company.
  5. Test and Proofread – As I have mentioned in previous articles, proofreading is essential. When it comes to email, testing is critical.  Send a test email and view it from a computer and mobile devices.  Make sure that the alignment is correct and format is maintained in both the desktop and mobile versions.  You will also need to test every link – I repeat, EVERY link. This includes additional information links within the body of the email (text), social media widgets, share buttons, forwarding, phone number and company address.  Don’t trust that the ESP will point physical address links to the correct map or that the share buttons are generating the perfect tweet or message on FaceBook.  Test each one as if you were the reader, and make sure that you can easily find your way back to the original email and website.

With a little extra effort and tracking, your email marketing campaign will attract and nurture leads rather than repel them.  Take the time to improve your subject titles and utilize metrics to strengthen future emails.  In time, you will be able to convert your readers to customers, expand your contact list and have your email reach the inbox with a warm welcome.

HBW serves contractors and construction/design professionals in Alabama, Georgia, Texas, Florida, and Oklahoma. HBW offers the most current building trend and permitting activity reports, along with White Papers to assist in your marketing efforts. Contact us for a complimentary building data report or white paper today.

HBW Report: Third Quarter Highs in Atlanta and Florida

There are some highs in the Southeast, and we’re not talking about the weather.

The HBW database is flooded with rich information on new residential construction in Florida and the Metro Atlanta areas.  In comparison to 2014, new residential permits have increased immensely this year through the 3rd Quarter.  Whether you are currently an HBW subscriber or looking to get started, you will want to take a glance at permit activity on file and the “highs” in growth and total numbers for new residential construction.

Atlanta

The Atlanta area has seen some major growth in 2015.  In comparison to 2014, five counties are experiencing more than a 50% increase in new residential construction activity.  Bartow is leading in growth with an increase of 109%!   Newton County is hanging in second with an increase of 75%, followed by Walton County which is ahead of 2014 by 65%.  Here is look at the top five counties for growth (%) and a side-by-side look at new residential construction in each area for 2014 and 2015:

Metro Atlanta – 2015 Top 5 Counties for growth through Q3

When taking a look at the total number of new residential construction starts in the area, other counties make their way to the top of our list.  Gwinnett County is leading with 2,432 permits on file through the third quarter, which is a 6% increase from the same time last year.  Forsyth County holds a close second with 2,218 new residential permits in the HBW database (+10%), and Fulton County comes close with a 22% increase in activity and 2,026 permits on file; Fulton County also carries the lion’s share (317) of new homes valued over $500K.

METRO Atlanta - 2015Top 5 Counties for Total # of New Residential Construction Permits thru Q3

Metro Atlanta – 2015 Top 5 Counties for Total # of New Residential Construction Permits thru Q3

When looking at Florida through Q3, it is less of a question about where the new residential construction is booming and more about where to begin…

Florida

Let’s start with a regional view of Florida, from Northeast to Southeast and everything in between.  Overall, all areas are showing an increase in residential construction activity, with Southwest Florida leading in growth with a 22% increase and Central Florida leading in total new starts with 9,121 permits on file for 2015 (Q3).

Florida: Total New Residential Construction by Region YTD 2014 & 2015 thru Q3

Florida – Total New Residential Construction by Region 2014 vs. 2015 (YTD-thru Q3)

Throughout the state and by county, there are some standouts… Although shy on the total number of starts, Jackson County (Northwest) is ahead of 2014 by 227%. Also slim in totals but high in growth, Gadsden County (Northwest) takes second (+93%) and Putnam County (Northeast) follows closely with a growth of 86% in comparison to 2014.

With once less active areas making strides, it is no wonder that counties in Florida that are typically hot spots for construction are seeing increases of their own. Orange County (Central Florida) is leading in total starts with 3,923 permits since the start of the year (thru Q3), a 15% increase from 2014.  It should come as no surprise that Orange County also takes the lead in new construction of homes valued over $500k (425 starts), and at the current quarterly average should exceed the annual total from 2014. Hillsborough County is second statewide and leading West Florida with 2,792 new residential construction starts, reflecting a 13% increase in comparison to the same time last year.  Hillsborough is also on the top of list (3rd place behind Collier) when it comes to homes valued over $500k, with 359 starts and already exceeding annual totals from 2014 (345). Not far behind, Lee County takes the third spot in activity through the 3rd Quarter and leads Southwest Florida with 2,362 new permits on record, an increase of 29% in comparison to 2014.

Florida: Top 10 Counties – New Residential Construction 2014 & 2015 thru Q3

Florida –  Top 10 Counties for New Residential Construction (thru Q3)

Looking for new leads in Florida and Metro Atlanta is easy with the growing number of permits available in the HBW database.  Whether you focus on a particular county or provide services throughout the state, you can find every detail and data available about the many new residential construction permits that are constantly added to the database.  Remember to keep your leads fresh; contact HBW for your complimentary and custom report today.

Understanding the Millennial Client

Just a few years ago, it was a matter of preparing for the next generation of clientele.  Today, millennials are active in the housing market and have needs and interests that are characteristic of their generation.

IMG_0314

You may not have millennial clients now, but you will in the future… the near future. They are the now and the next generation, and although popularly referred to as “renters”, according to the latest report from Realtor.com, 65% of millennials (ages 21 to 34) spent time on real estate websites and apps in August.  The same report noted that currently they are actively pursuing home ownership more than any other generation. There are approximately 82 million millennials (U.S. Census Bureau), and they are growing as the central customer base for U.S. home builders.

Millennials are a vital prospect for home builders; they are a diverse group, and there isn’t a “one size fits all” approach.  Rather, the key in meeting the needs of millennial clients is to understand options that may be of interest to them and how they prefer to work and communicate.  Remember, this generation was raised on the internet, is technologically savvy and expects real-time results and expeditious turnaround in communication.

Here are five areas to consider when working with millennial clients:

  1.  Be Active in Social Media – Based on research performed by Market Strategies International (a market research company), Millennials trust social media more than any other generation. They are not just on Facebook either… The report revealed that various social media platforms serve a specific role in how their generation goes about researching products and services. YouTube, Twitter, Instagram, and Pinterest are very solid platforms that gain a lot of activity and help to round out the client’s perspective on your work and business.  So how does this impact your approach to millennial clients?  It’s simple: Try to maintain healthy, active and updated social media profiles.  This will not only help build relationships with your prospects, but it will also help in SEO (Search Engine Optimization).  If you are on Instagram or Pinterest, be consistent with posting high-quality images of recent work; think of it as an online portfolio, keeping it diverse and reflecting the best of the best.  If you have video capability, consider YouTube and educational videos informing the customer of features he/she should look for in a new product or home; try before/after videos for your latest remodel. Keep the content fresh and respond to public feedback professionally and promptly.
  2. Be Eco-Friendly – This is not to say that every millennial is looking for a green home or eco-friendly technology.  Millennials have grown up in a society that has stressed the importance of limiting one’s carbon footprint, and it benefits your business (and the environment) to offer eco-friendly options.  According to a poll commissioned by the Clinton Global Initiative and Microsoft (MSNBC – 2014), “more than two-thirds of millennials said that they are willing to pay more for products from sustainability-focused companies”.  Consider making your business a little greener, by offering paperless billing, cloud-based documents and files and adding your green efforts (LED lighting, solar energy, recycling program) to your marketing and message.  As for your products and services, let’s move to #3.
  3. Offer Green Products and Services – Offer materials and services that emphasize earth-friendly and energy savings. As mentioned previously, Millennials are an environmentally conscious generation, and they want the latest in design with room to grow.  Repurposed wood and recycled materials (that don’t look recycled) can be of interest in design.  When it comes to function, consider solar energy, energy efficient appliances and lighting, smart home features, natural light spaces and automatic/sensor-controlled functions for water, lights and climate control.
  4. Be Flexible and Authentic – This generation is young and mobile; they appreciate living arrangements that can adapt to their changing lifestyles and grow as they (and their families) grow. Think about incorporating multi-purpose and flexible spaces, adaptable floor plans, and options that can accommodate fluctuations in household composition. Home design should offer home/work space for telecommuters and flexible floor plans that can be adjusted to meet the needs of new family members (young or old). Avoid cookie cutter design, and offer customization when possible. Earlier this month, Realtor.com released an article emphasizing millennials’ preference for authenticity in design.  Think brick walls, refinished hardwood floors, no carpet and original molding. Older features that have been refinished and retro designs that serve current needs can also be attractive and win over a younger client who is looking for something unique and genuine.
  5. Open Communication – This is a generation of easy and quick access to information. Have information readily available and one-click away.  Have your informational pieces and custom quotes online and accessible through a private link.  Respond to emails in a timely manner and if possible, offer online chat for customer service.  Don’t assume or guess their requirements or interests.  As mentioned previously, millennials are a diverse group, and allowing stereotypes to drive your approach will hinder progress.  Ask questions and really get to know your client in order to properly meet their needs.  Find out their preferred method for communication and use it.

Catering to the needs of millennials is not dissimilar to catering to other generations in that you will want to get to know them and be open and honest in your communication.  The younger generation of home buyers is unique in that they are accustomed to having options, flexibility and quick access to information.  By staying up-to-date on technology and offering the latest in flexible and sustainable designs and spaces, your business does not only become more attractive and competitive for Millennials… It will be stronger for the changing times and all clients, from any generation.

HBW serves contractors and construction/design professionals in Alabama, Georgia, Texas, Florida, and Oklahoma. HBW offers the most current building trend and permitting activity reports, along with White Papers to assist in your marketing efforts. Contact us for a complimentary building data report or white paper today.

Texas New Residential Construction – 3rd Quarter Report

The latest HBW Building Activity Trend stats are in, and new residential construction is growing in parts of Texas.

Texas Q3

With the third quarter closing last month, we took a peek at the latest HBW permit activity for new residential construction.  In comparison to 2014, some areas of Texas continue to grow, while others are steady and on course with the previous year.

For those of you who already subscribe to HBW, you know how much detailed and custom information you can pull from every report.  For our purposes, we reviewed new residential activity by the four major areas (Dallas, Houston, San Antonio and Austin) and then by top counties for growth and total starts. Another valuable figure we reviewed is new construction for homes over $500,000.

Now that you have a basic map for how we customized our building activity trend report, here’s a summary of the new permitting activity on file through the 3rd quarter of 2015:

Unlike the pattern we saw in Q2 of this year where Austin was experiencing an 8% increase in new residential construction, there was a minuscule drop in activity in the Austin area (-2%) by the end of the 3rd quarter.  Based on the quarterly average, Austin is charted to come out equal or just above totals from 2014.  The drop is marginal and reflects the fluctuations of each quarter. Houston held steady and continued to reflect a 4% decrease in activity in comparison to 2014; that being stated, as you will notice in the “Top 5 Counties for Growth” chart at the tail end of this report, the county of Brazoria continues to dominate in growth with a major increase of 53% in comparison to activity through the 3rd quarter of last year.  Both Houston and Austin are expected to hold steady and strong and are growing areas in Texas.  Based on Forbes magazine’s 2015 list of fastest growing cities, Houston is #1 and Austin is #2 in the nation for growth; additionally, the total number of new residential construction starts in Houston takes the lead in Texas with 25,032 new permits added to the HBW database through Q3.

Texas New Residential Construction - Q3-YTD Comparison 2014 vs. 2015

Texas New Residential Construction. Q3-YTD Comparison 2014 vs. 2015

Two areas that continue to be on the rise are Dallas and San Antonio. For those of you who have your eye on the news, Dallas has been shining as a market that is in demand.  Earlier this year, The Dallas Morning News described Dallas as an area that has homebuyers in a pinch as the demand for housing outweighs supply.  According to Forbes, Dallas is ranked #3 as one of the fastest growing U.S. cities.  The Dallas buzz is also evident in permit activity, as there was a 15% increase in new residential construction activity in comparison to 2014.  San Antonio jumped from a 5% increase in Q2 to a 9% increase in Q3.

Texas New Residential Construction >$500k by Quarter 2015

Texas New Residential Construction >$500k – 2015

Another point of interest is the number of starts for homes valued above $500,000.  At the current pace (based on monthly averages), Dallas, Houston, San Antonio and Austin are all expected to be on track for a slight increase in activity in comparison to last year.  Dallas currently leads with 1,374 new permits in 2015, and Houston is solid each quarter with 841 new residential construction starts greater than $500,000 through September 2015.

Texas New Residential Top 5 Counties for Growth

Texas New Residential Top 5 Counties for Growth

When viewing Texas by top counties for growth, previously mentioned Brazoria (Houston area) is leading in growth with a 53% increase through the 3rd quarter (compared to 2014).  The county of Comal (San Antonio) is also worth mentioning as it reflects an impressive level of growth (37.2%) from the previous year.  The chart above highlights the five top counties for growth, mapping areas on the rise.  At the same time, it is worth taking a look at five counties that hold the highest number of new residential permits in the HBW database:

TX new resid. Q3 Top 5 Counties for total permits

Texas New Residential Permits – Top 5 Counties

The Houston area is holding steady and leading the state in total number of new residential permits (25,032 permits thru Q3); the bulk of new residential construction activity can be found in Houston’s Harris County, with 12,352 new permits available in the HBW database.  The second and third spots are held by Fort Bend (Houston) with 5,635 starts and Collin (Dallas) with 5,175 starts.

Overall, Texas is looking good and flourishing in new residential construction.  To gain more detailed information on the permit activity reviewed in this report or to access your own complimentary custom report, contact HBW for the latest permitting activity in Texas, Florida, Alabama, Georgia and Oklahoma.