
Construction spending during September 2015 rose 0.6% to a seasonally adjusted annual rate of $1.09 trillion.
Earlier this week, the U.S. Department of Commerce reported that construction spending increased to a seasonally adjusted annual rate of $1.09 trillion, which is a 0.6% increase since August. Normally, I would not report on small percentages, but this figure stood out as it brought construction spending estimates to the highest level since March 2008. Additionally, the figures for September 2015 are significantly higher than total construction estimates in September 2014, 14.1% higher to be more specific.
Of course, you can easily perform your own research on construction industry statistics by following reports and releases from the Department of Commerce, but to make it easy for you, we have compiled a snapshot of construction spending estimates as reported through September 2015. In order to gain a better sense of the highs and lows in our industry and identify types of construction that are driving the national rates, here is the breakdown based on the U.S. Census Bureau’s News Release (11/02/15) and September “Value of Construction Put in Place” report.
Through the third quarter (Jan-Sept) of 2015, construction spending totals were 10.5% higher than the same period in 2014. When looking at public and private construction, there are some significant gains in certain residential construction from August 2015 to September 2015 (multi-family +4.9%, single-family +1.3%), while private nonresidential construction slipped down (-0.7%) below the revised August estimate to a seasonally adjusted annual rate of $399.5 billion. Overall, private and public construction experienced small increases from August, with September estimates bringing public construction up 0.7% from August to $300.0 billion, and private construction up 0.6% for a seasonally adjusted annual rate of $794.2 billion.
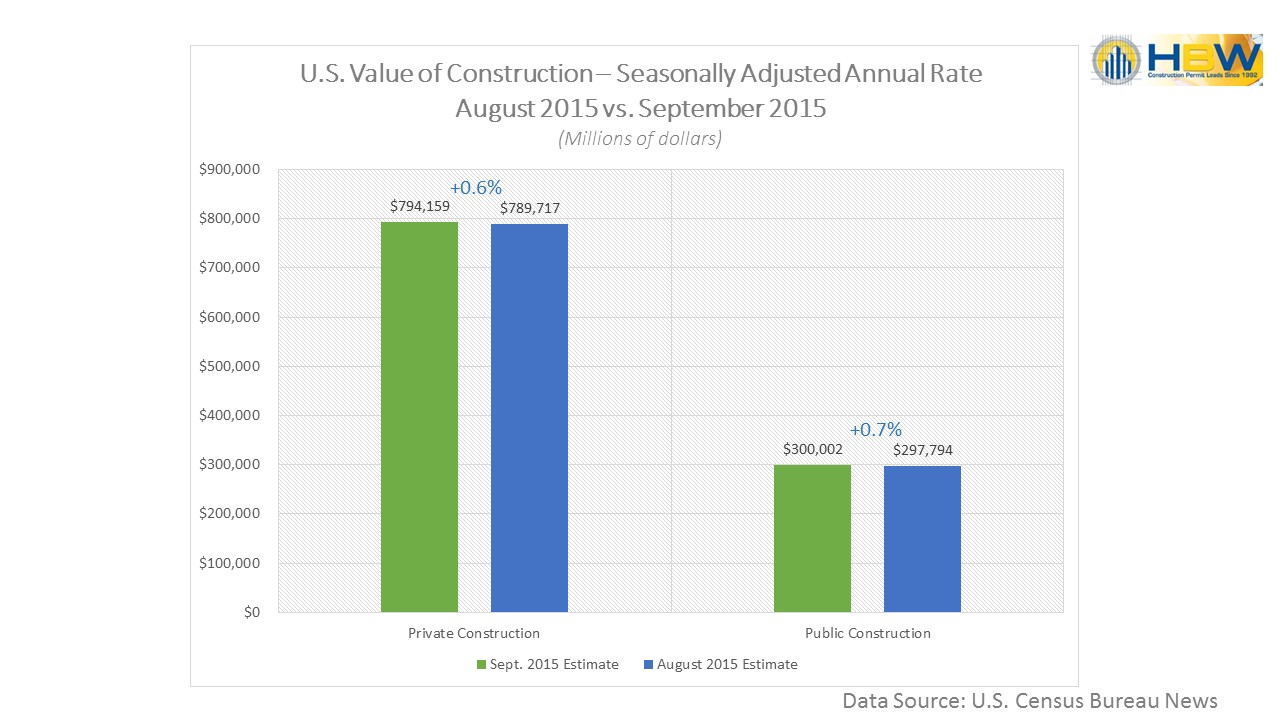
U.S. Construction Spending – Seasonally Adjusted Annual Rate Aug 2015 vs. Sept 2015
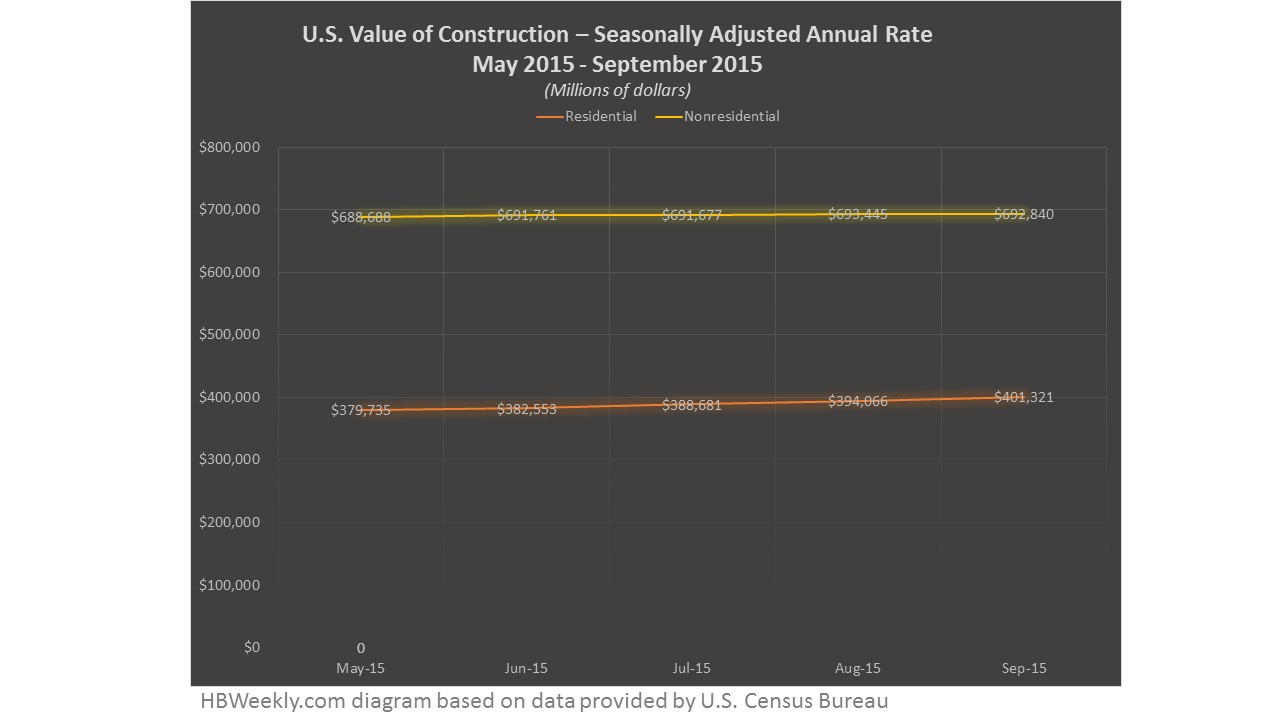
So what’s driving the increase? In the private sector, residential construction increased 1.9% since August and 17.1% in comparison to September 2014. Although nonresidential construction in the private sector dropped -0.7% from August to September to a seasonally adjusted annual rate of $399.5 billion, construction of churches and other religious buildings rose 5.6%.
In the public sector, residential construction increased 1.2% from August and up 22.7% in comparison to September 2014. Educational construction increased 2.4% from August to a seasonally adjusted annual rate of $69.1 billion, while the biggest increase for the month was in public water supply construction (+4.8%).
Although there are slight increases from the months of August 2015 to September 2015, when comparing September 2014 figures and September 2015, total construction spending estimates are up 14.1%. The standout areas of growth between 2014 and 2015 are as follows: Residential construction (+17.2%); lodging construction (+32.8%); amusement and recreation construction (+30.6%); office building construction (+19.3%).
To learn more about U.S. construction spending, reports and the data listed above, visit www.census.gov. To gain access to construction permitting data and receive custom and detailed reports on the latest building activity in Florida, Texas, Georgia, Oklahoma and Alabama, contact HBW to request a complimentary construction report.