Florida Top Three Regions for New Home Construction – March 2019

An HBW Report on new residential construction permits in Florida for the month of March 2019

Based on the latest HBW reports on new home construction, approximately 5,000 new residential construction permits were added to the HBW database last month for the State of Florida.  Out of the five major regions reviewed (Tampa, Jacksonville, Orlando, Southeast, Southwest), Tampa ranked #1 for total new permits on file (1,324 permits), and the Orlando and the southwestern region weren’t far behind.  Here is a look at the top three Florida regions holding the highest concentration of new residential construction last month:

Tampa

As previously mentioned, Tampa ranked #1 for new home construction in Florida last month as there were approximately 1,324 housing starts with a total construction value in excess of $382.5 million.  The average value of new construction was $288,926, and more than half of all new permits originated from Hillsborough County (412 permits) and Pasco County (366 permits).

Out of the 185 active builders on file for the month, the following ranked as the top five for total new permits:

Builder Total Permits
Lennar Homes 239
D.R. Horton 100
The Villages of Lake Sumter 95
Pulte Homes 79
M/I Homes 59


Southwest Florida

Southwest Florida ranked a close second for new residential construction.  Last month, there were approximately 1,135 new permits with a total construction value of nearly $289.5 million added to the HBW database.  The average construction value was on the lower end of the spectrum (average value: $255,135), and the county that held the highest concentration of new permits for the month was Lee County (346 permits).

Out of the 225 active builders in the area last month, the following ranked as the top five for total new residential construction permits on file with HBW:

Builder Total Permits
Lennar Homes 210
Pulte Homes 137
D.R. Horton 80
Neal Communities of SW FL 59
Maronda Homes 30


Orlando

The average value of construction in Orlando appears to be on the rise, along with housing starts.  Last month, there were nearly 1,035 housing starts with a total construction value of approximately $318 million.  The average value of new residential construction was nearly $308k, and the greatest concentration of new construction activity could be found in Orange County (396 permits).

Out of the 155 active home builders on file last month, the following ranked as the top five for total new permits added to the HBW database:

Builder Total Permits
Lennar Homes 224
D.R. Horton 138
Minto Builders 56
Meritage Homes 39
M/I Homes 39


To gain more information on the builders, homeowners and permits for the construction activity above, check out HBW for your copy of the latest construction data reports. To gain access to the HBW database and receive custom and detailed reports on the latest residential and commercial building activity in Florida, Georgia, Texas, Alabama, and Oklahoma, please contact HBW for details.

HBW Quarterly Report: Texas Swimming Pools Q1-2019

An HBW review of new swimming pool construction permit data on file for the first quarter of 2019

Earlier this week, we published a monthly (March 2019) review of swimming pool construction and leading builders in the four major metro areas of Texas (Dallas, Houston, Austin, San Antonio).  While last month reflected a marginal month-over-month dip in new pool construction, figures from the first quarter of this year show some significant improvement in comparison to Q1-2018.

From January through March of this year, Texas has experienced a 16 percent year-over-year increase in pool starts, resulting in more than 1,800 new construction permits on file with HBW.  All major metro areas, with the exception of San Antonio, are ahead of last year’s quarterly construction figures with spikes ranging from as moderate as 10 percent (Dallas) to as high as 31 percent (Houston).  More than half of all new construction permits on file for the three-month period originated from Dallas (955 permits), and the metro area with the highest rate of growth in new pool construction so far this year is Houston (31 percent).

Here is a brief overview of the latest construction permit data on file for Dallas, Houston, Austin and San Antonio during the first quarter of this year:

Dallas

As previously mentioned, the majority of all new pool construction in the four areas reviewed took place in Dallas last month.  With 955 new swimming pool permits, the area was 10 percent ahead of construction activity from last year.  Dallas-area counties that held the greatest volume of pool starts included: Dallas (225 permits, +13 percent), Collin County (224 permits, +17 percent); Tarrant County (223 permits, -17 percent).

Houston

The Houston area ranked second-highest for total swimming pool starts in Q1-2019.  With approximately 475 new permits on file with HBW, the area has already experienced a 31 percent year-over-year increase in new pool construction.  More than half of all new construction took place in Harris County (287 permits) where there has been a 20 percent year-over-year spike in new permits so far this year.

Austin

While the Austin area is not a leader for volume of new pool construction at this point (235 permits), it is certainly an area to watch for growth.  Since 2016, Austin has demonstrated annual and incremental growth in pool starts, and in the first quarter of this year the growth pattern has continued with a 28 percent year-over-year increase.  Nearly all new pool construction in the area originated from Travis County where there were 184 new permits on file for the three-month period, reflecting a 37% year-over-year increase in new pool construction.

San Antonio

San Antonio was the only major metro area in Texas during the first quarter of this year to remain somewhat steady with last year’s figures.  With a one percent year-over-year dip in new pool construction, there were just over 140 new swimming pool construction permits in the area (Q1-2019), and nearly all new construction took place in Bexar County (120 permits, +9 percent).

To gain more information on the builders, homeowners and permits for the construction activity above, check out HBW for your copy of the latest construction data reports. To gain access to the HBW database and receive custom and detailed reports on the latest residential and commercial building activity in Florida, Georgia, Texas, Alabama, and Oklahoma, please contact HBW for details.
Texas Swimming Pool Construction Review – March 2019

A report on the latest new swimming pool permits added to the HBW database for Texas during the month of March 2019

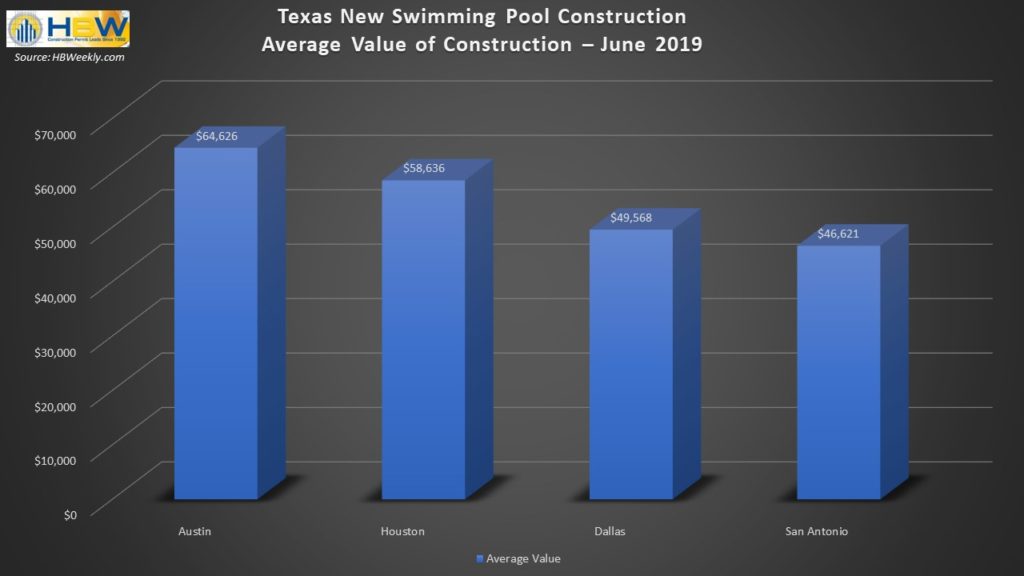
Last month, there were more than 620 swimming pool starts with a total construction value of nearly $40 million in Texas.  Out of the four major metro areas reviewed (Dallas, Houston, Austin, San Antonio), Dallas had the highest concentration of new permits and held nearly half of all new construction activity on file with HBW (304 permits) for the one-month period.  The average value of new pool construction varied throughout the metro areas and ranged from a low of $43,391 (San Antonio) to a high of $65,370 (Houston).  Here is a closer look at the new swimming pool construction permits that were added to the HBW database for Texas last month:

Dallas

The Dallas metro area ranked #1 last month for total pool starts.  With 304 new swimming pool permits and a total construction value in excess of $15.3 million, the average value of new pool construction in the area was approximately $50,500.  The counties with the greatest volume of new permits were Tarrant County (74 permits) and Dallas County (69 permits).

Out of the nearly 115 active pool builders on file for the one-month period, the following ranked as the top three for total new permits:

1. Riverbend Pools
2. Gold Medal Pools
3. Hauk Custom Pools


Houston

In Houston, there were 170 swimming pool starts with a total construction value of more than $11 million last month.  More than half of all new construction originated from Harris County (102 permits), and with an average construction value of $65,370, the Houston area held the highest average value of new pool construction out of the four metro areas reviewed.

Out of nearly 95 active builders in the Houston area last month, the following ranked as the top three for total new permits on file:

1. Platinum Pools
2. Anthony & Sylvan Pools
3. The Pool Man Inc


Austin

Last month, there were 95 new swimming pool permits with a total construction value in excess of $5.2 million on file for Austin.  The average value of new pool construction was approximately $55k, and the majority of all new construction took place in Travis County (62 permits).

Out of the 45 active pool builders in the area for the month, the following ranked as the top three for total new pool permits:

1. Cody Pools
2. Anthony & Sylvan Pools
3. Texas Pools & Patios


San Antonio

In San Antonio, there were approximately 55 new swimming pool permits with a total value of nearly $2.3 million added to the HBW database last month.  The average value of new construction was on the lower end of the spectrum (average value: $43.4k), and nearly all new permits originated from Bexar County (42 permits).

Out of the more than twenty active builders in San Antonio and surrounding areas last month, the following ranked as the top three for total new pool permits on file with HBW:

1. Keith Zars Pools
2. Cody Pools
3. Backyard Vacation Oasis


To gain more information on the builders, homeowners and permits for the construction activity above, check out HBW for your copy of the latest construction data reports. To gain access to the HBW database and receive custom and detailed reports on the latest residential and commercial building activity in Florida, Georgia, Texas, Alabama, and Oklahoma, please contact HBW for details.
Texas Quarterly Review – Residential Construction Q1-2019

An HBW review of new residential construction permits in Texas during the first quarter of 2019

In the first quarter of this year, new residential construction permits in Texas were down by 8% in comparison to the same time last year.  Upon reviewing the four major metro areas in the Lone Star State (Dallas, Houston, Austin, San Antonio), it was evident that all areas have experienced a bit of a slower start in new home construction.  From January through March of this year, there have been 16,572 housing starts added to the HBW database for Texas.  Out of the metro areas reviewed, Houston held the highest concentration of housing starts (greater than 7,000), while the Austin area appeared to be the most stable market, having the least amount of year-over-year change (-1 percent) in new residential construction permits.

Here is a closer look (by region) at new home construction permit data added to the HBW database for Texas during Q1-2019:

Houston

The Houston area hasn’t experienced major changes in new residential construction in comparison to the first quarter of last year, and nearly half of all new permits in Texas originated from the area.  Since the start of the year, Houston reflects a 3 percent year-over-year decrease (Q1-2018 vs. Q1-2019) in housing starts, resulting in more than 7,000 new permits on file with HBW for Q1-2019.  Higher value construction also appears to only be slightly behind last year; with approximately 240 higher value (greater than $500k) housing starts on file in Q1, the difference in higher value construction permits is minor at this point in the year.

While the Houston area reflects a lag in housing starts overall, there are a couple of counties that are ahead of last year’s figures… In Montgomery County, housing starts are up by 11%, resulting in approximately 1,525 new permits on file with HBW, and Galveston County has nearly doubled its total housing starts in comparison to Q1-2018.

Dallas

Although Dallas ranks second for total housing starts (~5,350 permits) on file with HBW for Q1-2019, the area has experienced the greatest year-over-year decrease (-16%) in housing starts in comparison to other areas reviewed. Since 2015, Dallas has exhibited a marked year-over-year growth pattern in new residential construction permits, and while the slow start in new home construction appears to be significant, it is still too early in the year to know if the dip in permits is indicative of any real changes in the market.  According to various reports, larger builders have pulled back on their starts due to a number of factors including housing affordability and the surge in mortgage rates during the fourth quarter of 2018.  The total number of unsold homes has increased in recent months, and many builders will be focusing on moving unsold inventory in the coming months.

Austin

The Austin area appears to be the most stable of the metro areas reviewed so far this year.  From January through March, there have been nearly 2,600 housing starts in the area, reflecting a mere 1% year-over-year decrease in new permits on file with HBW, and the higher value (construction value greater than $500k) market also appears to be steady and nearly on target with last year.  Over the last several years, the Austin residential construction market has fluctuated with annual decreases as low as 3% and increases as high as 21%, but with reports of increased economic expansion and job growth, this year the area has potential for growth.  Major tech companies have been fueling job growth in Austin; Apple recently announce its plans to build a campus in the area that will eventually employ 15,000 people, and housing prices in Austin continue to be below other leading tech hubs (Seattle, San Francisco, Denver), making it a desirable location for new and expanding tech businesses.

San Antonio

Since 2015, the San Antonio area has reflected annual growth patterns in new home construction, but in the first quarter of this year, housing starts are down by 7% in comparison to 2018, resulting in approximately 1,630 new residential construction permits added to the HBW database.  New home construction has dropped in all counties with the exception of Bexar County where there has been an 11% increase in housing starts, resulting in 975 new residential construction permits in the first quarter of this year.

To gain more information on the builders, homeowners and permits for the construction activity above, check out HBW for your copy of the latest construction data reports. To gain access to the HBW database and receive custom and detailed reports on the latest residential and commercial building activity in Florida, Georgia, Texas, Alabama, and Oklahoma, please contact HBW for details.
Texas Home Building Report – March 2019

An HBW review of permit data for new residential construction in Texas during the month of March 2019

In Texas, there were 5,820 new residential construction permits added to the HBW database last month, reflecting close to a 15 percent month-over-month increase in housing starts.  Out of the four major metro areas reviewed (Houston, Dallas, Austin and San Antonio), Houston carried the highest amount of new residential construction (2,375 permits), and Dallas remained the area with the highest average value of new home construction (average value: $310,563).  Out of the hundreds of active builders throughout the state, Lennar Homes and D.R. Horton continued to be the leaders for total housing starts on file with HBW.

Here is a closer look at the total permits and leading builders throughout Texas metro areas last month:

Houston

Last month, there were more than 2,375 housing starts with a total construction value of nearly $465 million in Houston and surrounding areas.  The average value of construction was on the lower end of the spectrum (average value: $195,603), and nearly half of all new permits originated from Harris County (1,081 permits).

Out of the 287 active home builders in the Houston area last month, the following ranked as the top five for total new permits on file with HBW:

Builder Total Permits
Lennar Homes 233
K Hovnanian Homes 190
D.R. Horton 181
Perry Homes 137
Pulte Homes 106


Dallas

Last month, Dallas ranked second-highest for housing starts having nearly 2,030 new residential construction permits with a total value of approximately $630 million.  The area continued to hold the highest average value of construction (average value: $310,563), and the greatest concentration of new permits could be found in Tarrant County (~600 permits).

Out of the more than 205 active home builders in the area last month, the following ranked as the top five for total new permits on file with HBW:

Builder Total Permits
D.R. Horton 380
Lennar Homes 195
First Texas Homes 113
Pulte Homes 95
Highland Homes 79


Austin

In Austin, there were more than 900 new residential construction permits with a total value in excess of $232 million added to the HBW database last month.  The average value of construction was $257,494, and more than half of all housing starts took place in Travis County (586 permits).

Out of the more than 115 active home builders on file for the month, the following ranked as the top five for total new permits in the area last month:

Builder Total Permits
D.R. Horton 136
Milestone Community Builders 71
Pulte Homes 59
Taylor Morrison Homes 54
Gehan Homes 54


San Antonio

In San Antonio, there were approximately 515 housing starts with a total construction value of $102.5 million last month.  The average value of new home construction was $199,912, and the majority of all new permits originated from Bexar County (334 permits).

Out of the approximately 80 active home builders in the area last month, the following ranked as the top five for total new permits on file with HBW:

Builder Total Permits
Lennar Homes 113
Continental Homes of Texas 92
Bella Vista CMI 47
Meritage Homes 31
KB Homes 27

To gain more information on the builders, homeowners and permits for the construction activity above, check out HBW for your copy of the latest construction data reports. To gain access to the HBW database and receive custom and detailed reports on the latest residential and commercial building activity in Florida, Georgia, Texas, Alabama, and Oklahoma, please contact HBW for details.

Atlanta Residential Construction Overview Q1-2019

An HBW review of new residential construction permits in the Atlanta area during Q1-2019

In the first quarter of this year, there have already been approximately 5,300 new residential construction permits added to the HBW database for the Metro Atlanta area.  While this reflects a 3% year-over-year decrease in comparison to the same time last year, there are counties like Fulton that are already way ahead of 2018 figures.

Since the start of this year, Fulton County has experienced the greatest number of housing starts (716 permits) in comparison to other counties in the area, reflecting a 20% year-over-year increase in new home construction.  This comes as no surprise considering that the actual city of Atlanta is located in Fulton County, and Atlanta just landed the #4 spot on Realtor.com’s list of the top ten cities that are expected to dominate home construction this year.  According to HBW’s files, new residential construction has been on the rise in Fulton County since 2016, and it appears that this year may maintain that trend.  Additionally, Fulton County dominates when it comes to higher value homes (construction value greater than $500k), as nearly half of all high value construction originates from the area.

Other Metro Atlanta counties that have started off ahead of 2018 in the first quarter of this year include Cherokee and Dekalb.  Since the start of this year, there have been nearly 510 housing starts in Cherokee County which is 10% more than the same time last year.  Dekalb County has also experienced a 10% year-over-year increase in new residential construction; in the first quarter of this year there have been nearly 300 housing starts in Dekalb, and although it is still too early to tell, the increase may be indicative of the area coming out of the slump it had in residential construction last year.  Additionally, the Dekalb suburb of Scottdale was listed as one of the fastest growing communities in Atlanta by Realtor.com, and while homes are significantly less than the median in the city, home prices in the area rose 178% in the last five years.

Other Metro Atlanta and surrounding counties that held a higher volume of new residential construction in the first quarter of this year include: Gwinnett County (674 permits); Forsyth County (466 permits); and Henry County (363 permits).

Information utilized for the above listed figures for Metro Atlanta residential construction was directly derived from HBW construction data reports. To gain access to the HBW database and receive custom and detailed reports on the latest residential and commercial building activity in Florida, Georgia, Texas, Alabama, and Oklahoma, please contact HBW for details.
Metro Atlanta Swimming Pool Construction – Quarterly Summary

An HBW review of new swimming pool construction permits in the Atlanta area for Q1-2019

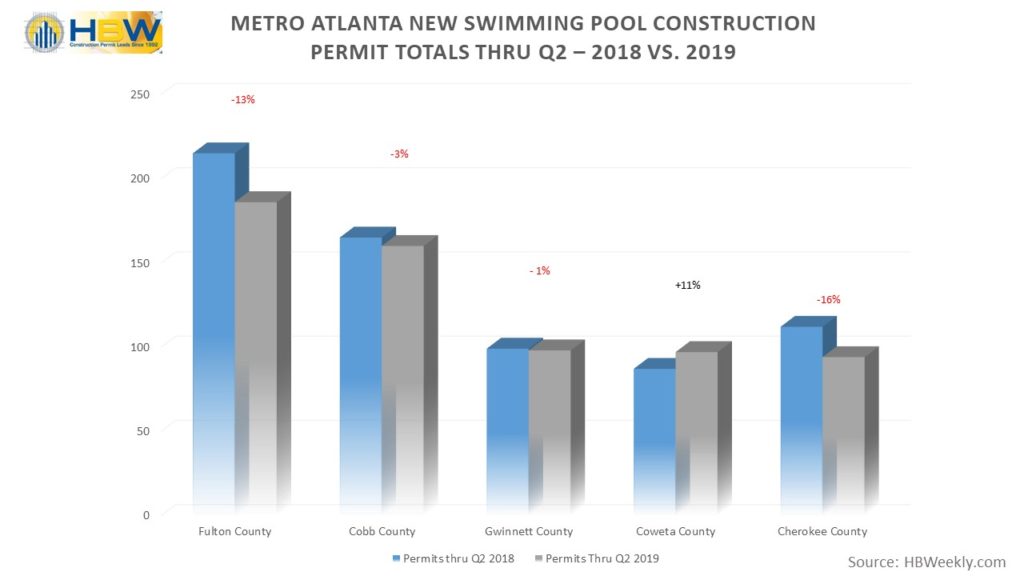
New swimming pool construction in the Metro Atlanta area is off to a solid start in the first quarter of this year.  From January through March 2019, there have been 432 new swimming pool permits added to the HBW database, reflecting a 3% increase in new construction activity over the same time last year.

The counties with the highest concentration of new swimming pool construction in the first quarter include:

  • Cobb County (74 permits, 32% year-over-year increase)
  • Fulton County (68 permits, 33% year-over-year decrease)
  • Gwinnett County (38 permits, 12% year-over-year decrease)


While the gaps between highs and lows are fairly significant when comparing quarterly (Q1) figures from 2018 and 2019, it is still early in the year, and the total number of permits is still low enough that the percent difference in permits is not telling of any true patterns at this point.  After all, over the last five years the counties of Gwinnett and Fulton have exhibited year-over-year growth in new swimming pool construction ranging from 5 percent to 28 percent, with every year being greater than the last.  And Cobb County had an incremental growth pattern until last year, when it experienced a 6% year-over-year decline in new swimming pool construction.

With the higher levels of construction activity, the above listed counties will remain as areas to watch, and HBW will continue to add the latest permits to its database and report on growth and construction trends as we move further into the year.  Other counties that have proven to be areas to watch for new swimming pool construction are Henry County and Forsyth County.  Since 2016, Henry County has exhibited growth in new swimming pool construction ranging from annual increases of 6 percent to 19 percent, and so far this year, figures have more than doubled which makes it one to watch over the coming months.  On the other hand, Forsyth County experienced a major drop in new pool construction last year (-22% annual decrease), yet every year prior since 2014, pool construction had been on the rise; so far this year, the area is more than 40 percent ahead of last year’s construction figures, and it appears that it could bouncing back from last year’s loss.

Information utilized for the above listed figures for Metro Atlanta swimming pool construction was directly derived from HBW construction data reports. To gain access to the HBW database and receive custom and detailed reports on the latest residential and commercial building activity in Florida, Georgia, Texas, Alabama, and Oklahoma, please contact HBW for details.

Give Your Digital Marketing a “Spring” in its Step

Quick tips for giving your digital marketing a spring cleaning and upgrade

Spring is here (as of March 20th), and there is no time like the present to give your marketing effort a little “spring” in its step.  Whether you focus on social media or email marketing, here are a few ways to connect to your target audience this season:

  1. Connect to the Season – Springtime conjures up images of flowers, clean air and improved weather for most of us, so using those images and messages are a great way to connect to your audience. For example, tips for spring cleaning can help your customers and prospects get organized and check their properties for areas that are in need of improvement.  Landscapers and landscape architects can also use this time to share information about gardening trends and the flowers and plants that flourish best this time of year.
  2. Get Local – With the opening of spring, many people are interested in enjoying the weather and getting outdoors. Use this time to share local events and outdoor activities that may be of interest to a certain county or neighborhood that you serve.  You may also consider cross-promotion opportunities with outdoor specialists or other related business partners in the area.
  3. Spring into Savings – Do you have a new product or service you would like to promote? Maybe there is a special promotion that you are running that needs a little more attention. By offering “Spring Savings” or “Spring Specials”, you can reengage your audience with a limited time savings opportunity; it may just be the opening they need to try your services or upgrade their existing ones.
  4. Go Green – Earth Day is right around the corner (Monday, April 22, 2019), and many home owners are looking to make a difference by decreasing their carbon footprint. From energy efficient windows and doors to appliance upgrades and earth-friendly building materials, Earth Day is a great time to highlight your commitment to improving the environment.
  5. Spring into Something New – Although you may already have your social media marketing dialed-in, this time of year may be the motivation you need to spring into a new social network. While it appears that new social networks are popping up constantly, make sure you choose one where your target audience has a presence and you can maintain it for the long run.

For more information on construction business and marketing tips, stay connected with the HBW Blog.  To get ahead of construction activity and gain access to the latest permitting data in Florida, Texas, Georgia, Alabama and Oklahoma, contact HBW for more information on construction data reports and industry leads.

Three More Ways to Use Construction Data Reports

Readers who are already subscribers to HBW know the value of Construction Data Reports; the reports provide comprehensive data, covering all permits for new residential and commercial construction, as well as renovations valued greater than $25k.

Having access to the latest and greatest construction permit data offers subscribers construction leads that can be filtered to target construction project type, location, construction value and more.  And while the first and most obvious way to use such reports would be to gain access to the latest leads for your sales team, there is also much more to be acquired from construction data reports.

Here is a list of three more ways to use HBW’s Construction Data Reports to benefit your business:

  • Market Patterns – By using HBW construction data reports to monitor trends and patterns in certain markets, you can identify areas where your services may be in high demand, as well as chart seasonal fluctuations, average construction value, and more.  This type of information is vital for a growing business to know the latest about its geographic target area and where the greatest potential for new projects exists.
  • Competition Statistics – Staying on top and ahead of the competition is valuable for any construction business, and builder summary reports by HBW provide subscribers insight into the competition’s latest construction activity. This type of information is not only important for knowing what the competition is doing and where, but it also allows for you to know what your customers may be seeing and hearing in their service area. From the number of permits a competitor may have for a given period or area to the average value of their projects, builder summaries strengthen your understanding of the competition.
  • Historical Data – HBW offers a wealth of archived permit data on construction projects going back more than twenty years. In addition to being useful for understanding patterns and trends in construction over time, this type of information can be used for gaining access to the history of properties, enabling you to identify homes, commercial properties and pools that may be in need of your services.

While the weekly reports serve as a solid source for new construction leads, they can offer so much more.  And with access to the online database, subscribers can go beyond reports and search specific records.  From filtering by field to searching for a particular permit number, builder or physical address, you can pinpoint the information you need for any given permit or project.

For more information on construction business and marketing tips, stay connected with the HBW Blog.  To get ahead of construction activity and gain access to the latest permitting data in Florida, Texas, Georgia, Alabama and Oklahoma, contact HBW for more information on construction data reports and industry leads.

Top Spots for Swimming Pools

HBW metro areas that ranked as the top ten in a recent swimming pool value report by Redfin

Every week, HBW updates its database with the latest information on new swimming pool construction (and other types of construction) in Florida, Georgia, Alabama, Oklahoma and Texas; and every month, HBW reviews and reports on the permit data to identify where new construction is booming (and shrinking) in the various territories covered.

The figures for new swimming pool construction for the month of March will be coming in the next couple of weeks (check previous blog posts for February), but until then, we turn our focus to the latest report from Redfin which listed the top areas for swimming pool construction based on the value of a pool, ranked by average premium per square foot.  To get to this figure, Redfin calculated the value of private pool construction as a premium to a home’s sale price (per square foot).  The ranking is limited to metro areas that have a minimum of 5,000 homes sold in 2018 and where at least 2% of the homes sold had swimming pools.

The results reflected some of the areas covered by HBW as top places where swimming pools added significant value to a residential property.  While Los Angeles ranked #1 for having homes with pools selling for nearly $100k more than comparable homes without pools, various metro areas in Texas, Florida and Georgia also topped the list.  Here is look at where some of the metro areas covered by HBW ranked within the top ten of Redfin’s report:

Austin, Texas

Just behind Los Angeles, Austin took the #2 spot for swimming pool value.  In Austin, pools were reported to add more than $50k ($52,228.18) to a typical home’s value, and the average pool premium came in at $28.67 per square foot.

Fort Lauderdale, Florida

Another HBW area that made the top of the list for places where pools add a high premium is sunny Fort Lauderdale, Florida.  Located in the southeastern region of the Sunshine State, Fort Lauderdale ranked #5 as swimming pools added nearly $37,000 to the value of a home.  The average pool premium in the area was listed at $19.57 per square foot, and 45.6% of homes sold in 2018 had a swimming pool.

Tampa, Florida

The next metro area in Florida that made the top ten on the report is Tampa.  Coming in at #8, a pool in Tampa reportedly added a value of $29,611.08 to a median-priced home.  The average pool premium was listed as $17.21 per square foot, and in 2018, nearly 30% of homes sold had a pool.

Houston, Texas

The other Texas metro area that made the top ten of the list is Houston.  In Houston, a pool reportedly added $35,736.25 to the value of a median-priced home.  The average pool premium per square foot was $16.42, and out of the homes sold in 2018, nearly 17% had swimming pools.

To learn more about the latest swimming pool permit data in Texas and Florida, keep an eye on the HBW Blog.  To gain information on the builders, homeowners and permits for new residential and commercial construction activity in Florida, Georgia, Texas, Alabama, and Oklahoma, check out HBW for your copy of the latest construction data reports.