Florida Top Home Builders – December 2022

A review of the leading home builders in Florida during the month of December

Based on HBW’s latest construction data reports, there were 6,890 new residential construction permits with a total value in excess of $2.3 billion added to the HBW database for Florida last month.  Out of the hundreds of contractors with new residential construction permits pulled across the state during the one-month period, there were a few that were standouts for carrying a high volume of new permitting activity.

As per usual, D.R. Horton and Lennar Homes continue to lead Florida for new home construction.  Across the five major regions reviewed (Tampa, Southwest, Orlando, Southeast, Jacksonville), D.R. Horton and Lennar Homes landed in the top five for new home construction in every region, having approximately 883 and 1,283 new permits on record for the month respectively; both builders were responsible for more than 31 percent of all new home construction statewide.

With construction and contractors having a local focus within each region, we have utilized HBW reports to identify leading home builders by area, based on the total number of new permits on record for the given period.  Here is a breakdown of the top five contractors, total permits, and average value of construction as derived from the HBW database for the month of December 2022:

Tampa

BuilderTotal Permits Average Value
1-Lennar Homes682 $      329,439.00
2-D.R. Horton215 $      235,345.00
3-Pulte Homes85 $      267,546.00
4-The Villages of Lake Sumter68 $      175,000.00
5-Ryan Homes61 $      258,149.00

Southwest

BuilderTotal Permits Average Value
1-Lennar Homes353 $        177,435.00
2-Pulte Homes133 $        206,879.00
3-D.R. Horton116 $        214,569.00
4-Meritage Homes46 $        230,846.00
5-JHS Builders45 $        309,596.00

Orlando

BuilderTotal Permits Average Value
1-D.R. Horton266 $      306,694.00
2-Lennar Homes111 $      254,134.00
3-Synergy Homes FL69 $      310,083.00
4-Pulte Homes67 $      283,635.00
5-Viera Builders55 $      643,490.00

Jacksonville

BuilderTotal Permits Average Value
1-D.R. Horton225 $      188,302.00
2-Dream Finders Construction95 $      255,816.00
3-Lennar Homes95 $      249,976.00
4-Toll Brothers68 $      296,245.00
5-American Classic Homes57 $        85,000.00

Southeast

BuilderTotal Permits Average Value
1-GL Building Corporation118 $      453,734.00
2-D.R. Horton61 $      269,502.00
3-Synergy Homes47 $      253,040.00
4-Lennar Homes42 $      150,575.00
5-Pulte Homes38 $      374,538.00

To gain more information on the builders, homeowners and permits for the construction activity above, check out HBW for your copy of the latest construction data reports. To gain access to the HBW database and receive custom and detailed reports on the latest residential and commercial building activity in Florida, Georgia, Texas, Alabama, and Oklahoma, please contact HBW for details.

HBW Report: Florida Swimming Pool Construction – December 2022

A summary of permit data for new swimming pool construction in Florida during the month of December

Last month, Florida demonstrated a 40 percent month-over-month increase in new swimming pool construction, resulting in more than 2,600 new permits with a total value of approximately $179.5 million. Out of the five regions reviewed (Southwest, Tampa, Orlando, Southeast, Jacksonville), the greatest amount of new swimming pool construction activity could be found in the Southwest where there 738 new permits on record with HBW for the one-month period. 

When reviewing reports to identify areas with the highest average value of new swimming pool construction, Jacksonville took top placement with an average construction value in excess of $85,950.

Here is a closer look at the total permits, construction values and leading counties for new swimming pool construction activity in Florida during the month of December 2022:

Southwest

As noted above, the highest concentration of new swimming pool construction permits originated from the southwestern region of Florida, where there were 738 new permits with a total construction value in excess of $52 million.  The average value of new pool construction was $70,540, and more than half of all new construction took place in the counties of Lee (232 permits) and Collier (168 permits).

Southeast

The southeastern region of Florida ranked #2 for new swimming pool construction last month, having more than 570 new permits with a total construction value of approximately $38.7 million on record with HBW.  The average value of new pool construction was $67,577, and more than half of all new permits originated from the counties of Palm Beach (183 permits) and Miami-Dade (119 permits).

Orlando

In Orlando, there were 532 new swimming construction pool permits with a total value in excess of $33.8 million added to the HBW database last month.  The average value of new pool construction was lowest in Orlando (average value: $63,580) in comparison to other Florida regions reviewed, and the majority of all new construction activity took place in the two counties of Orange (215 permits) and Osceola (104 permits).

Tampa

In Tampa, there were more than 520 new pool permits with a total construction value of approximately $34.5 million last month.  The average value of construction was $66,204, and the counties with the greatest amount of new pool construction activity on record for the one-month period were Sumter (118 permits) and Hillsborough (113 permits).

Jacksonville

In the Jacksonville area, there were nearly 240 new swimming pool construction permits with a total value of approximately $20.5 million on record last month.  As previously noted, the average value of construction was highest in Jacksonville (average value: $85,951) in comparison to other Florida regions reviewed, and the county with the greatest concentration of new construction activity for the month was St. Johns County (103 permits).

To gain more information on the builders, homeowners and permits for the construction activity above, check out HBW for your copy of the latest construction data reports. To gain access to the HBW database and receive custom and detailed reports on the latest residential and commercial building activity in Florida, Georgia, Texas, Alabama, and Oklahoma, please contact HBW for details.
Texas Swimming Pool Construction Overview – December 2022

A summary of permit data for new swimming pool construction in Texas during the month of December

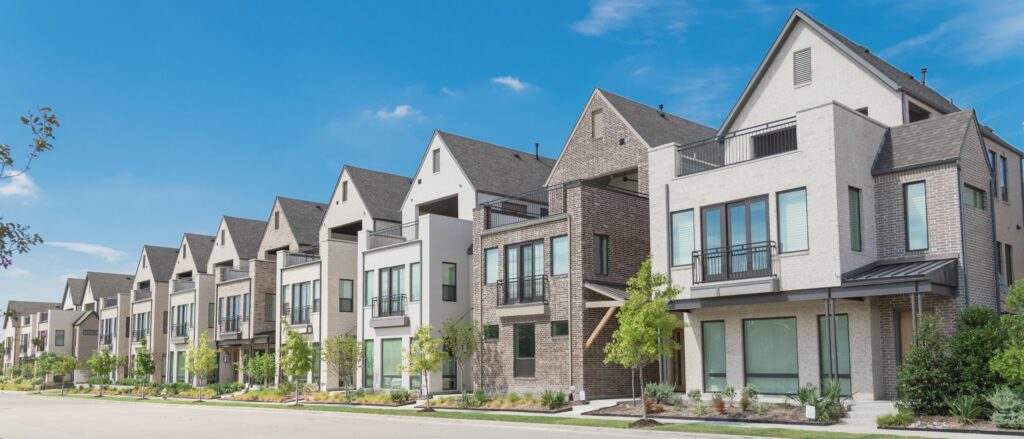
Last month, there were nearly 820 new swimming pool construction permits with a total value of $45.3 million added to the HBW database for Texas; this reflects close to a 33 percent month-over-month increase in new pool construction.

Total Permits

Out of the four major metro areas (Houston, Dallas, San Antonio, Austin) included in the construction data reports, Dallas (336 permits) held the greatest amount of new pool construction, while the fewest new permits originated from the San Antonio area (99 permits):

Average Value

Last month, the average value of new pool construction statewide ranged from a low of $32,855 (San Antonio) to a high of $70,969 (Houston). Here is a closer look at the average value of new pool permits in each of the four regions of Texas:

  • Houston – $70,969.00
  • Austin – $55,176.00
  • Dallas – $50,700.00
  • San Antonio – $32,855.00

Top Counties

There are definitely some hot spots where new pool construction is thriving. From a county-by-county perspective, there were five counties where approximately 64 percent of all new swimming pool construction took place during the month of December, and those counties are as follows:

  1. Harris County (Houston) – 166 permits
  2. Dallas County (Dallas) – 111 permits
  3. Travis County (Austin) – 98 permits
  4. Tarrant County (Dallas) – 74 permits
  5. Bexar County (San Antonio) – 72 permits

Top Pool Builders

When it comes to identifying the leading pool builders that are driving new construction throughout the Lone Star State, the results vary widely based on location. Here are the #1 pool builders in each of the four metro areas of Texas based on the total number of new permits on record with HBW for the one-month period:

Dallas – Riverbend Pools (23 permits)

San Antonio – Keith Zars Pools (21 permits)

Houston – Platinum Pools (20 permits)

Austin – Cody Pools (15 permits)

To gain more information on the builders, homeowners and permits for the construction activity above, check out HBW for your copy of the latest construction data reports. To gain access to the HBW database and receive custom and detailed reports on the latest residential and commercial building activity in Florida, Georgia, Texas, Alabama, and Oklahoma, please contact HBW for details.

Texas Residential Construction Review – December 2022

A review of the latest permit data for new home construction in Texas during the month of December

Based on HBW’s latest construction data reports, there were more than 5,385 new residential construction permits with a total value of approximately $1.5 billion added to the HBW database during the month of December.

Out of the four metro areas included in the report (Dallas, Houston, San Antonio, Austin), the greatest amount of new residential construction took place in Houston (2,417 permits), while the least amount of new home construction could be found in San Antonio (535 permits).

Across the Lone Star State, there were hundreds of home builders with new permits on record last month, but from the four major regions reviewed more than 25 percent of all new construction was driven by the following leading contractors:

  1. Lennar Homes – 780 permits
  2. D.R. Horton – 577 permits

When reviewing permit data from a county-by-county perspective, there were five counties that carried approximately 63 percent of all new home construction last month; those counties were as follows:

  1. Harris County (Houston) – 1,343 permits
  2. Montgomery County (Houston) – 636 permits
  3. Tarrant County (Dallas) – 629 permits
  4. Dallas County (Dallas) – 446 permits
  5. Collin County (Dallas) – 331 permits

In addition to having the ability to identify where high levels of new home construction took place across Texas, HBW’s construction data reports also provide insight on where higher value construction is taking place. From the four major regions reviewed, the average value of new home construction ranged from a low of $253,547 (Houston) to a high of $354,887 (Austin). Here is a look at the average value of new home construction in each of the four Texas metro areas last month:

  1. Austin (average value: $ 354,887)
  2. Dallas (average value: $ 302,924)
  3. San Antonio (average value: $ 270,952)
  4. Houston (average value: $ 253,547)

To gain more information on the builders, homeowners and permits for the construction activity above, check out HBW for your copy of the latest construction data reports. To gain access to the HBW database and receive custom and detailed reports on the latest residential and commercial building activity in Florida, Georgia, Texas, Alabama, and Oklahoma, please contact HBW for details.

Annual Report: Atlanta Swimming Pool Construction 2022

An HBW report on new swimming pool construction permits in the Atlanta area for 2022

For the first time in nearly 10 years, new swimming pool construction has slowed across Metro Atlanta. Since 2013, swimming pool construction had been on the rise in the Atlanta area, until 2022; last year, there was a 9 percent year-over-year decrease in new pool construction activity, resulting in approximately 3,990 new permits added to the HBW database.

Counties that had the highest concentration of new swimming pool construction activity include Fulton and Cobb.  Fulton County exhibited a year-over-year decrease of 7 percent in new pool construction, resulting in nearly 770 new permits, and while new swimming pool construction activity in Cobb County experienced a massive decrease of 28 percent since the previous year, it still ranked second-highest for new swimming pool construction, having 395 permits last year.  Other counties with higher levels of new pool construction include Gwinnett (362 permits, -13% YOY), Forsyth (316, -21% YOY), and Cherokee (306 permits, -23% YOY). 

When looking at the year ahead, we reviewed Metro Atlanta counties to identify the highest levels of growth and potential.  For example, while Paulding County was on the lower end of total permits (162 permits), it has recovered from the major drop it experienced in 2020 to now demonstrating a year-over-year increase of 142 percent in new pool construction.  Another county on a growth track is Henry.  Since 2018, Henry County has been exhibiting annual increases in swimming pool construction ranging from 6 percent to 45 percent; last year, there were nearly 200 new pool permits in Henry County, reflecting a 17 percent year-over-year increase in new pool construction.  Similar growth also took place in Coweta County.  Last year, Coweta exhibited an upswing with a 9 percent year-over-year increase in new pool construction, resulting in 260 new permits for the area.

Information utilized for the above listed figures for Metro Atlanta swimming pool construction was directly derived from HBW construction data reports. To gain access to the HBW database and receive custom and detailed reports on the latest residential and commercial building activity in Florida, Georgia, Texas, Alabama, and Oklahoma, please contact HBW for details.
New Home Construction in Atlanta 2022

An overview of the highs and lows of new home construction permit data in the Atlanta area during 2022

After a strong year in 2021, new home construction took a downward turn in the Metro Atlanta area last year. Through January to December 2022, there were 23,174 new residential construction permits added to the HBW database for the Atlanta area; this reflects a significant 19 percent year-over-year decrease in new home construction.

Despite the overall drop in new permits, there were some counties that flourished last year. Out of the 24 counties that make up the Metro Atlanta area, there were five counties that defied the odds and actually exhibited year-over-year growth over the 12-month period; those counties are as follows:

  • Rockdale County: 421 permits, +75 percent YOY
  • Clarke County: 233 permits, +40 percent YOY
  • Paulding County: 1,315 permits, +12 percent YOY
  • Cherokee County: 2,344 permits, +7 percent YOY
  • Carroll County: 622 permits, +1 percent YOY

While the remaining nineteen counties all fell below residential construction activity levels from the previous year, there were still areas that carried a significantly high volume of new permitting activity. In fact, there were five counties where approximately 47 percent of all new permits originated; those counties with the greatest amount of new residential construction activity last year were as follows:

#1-Gwinnett County: 3,567 permits

#2-Cherokee County: 2,344 permits

#3-Fulton County: 2,012 permits

#4-Cobb County: 1,541 permits

#5-Forsyth County: 1,420 permits

When reviewing HBW’s Building Activity Trend Report to identify the areas with the greatest amount of higher value (>$500k) new residential construction, three counties came out on top, holding more than half of all higher value permits; those counties are as follows:

#1-Fulton County: 497 permits with values > $500k

#2-Coweta County: 191 permits with values > $500k

#3-Cherokee County: 177 permits with values > $500k

Information utilized for the above listed figures for Metro Atlanta residential construction was directly derived from HBW construction data reports. To gain access to the HBW database and receive custom and detailed reports on the latest residential and commercial building activity in Florida, Georgia, Texas, Alabama, and Oklahoma, please contact HBW for details.
5 Ways to Strengthen Your Social Media Profile

Easy ways to improve your presence on social media

Becoming active and establishing a presence on social media couldn’t be easier. At this stage in the game, all you need is an email address and creative handle, and you are good to go – Right?

Not really. The truth is that while getting on social media is easy, creating a professional profile is an entirely different story. Although there appears to be few rules in place when it comes to social media for personal purposes, your company’s social presence is the face of your business; what you say and do can and will impact your reputation. Additionally, most of your leads and contacts will check out your activity on social platforms to learn more about you, and what you post may just be the first and only content prospects see when looking into your products and services.

For this reason, it is important that you make the most of your social media presence by effectively reflecting your brand and professionalism. Here are tips for improving your business profiles:

Keep it Fresh – It’s easy to make social media profiles a depository for images, events, and news, but it is important to add relevant content that reflects your brand and company as it stands today. Don’t allow your page to become outdated or stale. By maintaining a steady flow of new and fresh content, you can increase engagement and attract new visitors.

Talk to Your Audience – A common issue with managing social media profiles is responding to feedback, comments, and messages.  Where and when appropriate, make an effort to follow up with inquiries, requests and responses (positive and negative). Take time to thank those who provide positive feedback and remain professional and noncombative when responding to negative feedback.

Make Accounts Secure – Whether you have one or several social media account managers, you should have a system in place for regularly securing accounts. What this essentially means is that passwords for profiles should be strong and changed on a quarterly or bi-annual basis.  Additionally, users/members of the page should be reviewed to verify that each user has the appropriate level of access (admin or limited user) and is still employed by your company.

Keep it Real – The bots in the world of social media are simply unavoidable. From spamming a blog’s comments section to relentlessly following and messaging you on Twitter, they are out there.  For this reason, it is important to eliminate fake followers, bots and connections that don’t abide by network guidelines and/or post questionable content.

Choose Wisely – When establishing a page/profile for business purposes, it is important that you choose platform(s) wisely.  Building a following and presence on any social media platform takes time, and some may be a better fit for your brand than others. You will want to consider where you can best reach your target audience, the type of content that is most effective on each platform, and who and how you will maintain the account.

Social media can be a great way to share interesting content about your company, its culture and your team, and the above listed tips can help you remain professional, reach your target market, and ultimately convert current visitors to future customers.

For more information on construction business marketing tips, stay connected with the HBW Blog.  To get ahead of construction activity and gain access to the latest permitting data in Florida, Texas, Georgia, Alabama and Oklahoma, contact HBW for more information on construction data reports and industry leads.

Using Building Permit Data to Improve Marketing

A summary of how construction data reports can benefit your marketing efforts

As HBW subscribers already know, a wide range of construction permit data is available and constantly updated in the HBW database. And while there are many ways to understand and gain insight on your target audience and market, there is nothing quite as accurate as building permit data.  When you have access to detailed information about construction that is happening in your target market(s), you can create a marketing strategy that is tailored to the demand and pattern of each area where you provide products/services.

In addition to gaining a greater understanding of current trends and projects within your target market, construction permit data can also provide in-depth insight into seasonal and past patterns (through archived reports), as well as give you a better understanding of where and how your direct competition is performing within a given region.

As any marketer knows, understanding your target audience and their interests is an essential part of developing an effective marketing strategy. Although talking to customers and industry partners can offer some useful information about your audience, building permits provide information about the types of projects that are of greatest interest, as well as data on the average cost and value of a variety of projects within your area; this is especially useful when fine-tuning your own pricing to remain competitive within each market.

Information about your target audience’s budgets and spending patterns can help guide you on which products and services you can promote most successfully, as well as identify where there is increased demand for specific price points on products and services. For example, if you offer swimming pools, luxury designs, or other services that are in higher demand by upscale homeowners, then you can use construction permit data to find the areas where higher value construction is abundant. On the other hand, you may find areas where values and construction budgets are on the lower end of the scale; in this case, positioning your line of services and products that cater to durability and affordability will benefit your marketing efforts.

As a construction professional, you have many options for reaching your target audience, but if you don’t reach them with information that speaks directly to their needs, your message can quickly fall into the background. For this reason, using permit data to better position your company will enable you to present products and services that are tailored to each unique market and customer, ensuring that your company is front and center and top-of-mind with your prospects.

For more information on construction business marketing tips, stay connected with the HBW Blog.  To get ahead of construction activity and gain access to the latest permitting data in Florida, Texas, Georgia, Alabama and Oklahoma, contact HBW for more information on construction data reports and industry leads.

Top Pool Builders in Florida – November 2022

A review of leading pool contractors in Florida during the month of November

As reported on the HBW blog earlier this week, there were more than 1,860 new swimming pool construction permits with a total value of approximately $126 million added to the HBW database for Florida during the month of November 2022. Today, we are taking a deeper dive into HBW’s construction data reports to identify the leading contractors that were driving new swimming pool construction in each of the five major regions of Florida last month.

Based on HBW’s latest reports, the pool builders with the greatest number of new swimming pool construction permits on record in Florida for the month of November are as follows:

Tampa

Out of the approximately 130 active contractors with new swimming pool construction on record with HBW in the Tampa area last month, the following ranked as the top five for total new permits:

BuilderTotal Permits Average Value
1-Bob’s Pool Service67 $    20,075.00
2-Challenger Pools18 $  106,747.00
3-Staycation Pools17 $    35,000.00
4-Tampa Bay Pools13 $    92,669.00
5-Larry Bosse Jr. Pools12 $    59,833.00

Southwest

Last month, there were nearly 160 contractors with new swimming pool construction on record with HBW in the southwestern region of Florida, and the following ranked as the top five for total new permits for the one-month period:

BuilderTotal Permits Average Value
1-Pinnacle USA46 $    55,304.00
2-Waterscapes Pools & Spas32 $    51,807.00
3-Trusted Pool & Spa22 $    81,432.00
4-Contemporary Pools22 $    75,800.00
5-Coast to Coast Pools22 $    45,917.00

Southeast

In the southeastern region of Florida, there were more than 155 pool contractors with new construction activity on record with HBW last month, and the following ranked as the top five for total new permits:

BuilderTotal Permits Average Value
1-AAA Custom Pools24 $    46,390.00
2-A&G Concrete Pools23 $    73,734.00
3-Endless Summer Pools of Florida12 $    77,936.00
4-Pool Builders12 $    62,628.00
5-Liberty Pools11 $    91,613.00

Orlando

Last month, there were nearly 85 contractors with new swimming pool construction on record in the Orlando area, and the following ranked as the top five for total new permits:

BuilderTotal Permits Average Value
1-Bob’s Pool Service25 $    27,152.00
2-Dreamscapes Pools & Spas23 $    52,609.00
3-All Seasons21 $    71,736.00
4-American Pools & Spas21 $    57,812.00
5-Holland Pools14 $    51,886.00

Jacksonville

In Jacksonville, there were 60 contractors with new pool construction on record with HBW last month, and the following ranked as the top five for total new permits during the one-month period:

BuilderTotal Permits Average Value
1-Agua Pools & Spas15 $    91,733.00
2-Blue Haven Pools9 $    82,143.00
3-Epic Pools & Hardscape Construction8 $    90,601.00
4-Pools by John Clarkson7 $  127,774.00
5-Amelia Outdoors7 $    61,714.00

To gain more information on the builders, homeowners and permits for the construction activity above, check out HBW for your copy of the latest construction data reports. To gain access to the HBW database and receive custom and detailed reports on the latest residential and commercial building activity in Florida, Georgia, Texas, Alabama, and Oklahoma, please contact HBW for details.
Florida Swimming Pool Construction Report – November 2022

A review of permit data for new swimming pool construction across the Sunshine State during the month of November

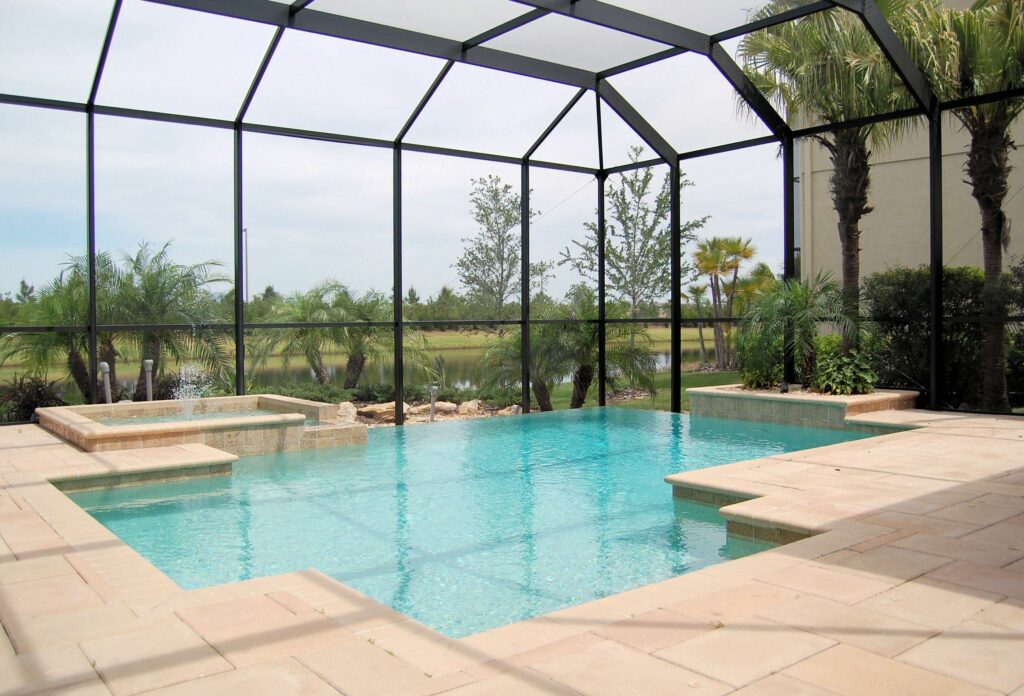
Based on the latest construction data reports from HBW, there were more than 1,860 new swimming pool construction permits with a total value of approximately $126 million added to the HBW database for Florida during the month of November 2022.  The report factored in all new swimming pool construction permits from five major regions of the state (Southwest, Tampa, Orlando, Southeast, Jacksonville), and out of the regions reviewed, the southwestern region carried the greatest volume of new swimming pool construction (629 permits), while the highest average value of construction could be found in Jacksonville (average value: $87,890).

Here is a closer look at the total new permits, construction values and leading counties with the greatest concentration of new swimming pool construction last month:

Southwest

In the southwest, there were 629 new swimming pool construction permits with a total value in excess of $40 million last month.  The average value of new swimming pool construction was lowest in the southwest (average value: $63,781) in comparison to other Florida regions reviewed, and 54 percent of all new construction took place in the counties of Lee (180 permits) and Collier (159 permits).

Tampa

In Tampa, there were approximately 415 new pool permits with a total construction value of nearly $28.3 million last month.  The average value of new pool construction was $67,994, and more than half of all new permits originated from the counties of Hillsborough (88 permits) and Polk (131 permits).

Southeast

Ranked #3 for new pool construction in Florida, the southeastern region had 395 new permits with a total construction value of approximately $26.7 million on record last month.  The average value of construction was $67,524, and the counties with the highest concentration of new pool construction activity during the one-month period were Palm Beach (146 permits) and Miami-Dade (83 permits).

Orlando

Last month, there were more than 270 new swimming pool construction permits with a total value of nearly $17.6 million in the Orlando area.  The average value of construction was $64,845, and approximately 65 percent of all new swimming pool construction activity took place in the counties of Orange (119 permits) and Brevard (57 permits).

Jacksonville

In Jacksonville, there were more than 150 new pool permits with a total construction value of approximately $13.3 million last month.  The average value of new pool construction was highest in Jacksonville (average value: $87,890) in comparison to other Florida regions, and the bulk of all new permits originated from the two counties of St. Johns (66 permits) and Duval (34 permits).

To gain more information on the builders, homeowners and permits for the construction activity above, check out HBW for your copy of the latest construction data reports. To gain access to the HBW database and receive custom and detailed reports on the latest residential and commercial building activity in Florida, Georgia, Texas, Alabama, and Oklahoma, please contact HBW for details.