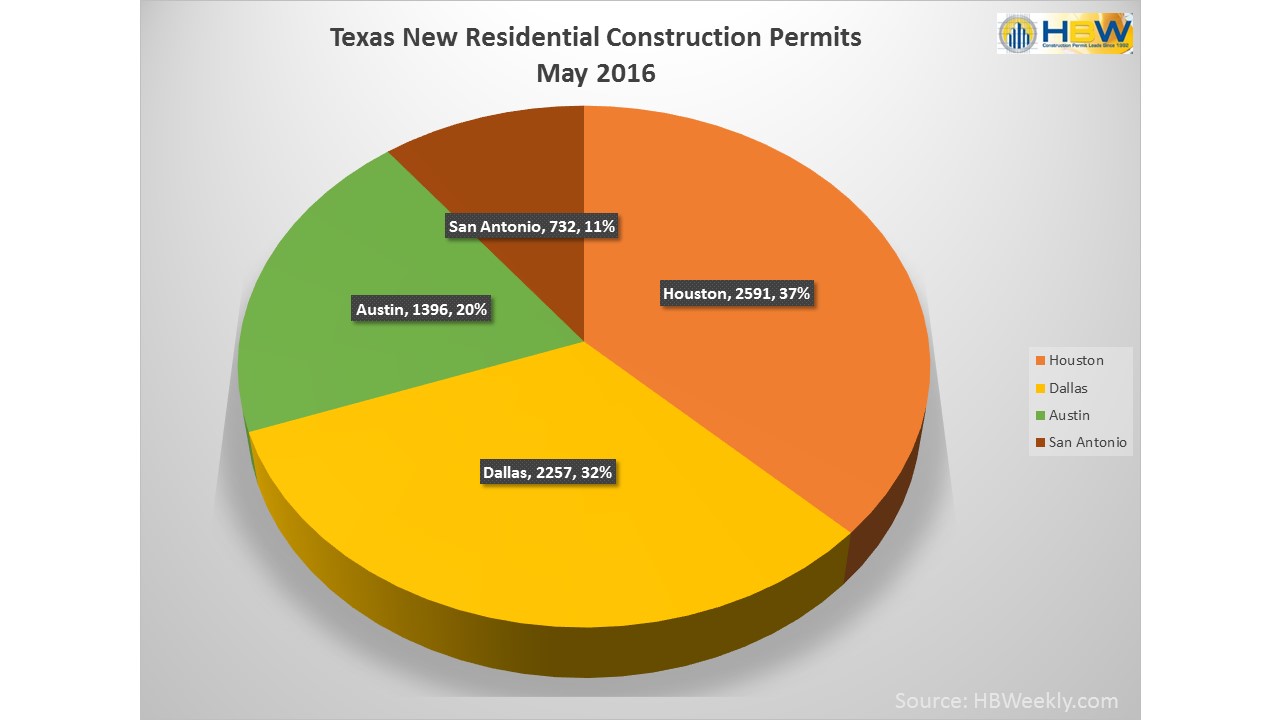
This week, our eye has been on Texas. With nearly 7,000 new permits on file with HBW for the month of May, it has been an active period for new residential construction in the Lone Star state. As reported in the Texas Home Building Report earlier this week, the HBW database experienced a 37% increase in new residential construction permits between April and May. As one may expect, the companies behind the new construction have also experienced increases in housing starts, some as high as 72%.
The top three home builders for housing starts in May remain the same as April. Even though they are holding the same positions in leading new residential construction, they certainly experienced an increase in new projects over the month. Here’s a look at the top three home builders from permitting reports reviewed from Dallas, Houston, Austin and San Antonio:
#1 – D.R. Horton – D.R. Horton has held the #1 spot for total permits on file every month since the beginning of the year. In May, there were 72% more housing starts on file throughout Texas for D.R. Horton in comparison to April. With 794 new residential construction permits in May, it is no surprise that this builder has a strong hold on new home construction in Texas.
#2 – Pulte Homes – Holding in the second highest spot since April, Pulte Homes had 356 housing starts on file for the month of May. Pulte Homes also experienced an increase in starts on file with a 29% surge in total permits since April.
#3 – Lennar Homes – Continuing to be side-by-side and close to Pulte Homes each month for total new permits, Lennar Homes was third highest for housing starts; in May, the home builder had 347 starts which is approximately a 28% increase in total permits in comparison to April.
Focusing in and taking a more detailed look at home builders in each given metro area, we notice that there are clearly a few other home builders worth recognition. Although D.R. Horton has held the most statewide housing starts in May, Continental Homes of Texas took the lead in San Antonio, and Lennar Homes had the most permits on file for the month in Houston. Here is a look at the top five home builders for housing starts last month:
Dallas
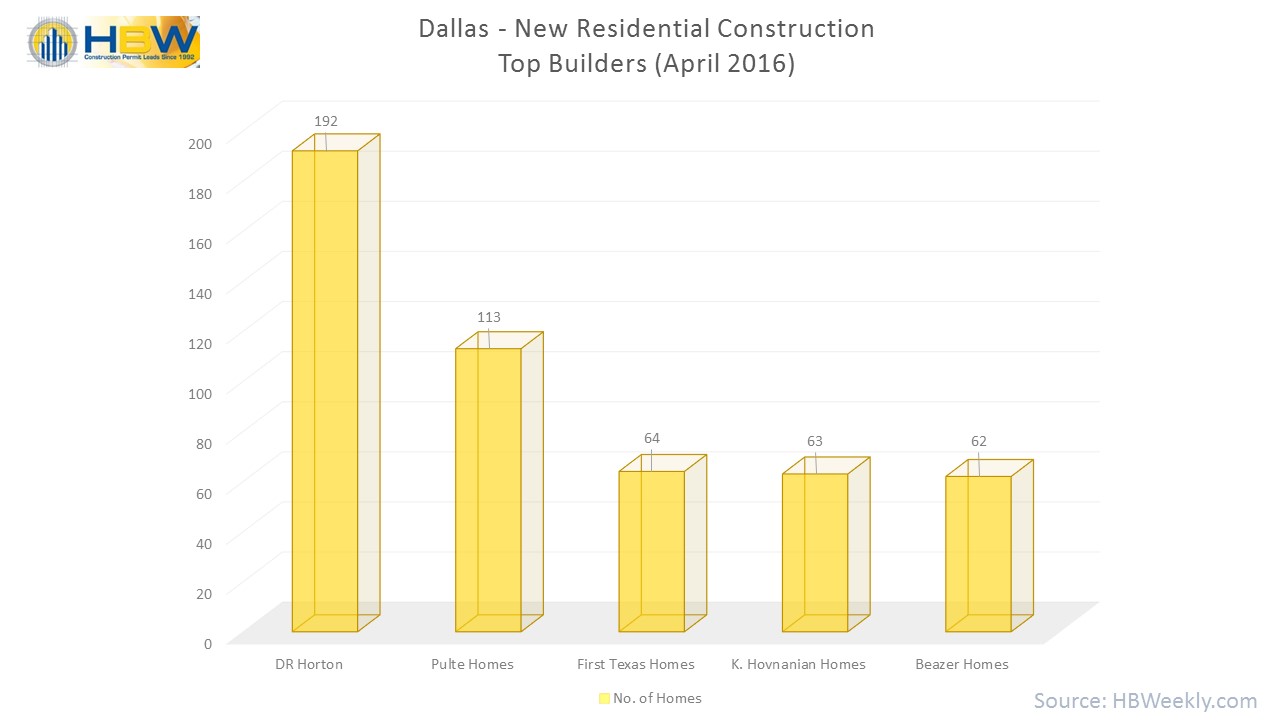
There is no shortage of new construction data for Dallas in the HBW database. With more than 2,250 housing starts and nearly 275 active builders on file for the month, the area continues to offer great opportunity for home builders. The top three builders from April continued their lead in May, while also experiencing increases in total starts. D.R. Horton held the top spot with 238 housing starts (up 23% since April) and nearly $52.5M in total construction value. Pulte Homes continued to be the second highest for total new permits with 155 housing starts (37% increase since April) and more than $26.7M in construction value. In at #3, First Texas Homes had a 35% increase in starts on file since April with 87 new residential construction permits and a total value in excess of $32.7M.
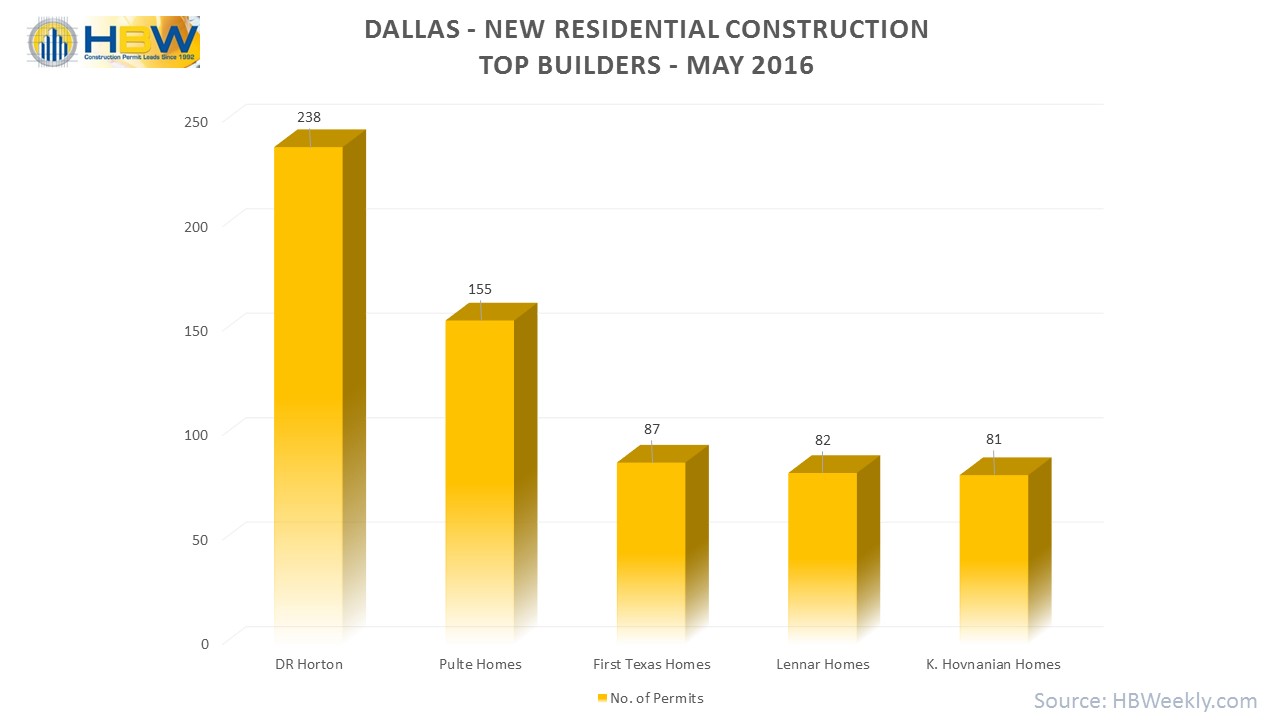
Dallas Top 5 Home Builders Total Permits – May 2016
Houston
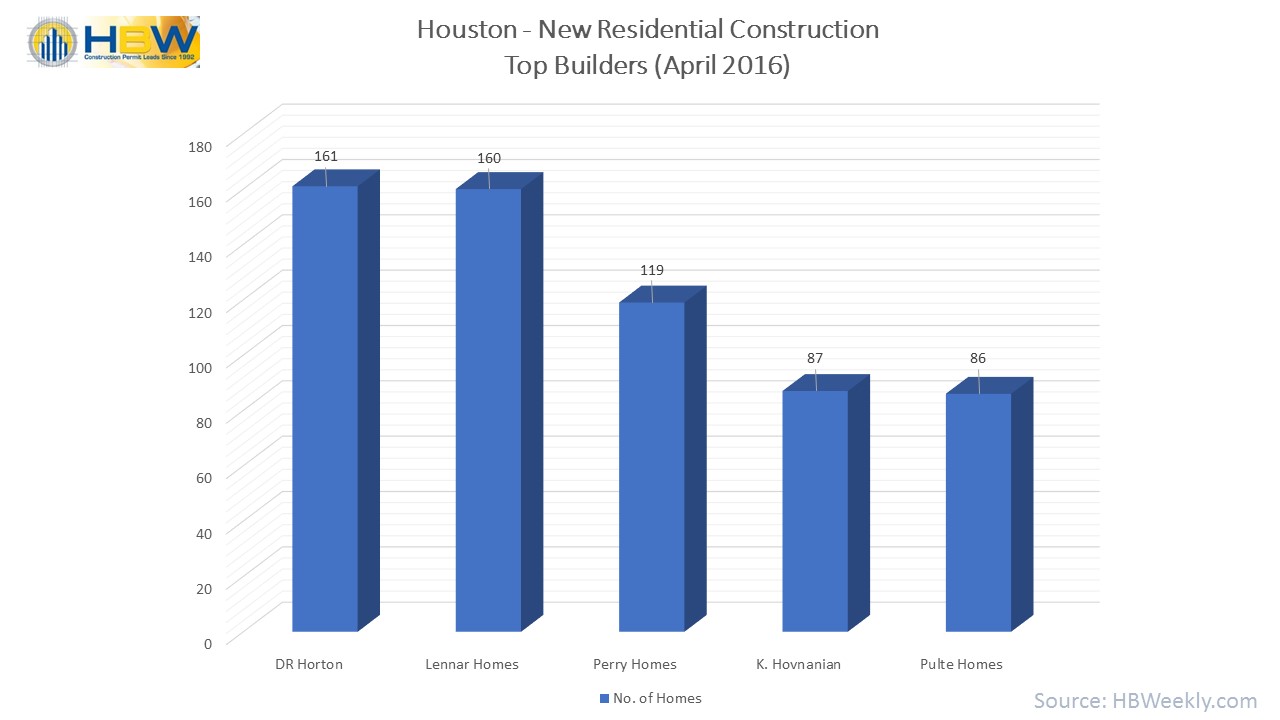
Out of the nearly 320 active builders in Houston for the month, Lennar Homes jumped up from second to the lead with a 20% increase in activity. Lennar Homes had 196 housing starts with a total value of nearly $31.2M for the month. Close and following, D.R. Horton dropped one spot to second in May with 149 housing starts in the area and close to $21.2M in construction. Not far behind and with a 45% increase in new permits since April, K. Hovnanian Homes jumped up one spot to third with 127 housing starts and more than $23M in value.
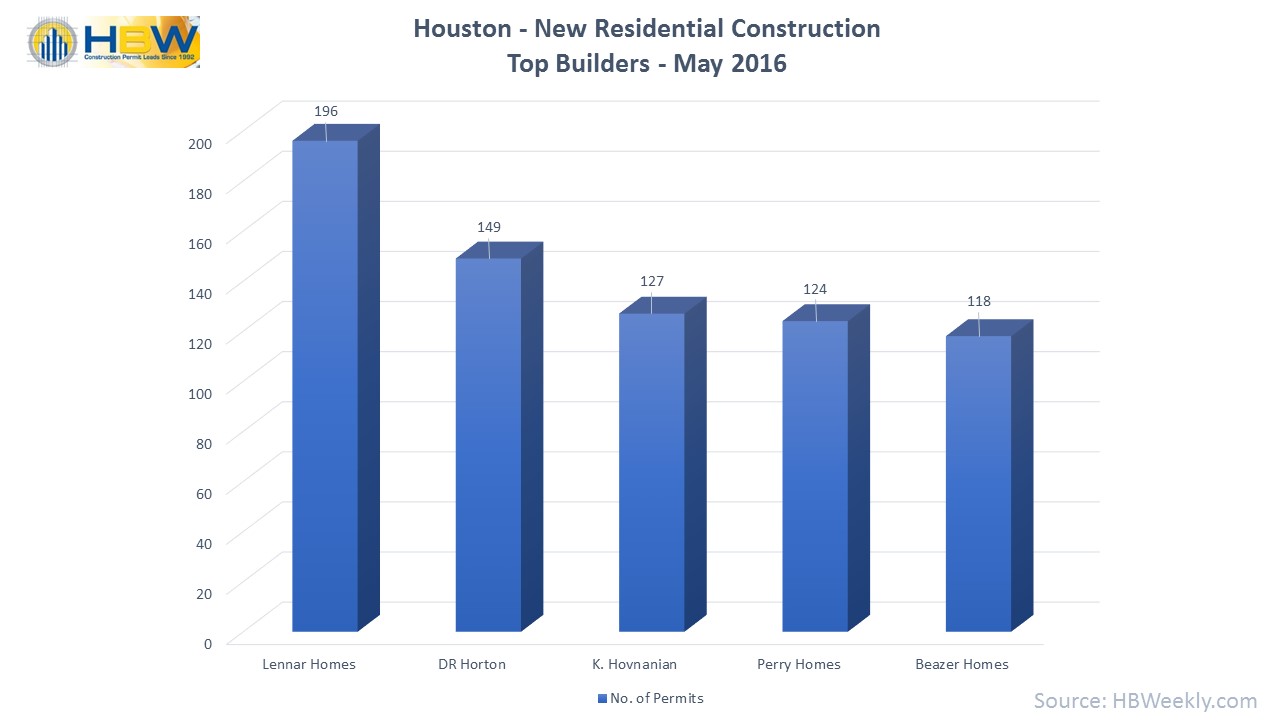
Houston Top 5 Home Builders Total Permits – May 2016
Austin
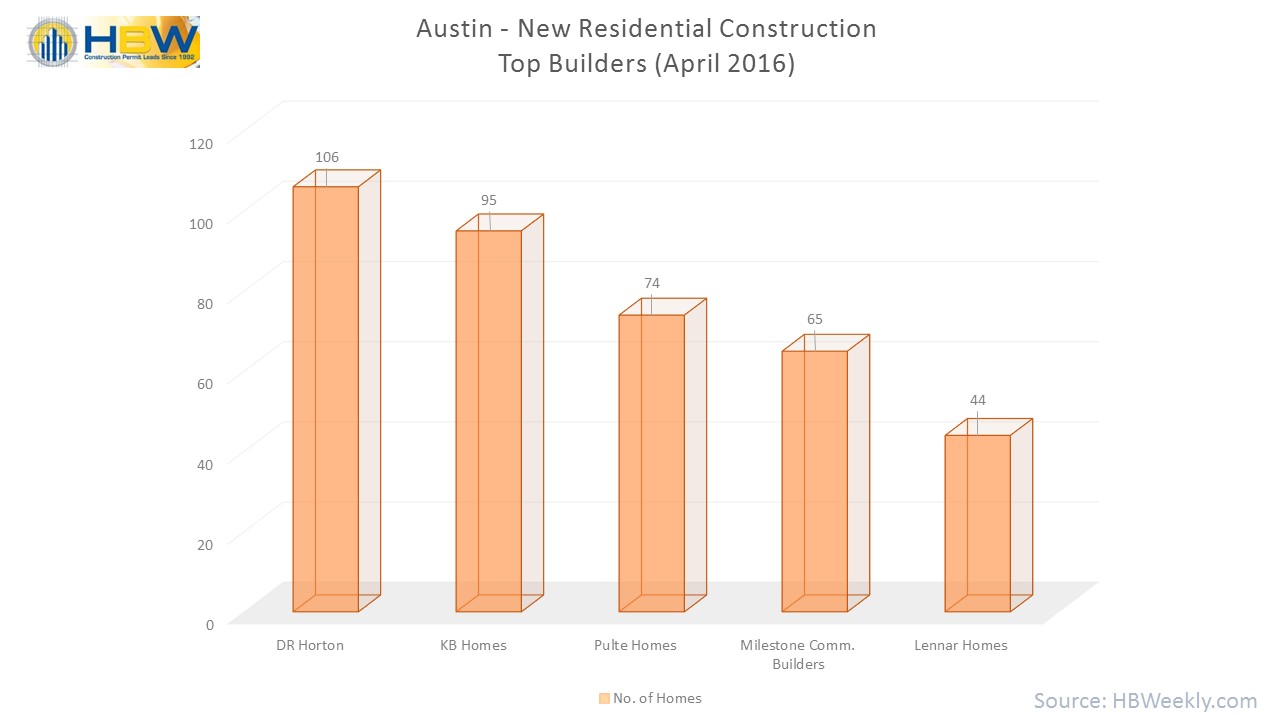
In Austin, the top three builders from April maintained their lead for May. D.R. Horton held strong at #1 in Austin with a massive increase in new permits with 375 housing starts and more than $62M in construction. KB Homes also held steady with 107 housing starts and close to $19M in construction value. Following close and stable at third highest, Pulte Homes had 81 housing starts (10% increase since April) and close to $18.2M in total value on file for May.
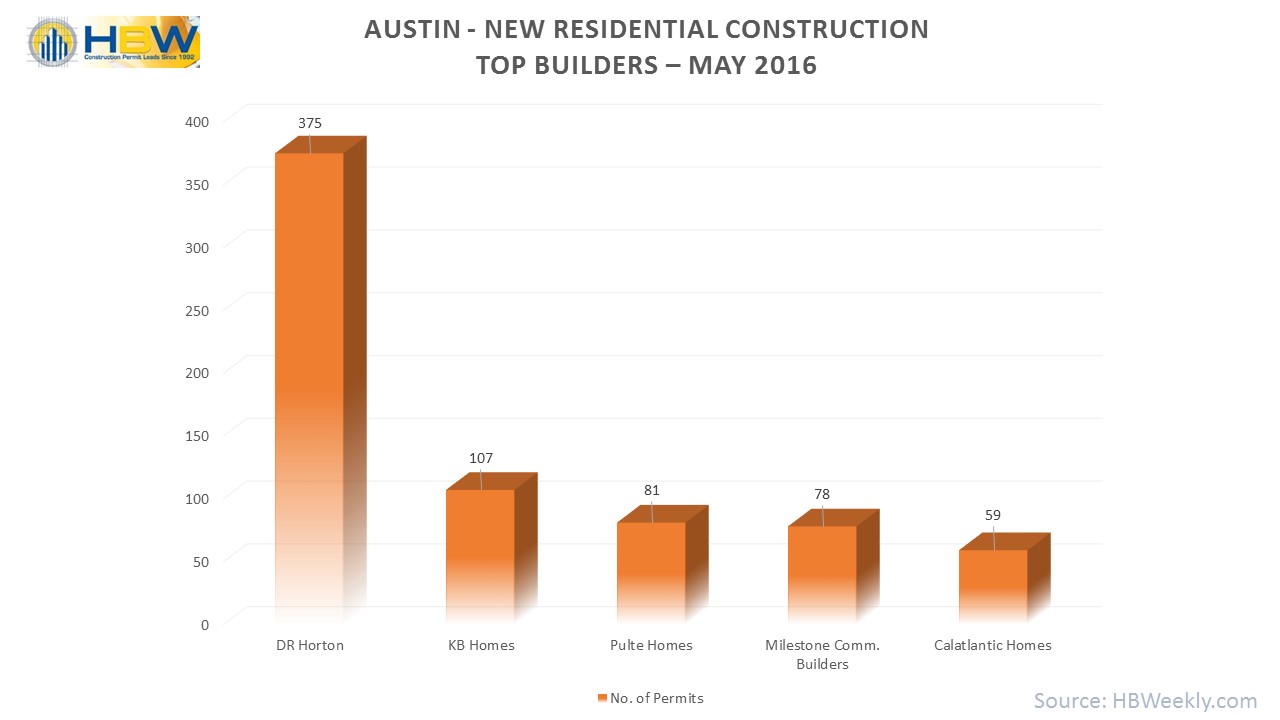
Austin Top 5 Builders Total Permits – May 2016
San Antonio
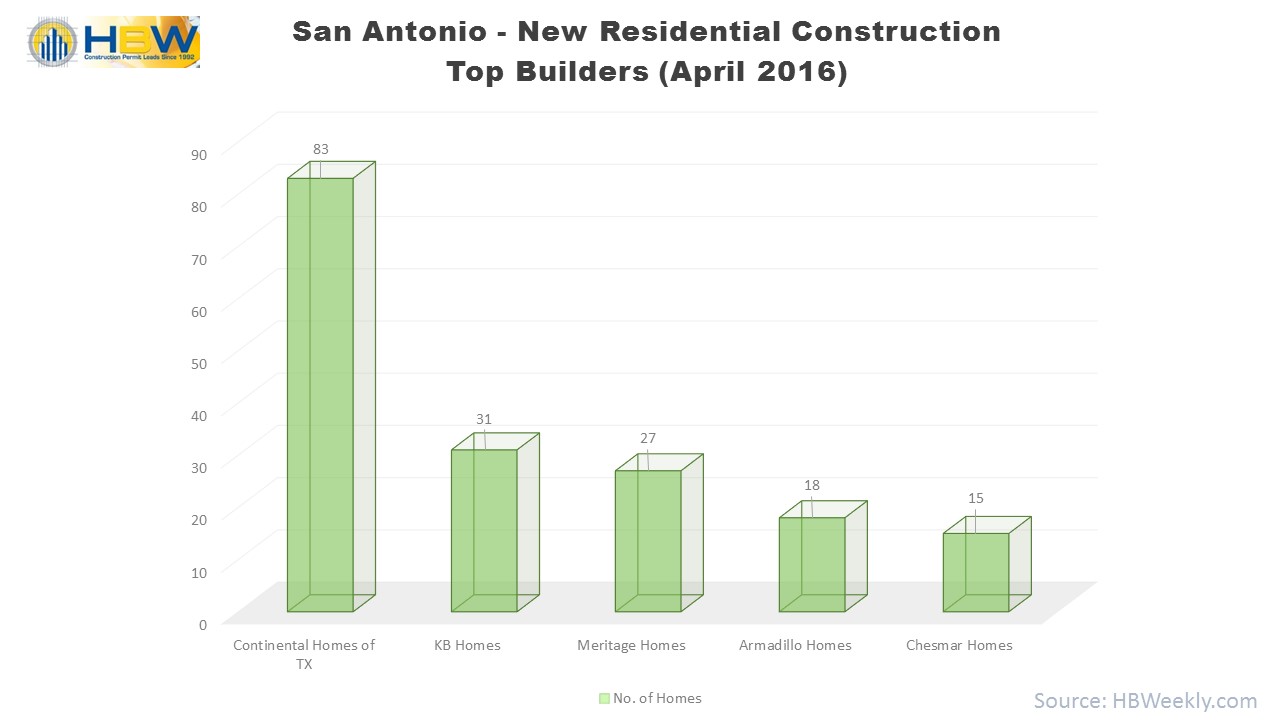
In San Antonio, Continental Homes of Texas held onto the top spot with a 12% increase in activity since April. Continental Homes had 93 housing starts on file for May with a total construction value of nearly $18.7M. KB Homes maintained its place at #2 with 57 new residential construction permits and close to $12.5M in value. Following close to KB Homes, RSI Communities which was not on the top five list in April joined in at #3 in May with 41 housing starts and more than $4.5M in total value.
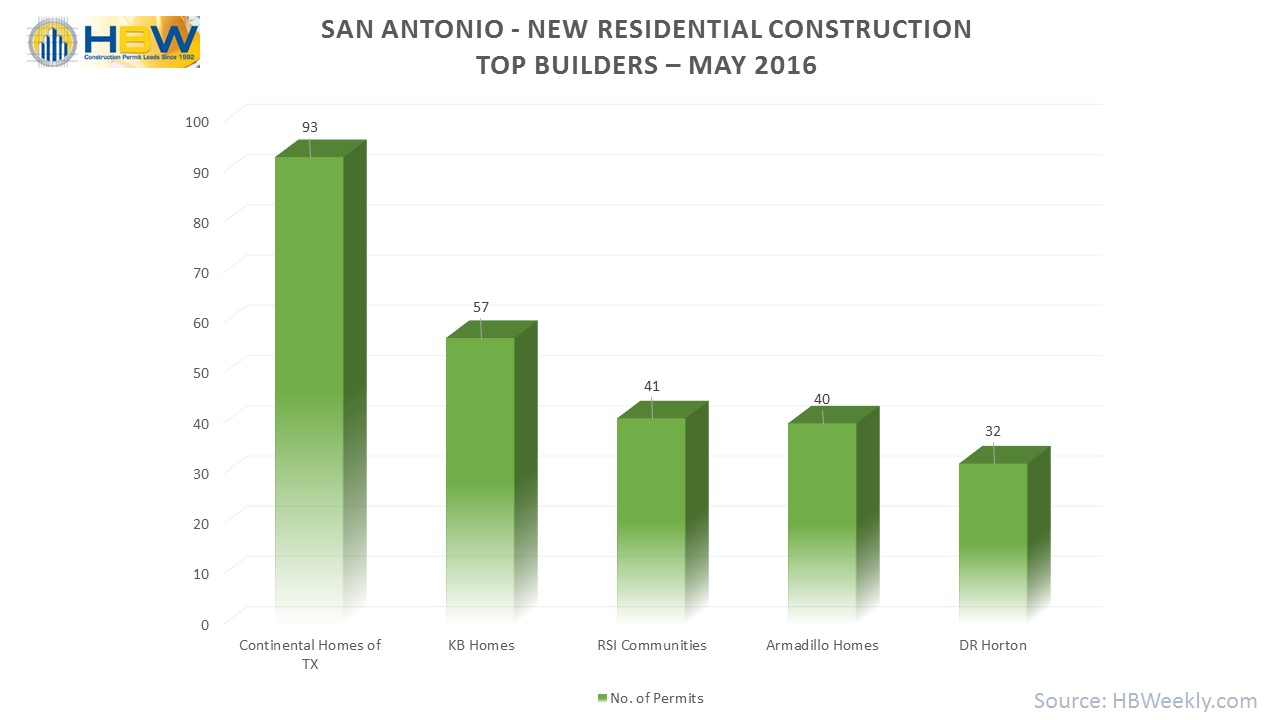
San Antonio Top 5 Home Builders Total Permits – May 2016
Information utilized for the graphs and above listed figures for Texas residential construction was directly derived from HBW construction data reports. To gain access to the HBW database and receive custom and detailed reports on the latest residential and commercial building activity in Florida, Georgia, Texas, Alabama, and Oklahoma, please contact HBW for details.