
Florida swimming pool construction is on the rise since December, with the southwest region leading for the month of January.
Florida swimming pool builders had a running start to the new year. The holidays have run their course and pool construction is back in action. When reviewing the HBW database for new swimming pool construction permit data in January, there is a noticeable increase (23% to be exact) in Florida pool construction activity in comparison to December 2015. From Tampa, Jacksonville, Orlando and the southeastern and southwestern areas of Florida, nearly 1,600 new swimming pool permits were added to the HBW database in January alone. The total combined construction value for pool starts in the above listed areas exceeded $63 million, with the southwestern region leading both in total permits (533 permits) and total value (~ $22.2 million).
The southwestern portion of Florida experienced a 28% increase in swimming pool construction since December and continues to drive new construction figures for the state. Although Southeast Florida has not been dominating in housing starts, it is second highest for swimming pool starts and up 16% since December. In January, the southeast region added 338 new permits to the HBW database and a total construction value of approximately $14.7 million, with the greatest concentration being in Palm Beach County (161 permits). Not far behind, the Orlando area was up 20% since December with 328 new swimming pool permits and more than $10.8 million in total construction value; the majority of construction in Orlando took place in Orange and Osceola counties (combined total of 228 permits). In Tampa, new pool construction increased 28% since December with 263 pool starts and a total construction value in excess of $10.2 million. Although Jacksonville was fifth for total starts (129 permits), it had a 15% increase in activity since December and a total construction value greater than $5.1 million.
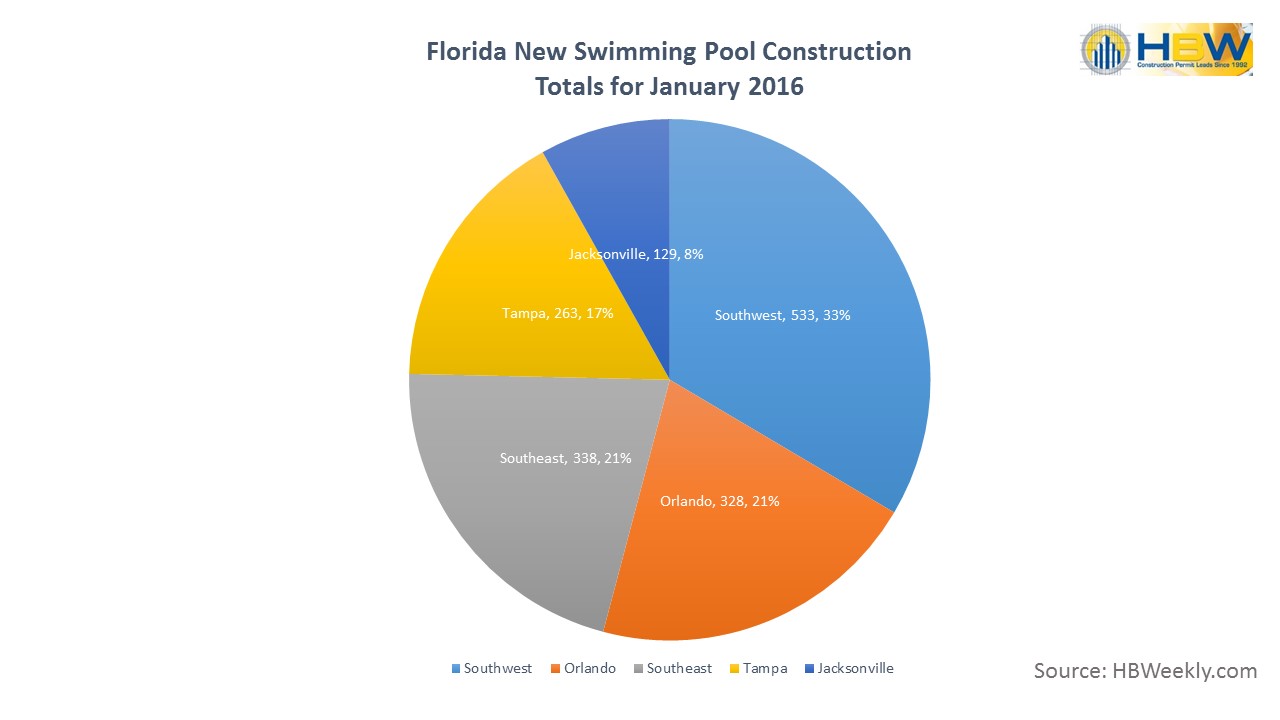
FL Pool Permits by Area – January 2016
Taking a closer look at the most active counties for the month, Palm Beach County (SE) led the Sunshine State with 161 pool starts in January and more than $6.5 million in total construction value. Lee County (SW) was close behind with 153 new swimming pool permits in January and a total construction value close to $6.5 million. Also in the southwest, Collier County came in at third highest for the month with 118 swimming pool starts and just over $5 million in total value. In Orlando, Orange County was the fourth highest for new pool construction activity with 118 starts and nearly $4.6 million in total value. Just behind Orange, Manatee County (SW) had 110 swimming pool starts in January and close to $5 million in total construction value.
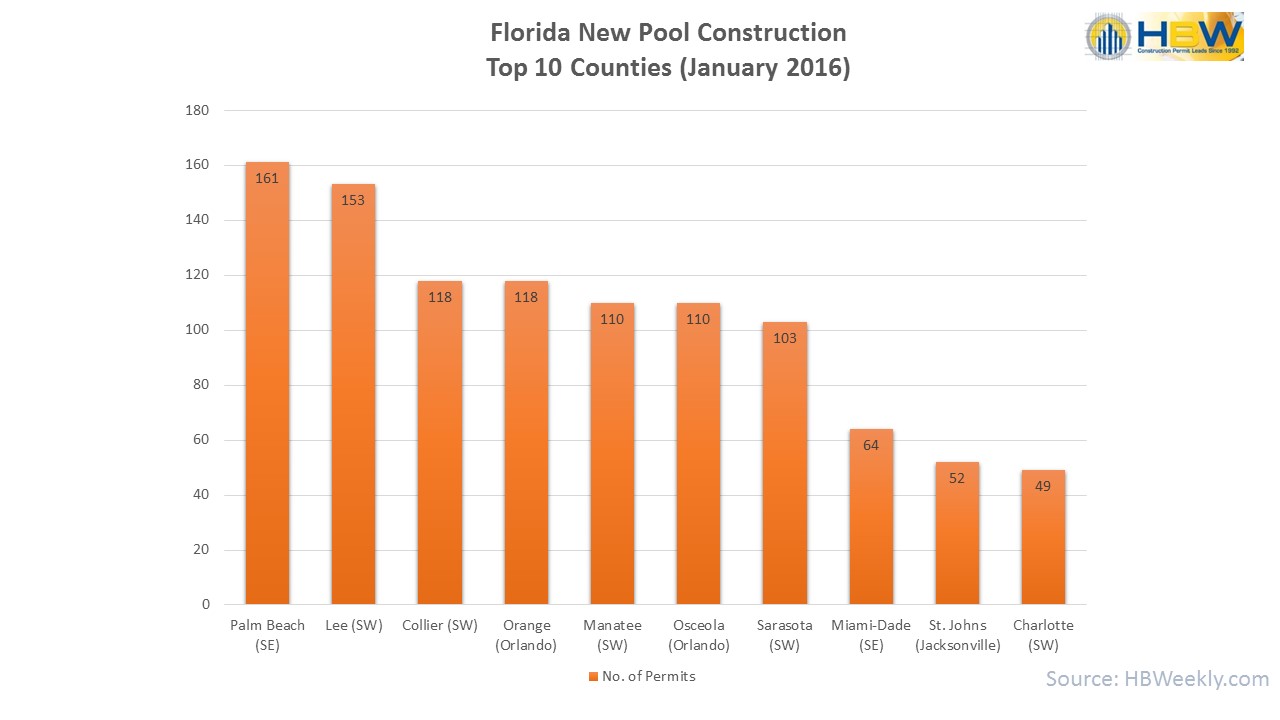
FL Top 10 Counties for New Swimming Pool Construction – Jan. 2016
Information utilized for the graphs and above listed figures was directly derived from HBW builder data reports. To gain access to the HBW database and receive custom and detailed reports on the latest building activity in Florida and beyond, please contact HBW for details.