HBW Report: Texas Residential Construction – June 2016

HBW report TX June

As HBW subscribers and readers are already aware, May was an exceptional month for residential construction in Texas.  Although June’s figures did not reach the spike from May, Texas residential permits are back to a steady pattern and incremental growth.  There were more housing starts on file with HBW for Texas in June than April.  Houston continues to boom in new residential construction, while Dallas is maintaining its lead in average value of construction

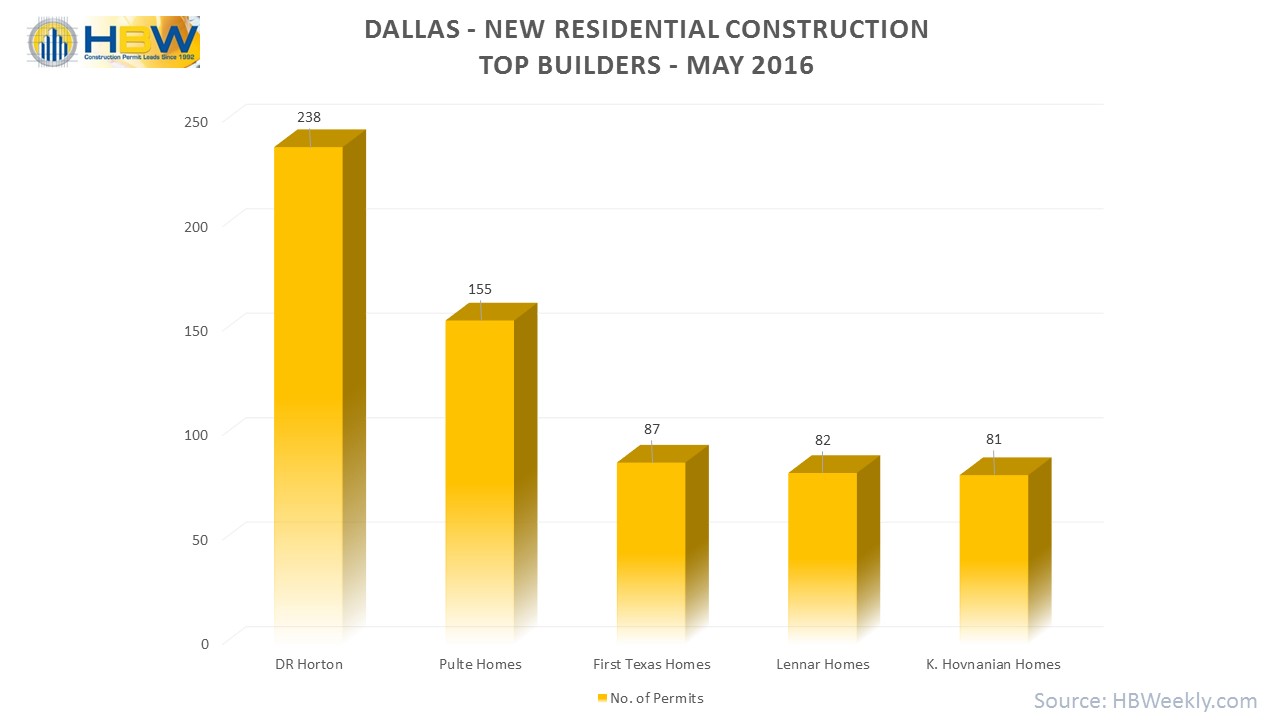
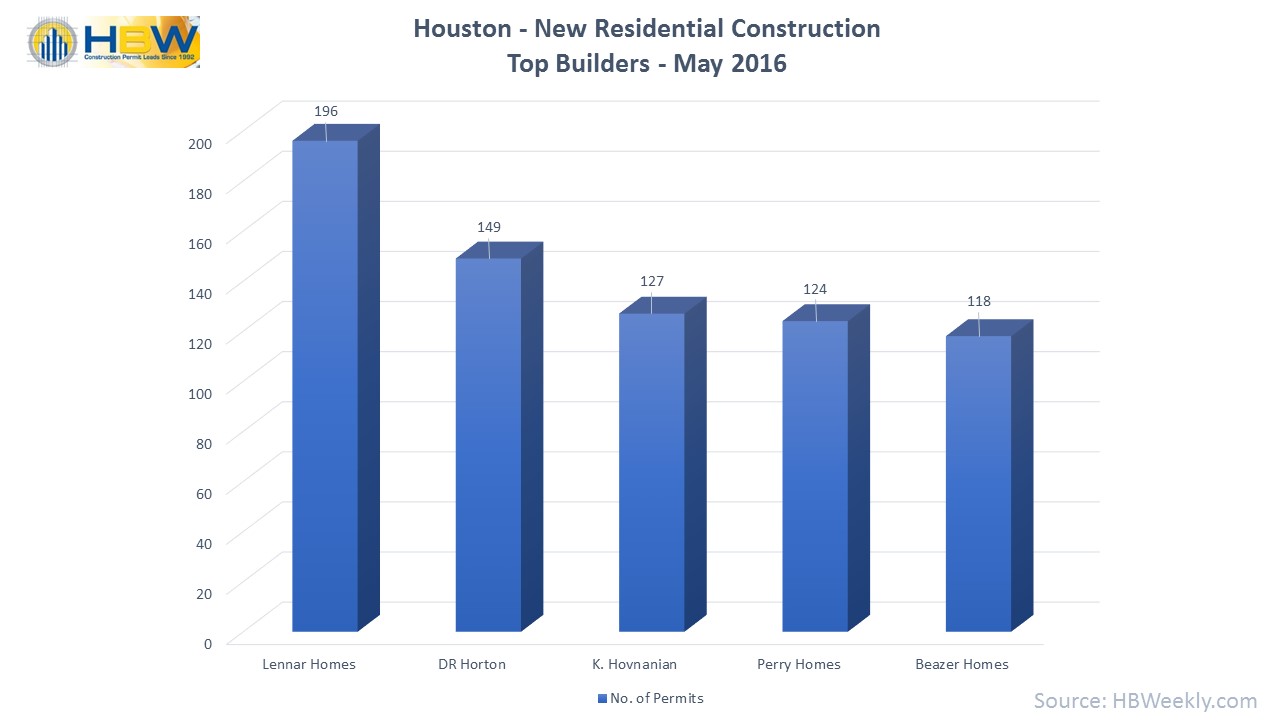
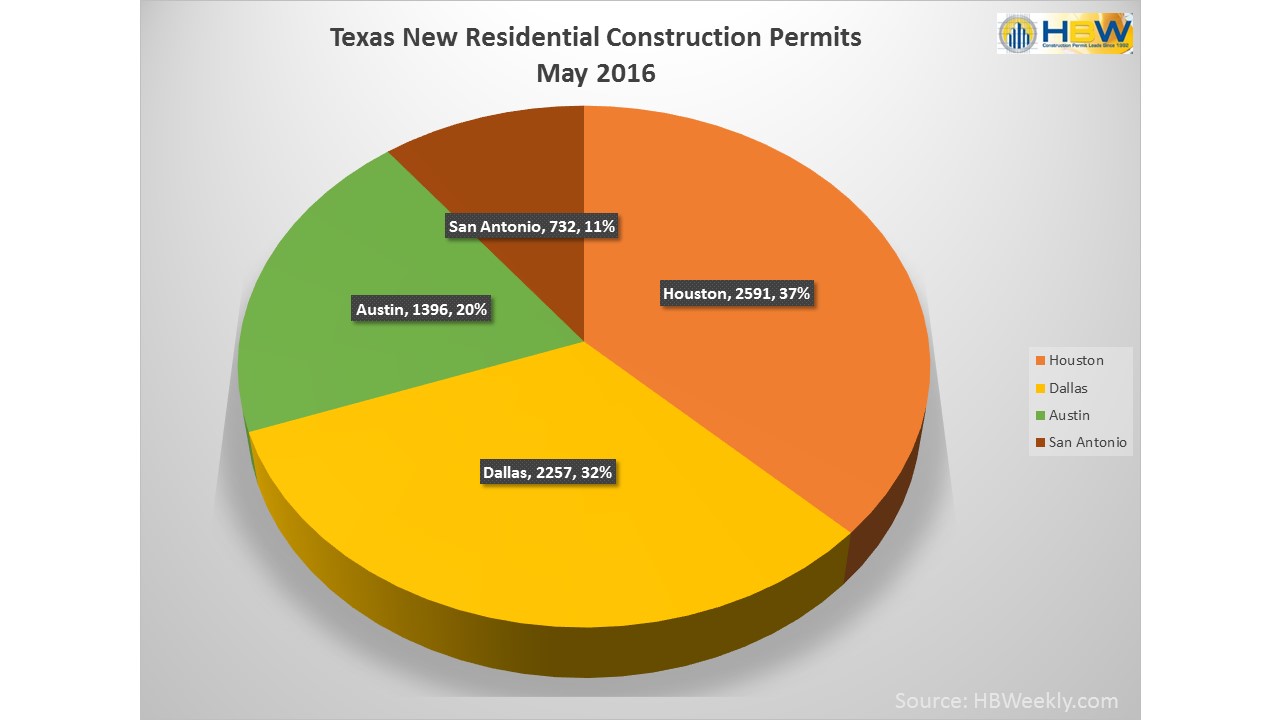
When combining totals for the four metropolitan areas of Dallas, Houston, Austin and San Antonio, there are nearly 5,350 housing starts on file for June and nearly $1.3B in construction.  Houston held onto its lead for total housing starts with 2,203 new residential construction permits and nearly $427M in construction value.  Although Dallas was second highest for housing starts (1,739 permits), the area dominated for greatest total value of construction ($522.3M+), as well as highest average value of new residential construction for the month.  Dallas has been gaining attention for some time as a hot market for real estate.  In June, Dallas ranked third hottest market nationally according to Realtor.com, jumping 3 spots since May (source: Realtor.com)   With increased demand and homes moving off the market quickly, it is no surprise that Dallas is a standout for higher-value construction in the state.

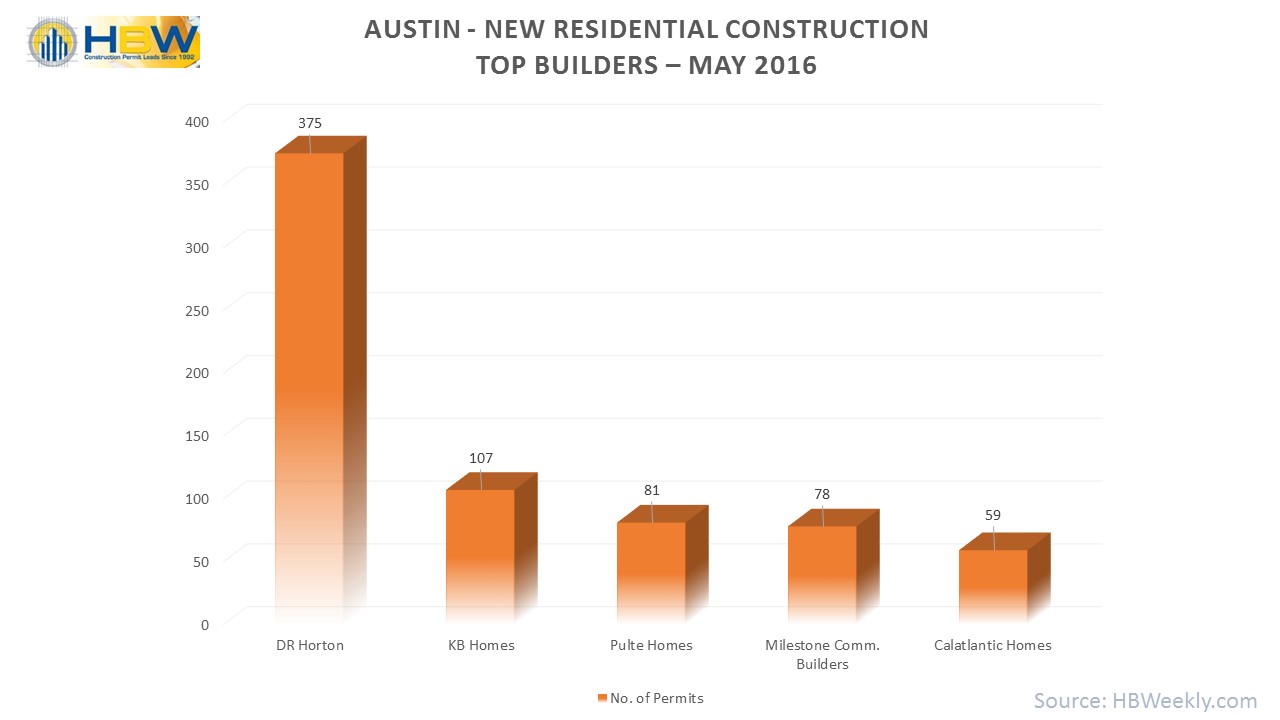
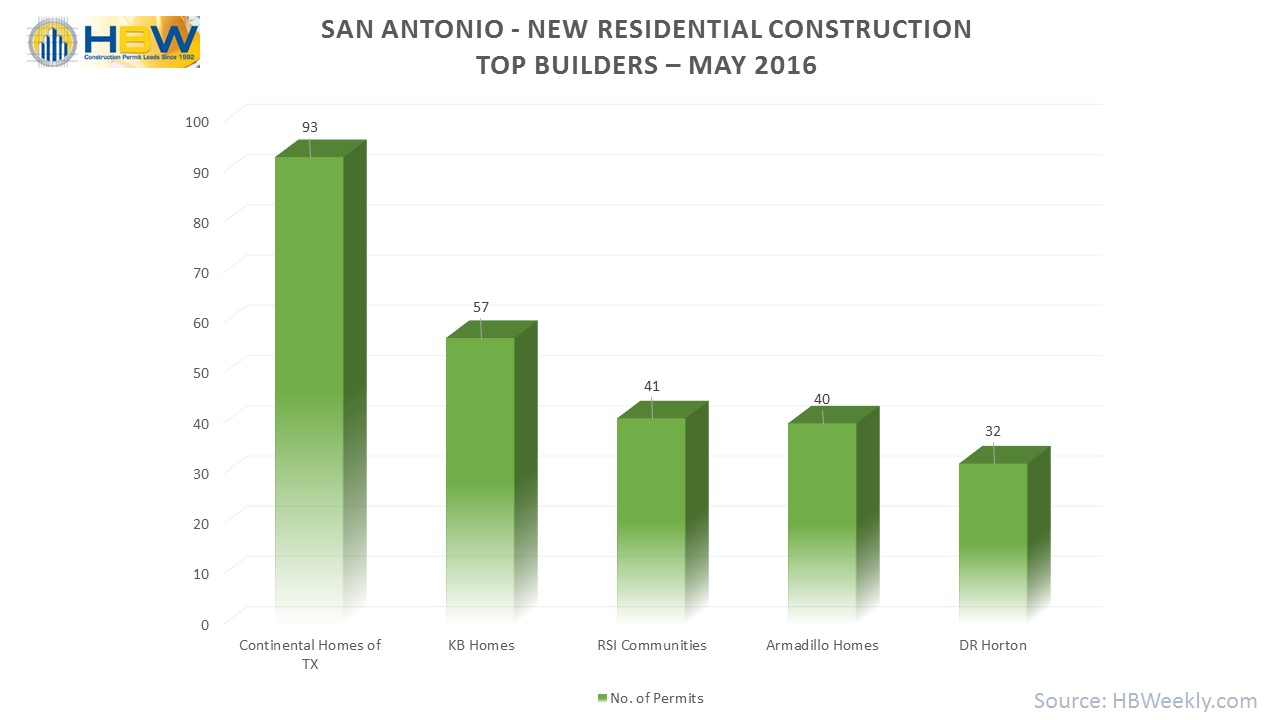
Austin and San Antonio came in third and fourth for total housing starts for the month, but don’t let ranking fool you.  Compared to the powerhouse metro areas of Dallas and Houston, it is easy to go unnoticed.  Truth be told, both Austin and San Antonio have a power of their own.  According to a recent article published by Forbes, Austin and San Antonio metro areas are strong and growing.  Due to Texas offering lower-cost places to conduct business, the state has been gaining manufacturing and tech job opportunities.  Homes in both Austin and San Antonio are considered overvalued by 19% and deemed to be the most overvalued markets in the country (source: Forbes).  Both areas are experiencing growth in population and job opportunities.  In June, Austin had 942 housing starts and more than $221M in construction value on file with HBW; Travis and Williamson counties held the bulk of new construction activity.  In San Antonio, there were 450 housing starts last month and close to $101.5M in construction value; Bexar and Comal counties held the most residential construction activity in the area.

Texas Residential Construction Permit Totals - June 2016

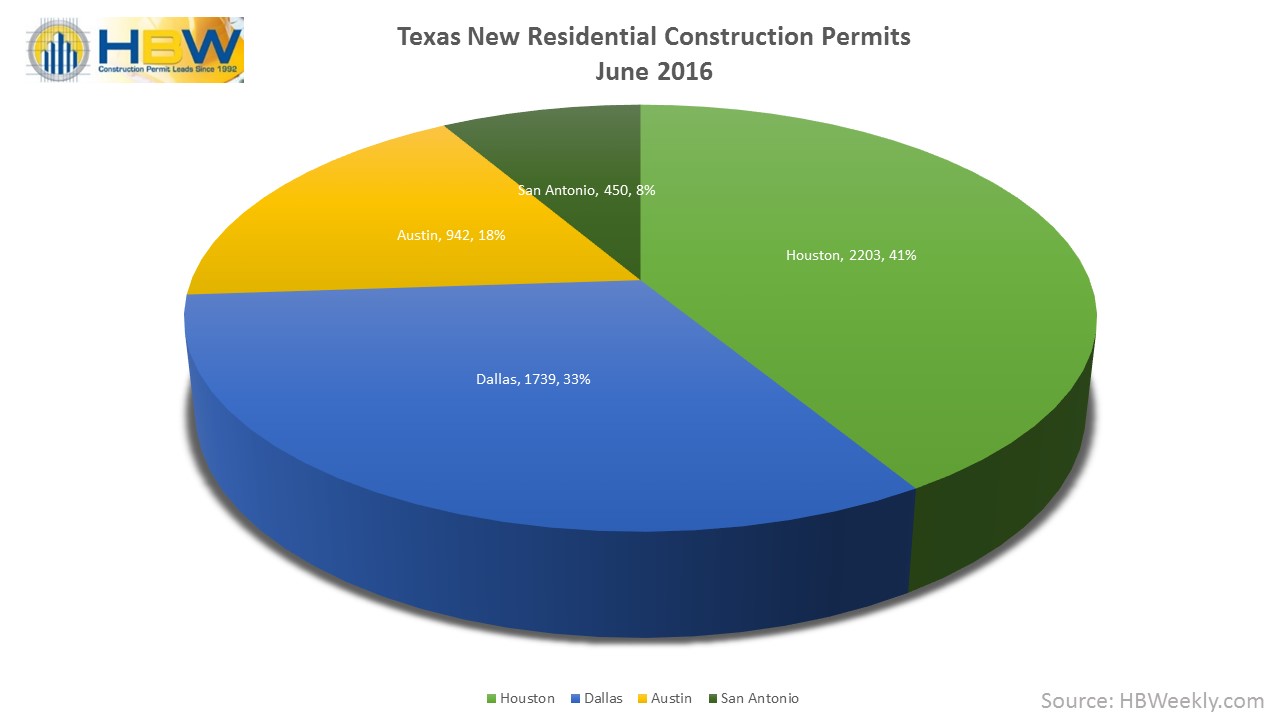
Texas Residential Construction Permit Totals – June 2016

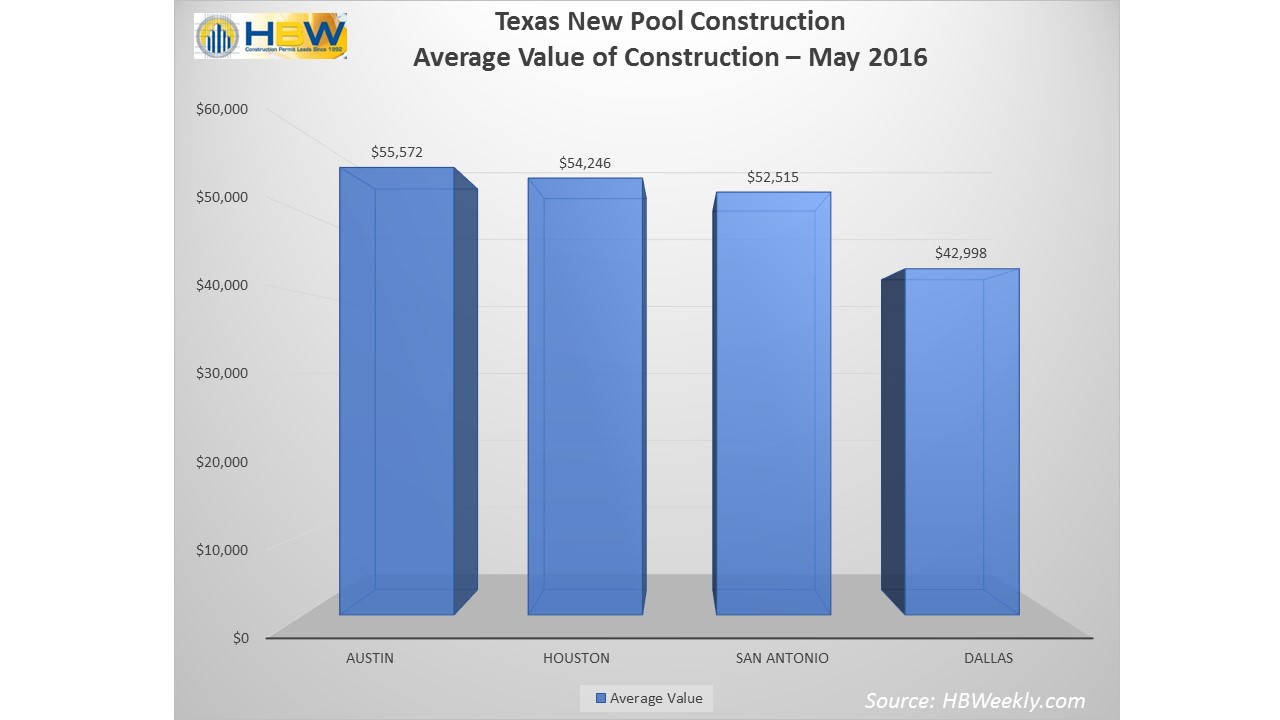
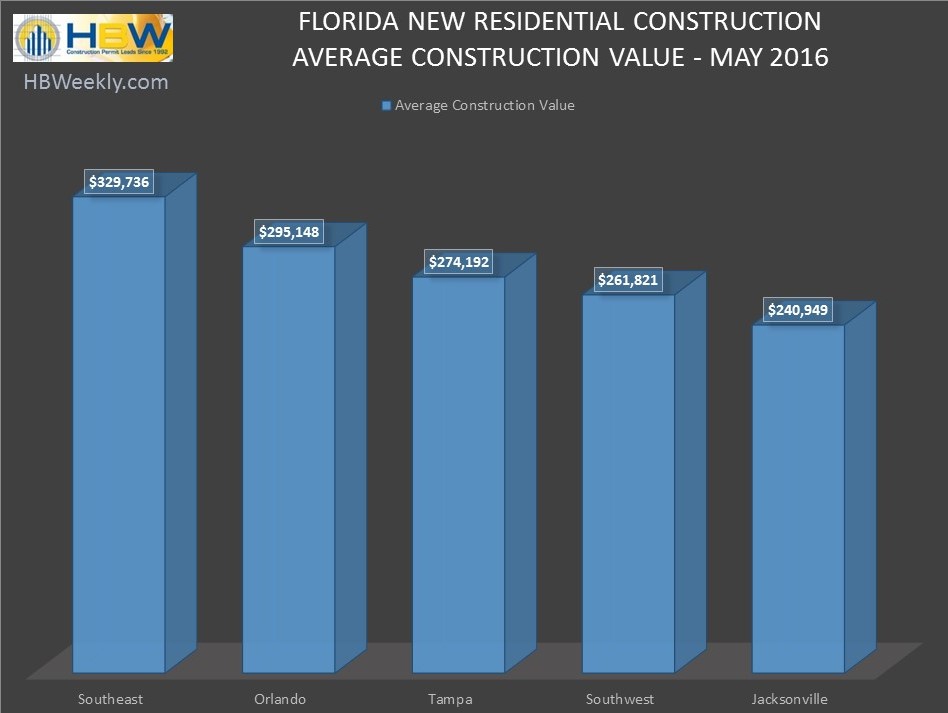
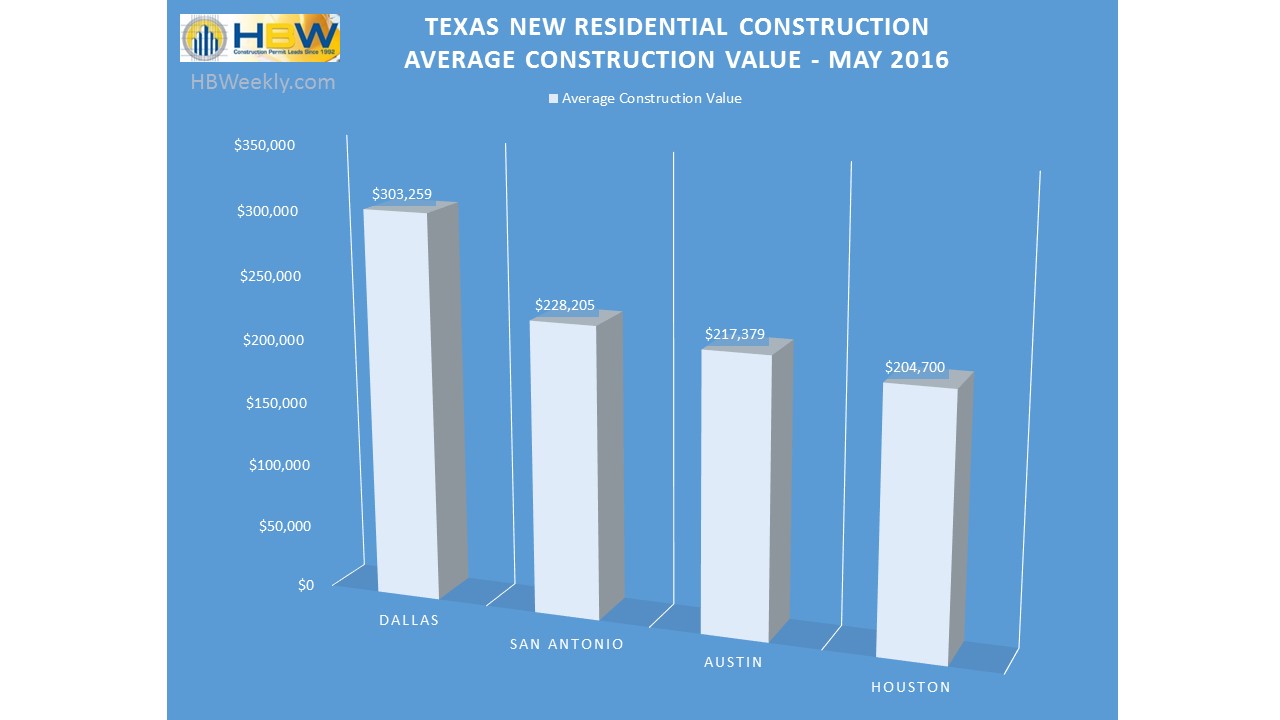
When reviewing the average value of construction, the order shifts.  As previously mentioned, Dallas continued to maintain the #1 spot for highest average value ($300,373).  Austin was next in line with an average value close to $235k, and San Antonio held the third highest average value of more than $225k.  While Houston has the most housing starts for the month, it holds the lowest average value of construction ($193,698).

Texas Average Value of Residential Construction - June 2016

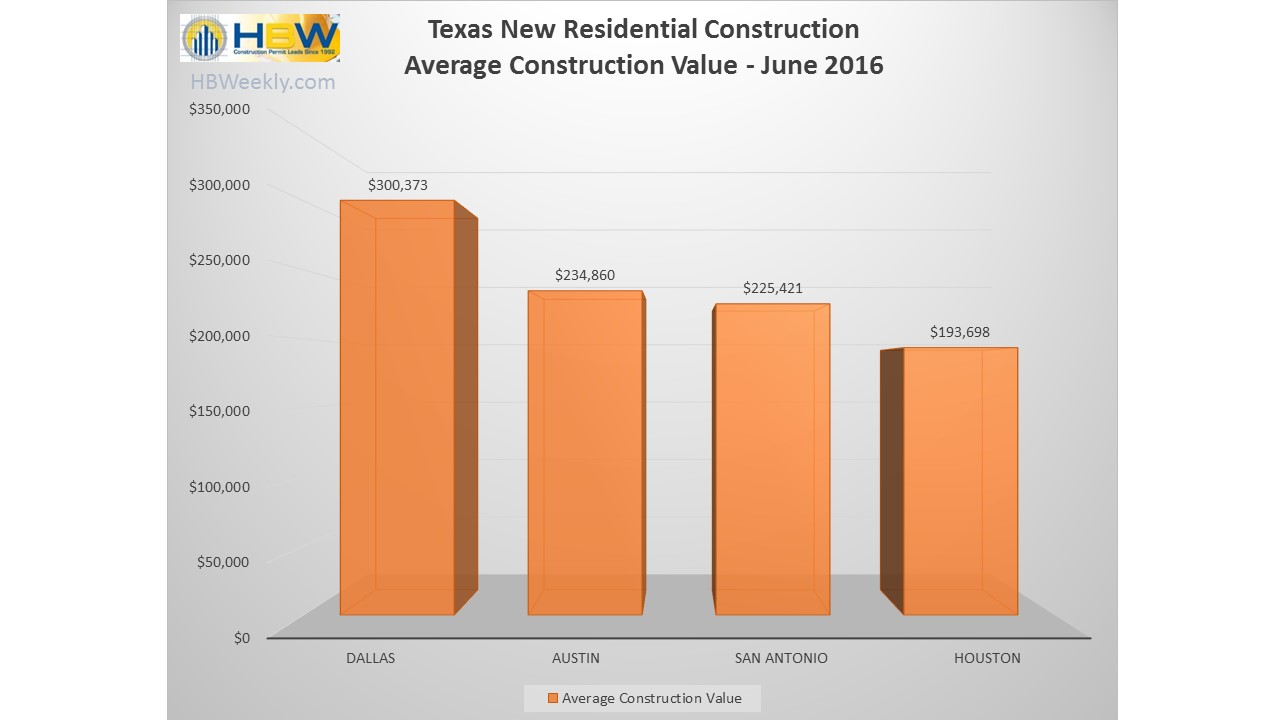
Texas Average Value of Residential Construction – June 2016

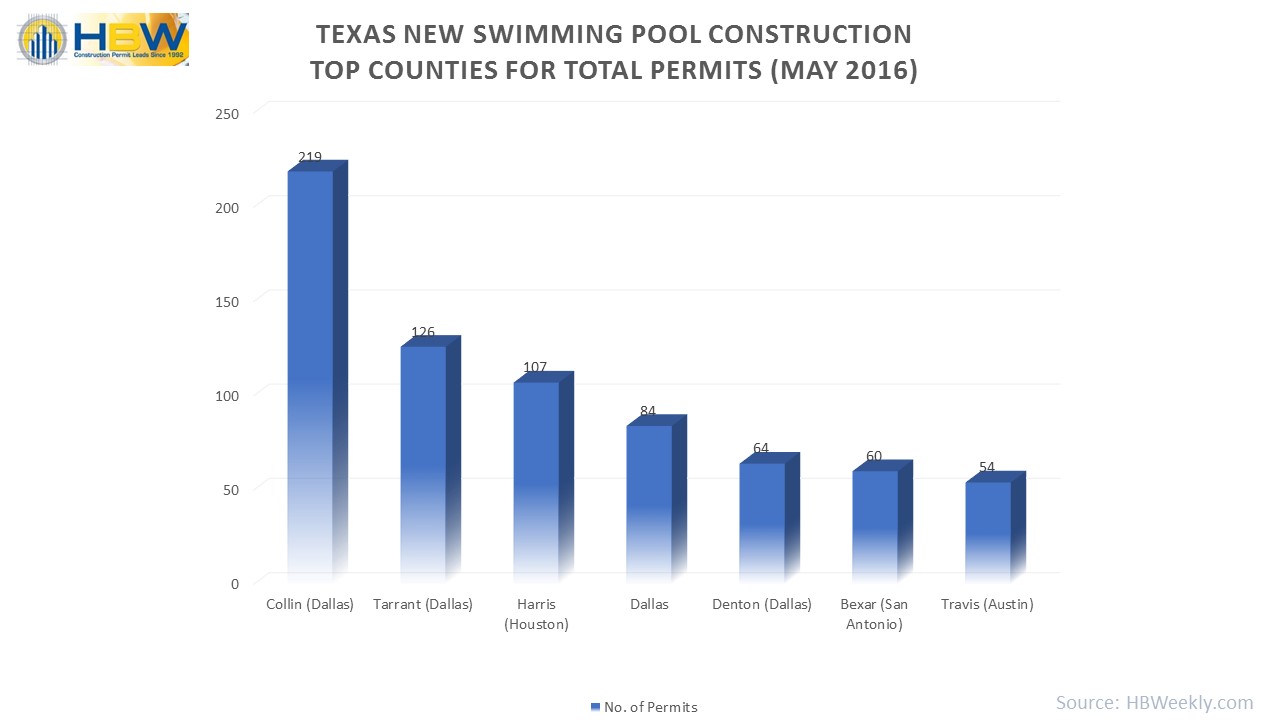
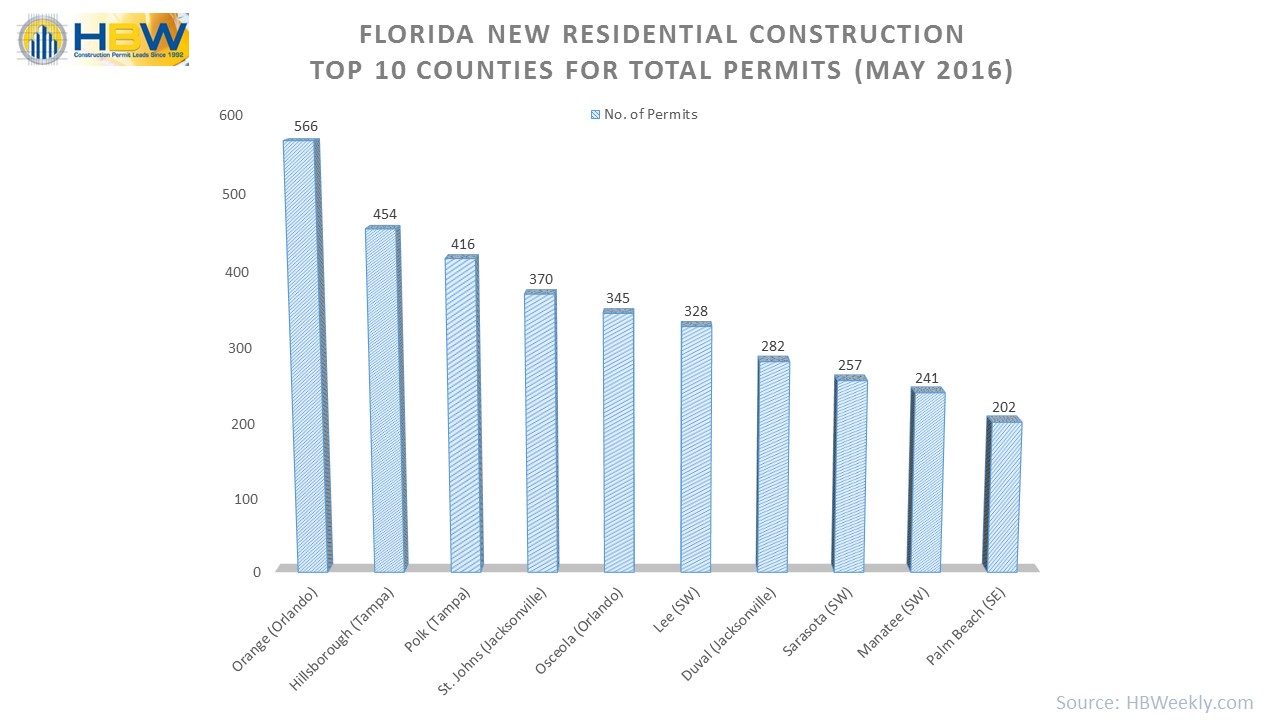
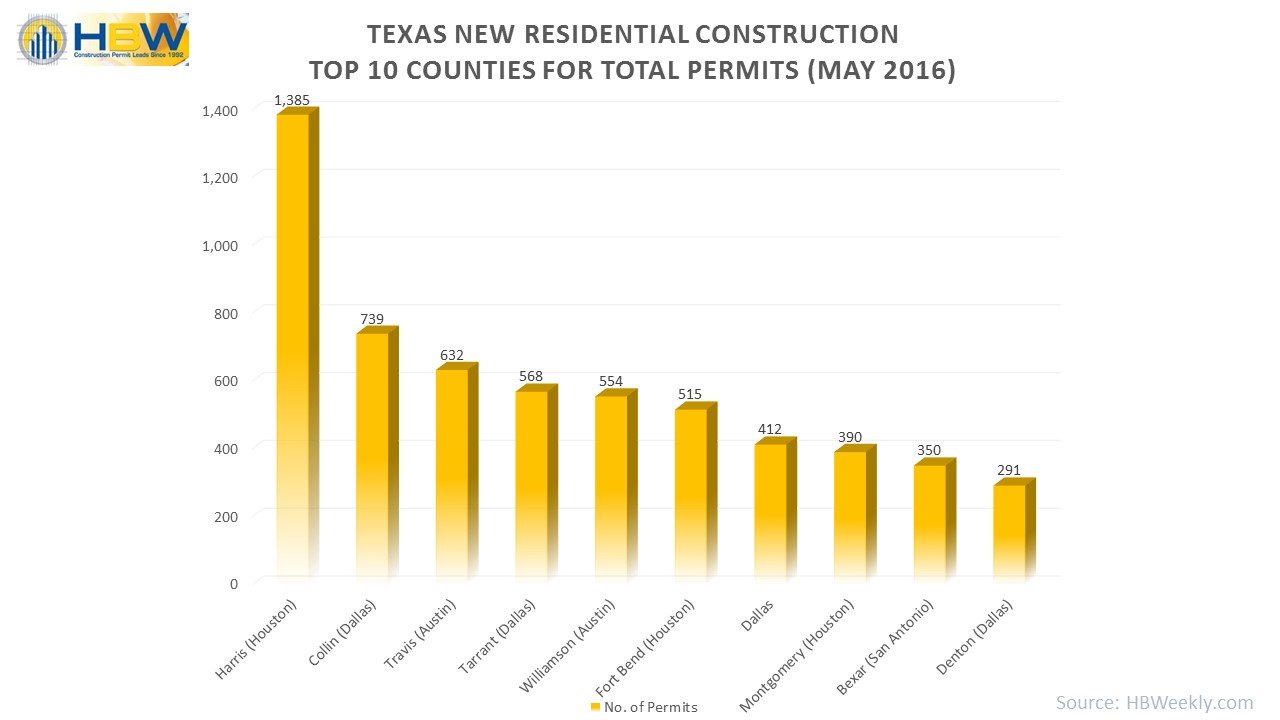
As with every month, we take a closer look at the highs in new residential construction from a county-by-county perspective.  As for the top five counties, not much has changed since May.  Harris County of Houston maintained the top spot with 1,200 housing starts and close to $216.5M in construction. Collin County of Dallas (488 permits) and Travis County of Austin (473 permits) continued to hold steady as second and third highest for housing starts.   Tarrant County of Dallas remained fourth highest for starts with 470 new permits for the month, and Dallas County jumped two spots from May to #5 in June with 392 housing starts.

Top 10 Counties TX - June 2016

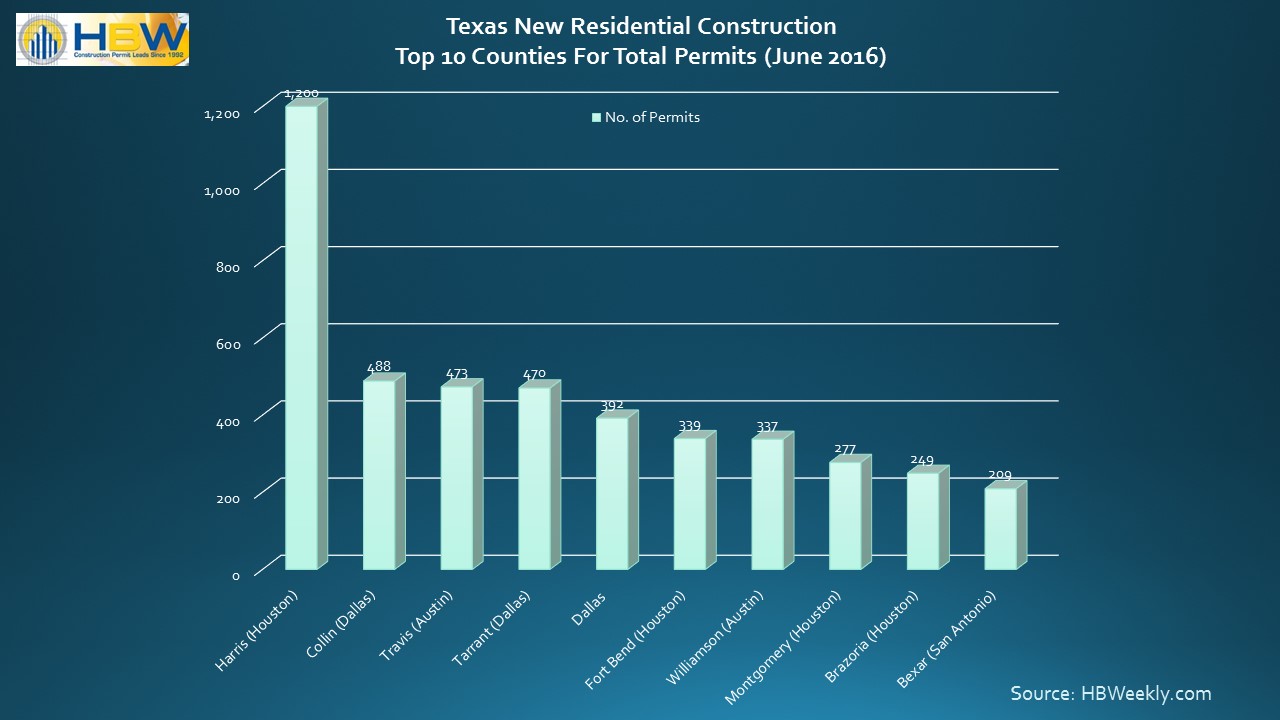
Texas Top 10 Counties for Residential Permits – June 2016

Information utilized for the graphs and above listed figures for Texas residential construction was directly derived from HBW construction data reports. To gain access to the HBW database and receive custom and detailed reports on the latest residential and commercial building activity in Florida, Georgia, Texas, Alabama, and Oklahoma, please contact HBW for details.

Keeping it Clean: Email Marketing

A well-maintained email list is a vital part of any email marketing campaign.

HBW mrkting

No matter the time, money and planning you invest in your email marketing campaigns, they won’t be fruitful if they are not reaching your audience.  For this reason, it is essential to have a strong and valid list of contacts.  Having a well-maintained and “clean” email database enables you to effectively deliver your message while ensuring that your tracking reports are accurate and based on solid and reliable contact information.

Previously, we have explored options for improving your email marketing campaigns.  Now that you are prepped and ready to create the perfect email, we will review basic steps you can take to perfect your email list.

  1. Don’t Skip the “Opt-In” – One of the fastest ways to the spam folder is to make contact without permission. Although your contacts may be interested in what your monthly newsletter or updates have to offer, you will need to get their permission first.  There are a number of ways to gain permission.  From introductory emails, “join” links on your website and options to subscribe in email signatures and social media profiles, permission is merely a one-click step.  When making contact by phone or mailers, offering the option to add them to your email list verbally or through QR codes is also an option.
  2. Keep it Fresh – In addition to fresh content, you must keep your contacts fresh too. Old and stagnant lists lead to old and unengaged contacts. In order for your email list to be current, you must have a source for new contacts and leads to replenish your list and continue to reach new customers.   For HBW subscribers, the HBW database is constantly updated with new contacts, making this step easy.  You can also invite website visitors and social media followers to join your email list with a simple link to expand readership.  Additionally, every email should include the option to “share” or “forward” the message to a friend. For your existing contacts, you will want to make a habit of reviewing them for accuracy.  Typos upon entry such as “gmal.com” instead of “gmail.com” are common and easy to correct.  Often, an invalid email address is a result of a change in staff or a new domain name, so review your bounced and inactive contacts periodically to see where updates can be made.
  3. Contact Now – When adding a new subscriber, don’t wait until your next large email marketing campaign to make contact. Strike while the iron is hot. If short on time, an auto-generated welcome email may suffice, but the more personalized your message the better.  In addition to welcoming your email subscriber, offer them options to personalize their experience. From discounts, new products/services or product specific information, your reader may be interested in just one or all of your email notifications.  The more customized their experience, the more likely they will be to open the next email from your business.
  4. Remove Don’t Delete – Depending on your email marketing platform, this step may have a few variations. The main point is that when you delete a contact from your list, you also delete its history.  For example, if you delete someone who chooses to “unsubscribe”, you delete their choice in not receiving email notifications.  If they are deleted from your list, they could be added at a later date and receive unwanted email, again.  For this reason, keep separate lists for active, inactive, unsubscribed, and bounced email addresses.  By removing them from your primary and active lists while still keeping their data on record, you will properly maintain a history for each contact; such data will prove to be valuable in a re-engagement campaign and other marketing efforts going forward.
  5. Secure It – Getting the correct address from the start is crucial for having a clean email list. Garbage in is garbage out, so consider adding an extra layer of security to your sign-up form.  You can ask subscribers to complete a double opt-in process that has them confirm their subscription and allows them to double-check their contact information.  You can also take it a step further by enabling reCAPTCHA on your signup form to stop spambots from submitting invalid information to your lists.  Various email marketing platforms have this added level of security built-in, so you will want to review and choose the security options that are right for you.

By taking the time to tidy up your list of contacts, you increase the likelihood of reaching your audience, optimizing open and click rates and converting your readers to customers.

For more information on construction business and marketing tips, stay connected with the HBW Blog.  To get ahead of construction activity and gain access to the latest permitting data in Florida, Texas, Georgia, Alabama and Oklahoma, contact HBW for more information on construction data reports and industry leads.

Texas Pool Construction Review – May 2016

From high-end pools throughout the state to Dallas dominating in starts, here are May highlights for Texas swimming pool construction.

TX Pool report HBWeekly

As reported last week, swimming pool construction is Florida was on a high in May.  With the uptick in pool permits in the HBW database, it is an opportune time to shift our review to other areas that are booming in residential and swimming pool construction.  For this reason, we took a glance at HBW’s swimming pool permit reports for Texas.  With more 860 new pool permits and more than $40.5M in construction value, Texas saw its fair share of pool starts in May.

Out of the four major metropolitan areas (Dallas, Houston, Austin, San Antonio), Dallas dominated in total pool starts for the month; more than half of all new pool construction took place in the Dallas area, 542 new permits to be exact.  More than 40% of new pool construction in Dallas took place in Collin County.  Across the state, the counties with the greatest number of pool starts were widespread.  The top two counties were in Dallas – Collin County took the lead with 219 permits and more than $10.4M in construction, and Tarrant County was second highest with 126 permits and nearly $4.1M in total construction value.  Houston’s Harris County was not far behind and in third with 107 pool starts and more than $6.5M in construction value.  Here’s a look at the leading counties for total new permits throughout the state:

Texas Top Counties for New Pool Permits - May 2016

Texas Top Counties for New Pool Permits – May 2016

When looking at the average value of pool construction for the month, Austin and Houston were very close and led for average value (approximately $55k).  Although Dallas reigned in total pool starts, it held the lowest average value in new pool construction ($42,998).

Texas Average Value of Pool Construction - May 2016

Texas Average Value of Pool Construction – May 2016

From the hundreds of pool builders that were active throughout Texas in May, there were some standouts when looking at the average value of construction by builder.  Sandler Pools in Dallas was in the lead for total pool starts with 37 permits and nearly $1.8M on file with HBW for the month, while Classic Constructors of Austin took the top spot for average value of construction ($200k).  In San Antonio, CF Jordan Construction was second highest in the state with an average value of $189K.  Here is a look at higher-end Texas pool builders with average values greater than $125K:

TX Pool Builders with Average Construction Value  > $125K - May 2016

TX Pool Builders with Average Construction Value > $125K – May 2016

Information utilized for the graphs and above listed figures for Texas swimming pool construction was directly derived from HBW construction data reports. To gain access to the HBW database and receive custom and detailed reports on the latest residential and commercial building activity in Florida, Georgia, Texas, Alabama, and Oklahoma, please contact HBW for details.

Is it Time for a Marketing Makeover?

Now that you have the leads, it is important to make contact with updated marketing materials.

mrktng image bgstock

Busy home builders do not always have the time or the staff to constantly maintain marketing efforts.  Often, brochures can be in need of revisions and flyers can be outdated.  With the popularity of social media, it is easy to lose sight of basic marketing materials and miss out on other opportunities to connect with future clients.

Consider the “Rule of Three” which can be applied to so many different points of marketing.  When developing marketing tactics, three can be the key number in gaining attention of your prospects, without overwhelming them.  From three key services to three primary touchpoints, it is important to diversify your approach and marketing materials so that viewers and readers connect to the services you offer and want to learn more.

As HBW subscribers already know, thousands of new leads are added to the database each month.  With Florida experiencing a high for pool building last month and new residential and commercial permits available each day, it is imperative that you have marketing “literature” prepped and ready for distribution.

Before you grab a brochure and head to the printer, take a few moments to review your materials:

  1. Take Inventory – Before you can begin developing new marketing materials, you must account for what you may already have in stock. Even if you are not currently using certain promotional materials in your marketing efforts, it will benefit you to do a little “digging” to find all pieces that have represented your company and brand.
  2. Update – Along with appealing to today’s aesthetics, you will want to make sure all brochures, postcards, flyers, etc. bare the correct contact information, logo and services. So often, companies will hold on to old material after they have eliminated a particular service or moved to another location; this is not advisable.  Keep a copy or two for archives and print new materials that are updated and accurate.
  3. Stick with Your Brand – Your company may have taken on many faces over the years. Perhaps you have altered your logo or your name; maybe you have adopted a new style to create an eye-catching website.  Although it is healthy for a business to evolve over time, you will want all current marketing materials to reflect your business brand, colors and image of today.  This is not to say that the content and images should be the same across the board; rather, you should diversify your materials while being consistent with your brand and appearing to come from the same “family”.
  4. Know Your Purpose – Marketing materials should be developed for a specific purpose. Perhaps you want to produce postcards to reach out to your HBW leads who are just embarking on a new home build or a company that just broke ground.  Whatever the reason, be focused and clear on your audience and message. Don’t create a tri-fold brochure or expensive glossy folders if you do not have plans to use them in your introductions, mailings or meetings.  Think carefully about the medium that best reaches your target audience and develop it.
  5. Use Them – Don’t create materials that you will not use or for the mere purpose of having them on hand. You don’t want a box of brochures sitting in storage and collecting dust. Your company’s promotional pieces are only effective when distributed.  Once you have defined your purpose(s), determine the best time and method for distribution.  If you don’t already have one in place, a distribution schedule can be effective in ensuring the right materials get to the right audience at the right time. Having a solid contact management system in place will allow you to track your efforts and perform proper follow-up.

Once you have taken inventory of your marketing materials and defined your purpose, you will be ready to fine-tune and develop pieces that fit your marketing strategy.  By focusing on content that appeals to your target audience and represents your brand, you will have tools that can catch the eyes and interests of your future clients.

For more information on construction business and marketing tips, stay connected with the HBW Blog.  To get ahead of construction activity and gain access to the latest permitting data in Florida, Texas, Georgia, Alabama and Oklahoma, contact HBW for more information on construction data reports and industry leads.

Florida Swimming Pool Construction on an Upswing in May

With close to 2,000 swimming pool starts, new pool construction was up in Florida last month.

HBW pool report FL

The month of May proved to be the best month for new swimming pool construction in Florida since the start of the year.  Nearly 2,000 new pool permits and more than $80M in construction value were added to the HBW database last month.  In addition to May having the highest total number of Florida pool permits since the start of the year, new swimming pool construction was up 20% since April.

Throughout the state, and out of five regions (SW, SE, Jacksonville, Tampa, Orlando), every area experienced an increase in swimming pool starts since April.  The southwest region of the state had the greatest number of total permits on file in May with 532 pool starts and more than $22.4M in construction value.  The bulk of pool construction activity in the southwest took place in Lee and Manatee counties.  The southeast portion of the state was second highest with 446 new swimming pool permits and more than $21.2M in construction.  While the southeast counties of Palm Beach and Miami-Dade were highest in the area and very close for total permits (140 and 143 permits), Miami-Dade held the highest total value in construction (> $8.6M). By region, Orlando was third highest with 407 pool starts and nearly $15.6M in construction value.  Orlando’s Orange County was highest for total pool starts holding 20% of new activity in Central Florida.

FL Pool Permits by Area - May 2016

FL Pool Permits by Area – May 2016

When taking a look at the average value of construction, there was a shift since April.  While the southeast continued to rank #1 for average value, Jacksonville dropped from second to fifth in one month.  Southeast Florida held the highest average value of $47,624.  Southwest Florida was second highest with an average value of $42,210, and Tampa was third with an average value of $40,213.

FL Pool Construction Average Value - May 2016

FL Pool Construction Average Value – May 2016

As we take a look at the most active counties throughout the Sunshine State, the top five counties were tight and very close in total permits.  Hillsborough County of Tampa was highest for total new permits with 147 pool starts and more than $7.4M in total construction value; nearly half of Tampa’s new swimming pool construction activity took place in Hillsborough last month. On the heels of Hillsborough, Lee County (SW) was second highest with 144 new permits and close to $6.2M in construction value. While third highest for total pool starts (143 permits), Miami-Dade (SE) took the top spot for total value of construction with more than $8.6M in new permits for the month.  Palm Beach (SE) and Orange (Orlando) counties ranked fourth and fifth highest for new permits on file with 140 and 137 pool starts.

FL Top 10 Counties for Total Pool Permits - May 2016

FL Top 10 Counties for Total Pool Permits – May 2016

Information utilized for the graphs and above listed figures for Florida swimming pool construction was directly derived from HBW construction data reports. To gain access to the HBW database and receive custom and detailed reports on the latest residential and commercial building activity in Florida, Georgia, Texas, Alabama, and Oklahoma, please contact HBW for details.

Is Seasonal Marketing Right for Your Business?

By focusing on products and services that are most useful in hot summer or cold winter months, you may appeal to customers’ needs at the perfect time of year.

seasonal hbw

As HBW subscribers already know, new and fresh content is important when reaching out to prospects and leads.  Along with utilizing the HBW archives to inform contacts of upgrades or maintenance services that may be necessary, seasonal campaigns may also be useful in highlighting services that are most relevant to specific weather and seasonal conditions.

In a nutshell, seasonal marketing is used for calling attention to specific products or services that are of most interest during a particular time of year.  For example, pool builders may use seasonal marketing to push new pool installations just before summer, and products like insulation or windows may be emphasized prior to winter or summer to help regulate indoor temperature in warmer or colder months.

In addition to focusing on specialized products or services, your company may also use seasonal marketing for general communications.  The holidays are a great time to run gift-giving specials, and the end of the school year is an opportune time to prepare for children staying home in the summer or offering gift packages for new graduates.

Whatever angle you choose, seasonal marketing is an easy way to cater to your leads’ interests at any given time of year.  It is also valuable in appealing to your customers’ needs and opening a door for communication on something that is relatable to most everyone.  If seasonal marketing is something you currently have incorporated into your marketing strategy, or you are curious to see how it may be effective for your business, here are a few quick tips to get started:

  1. Plan Ahead – Timing is everything. If offering a gift package for the holidays, you will be too late by starting in December.  Schedule your seasonal marketing efforts well in advance.  Just as you would with any marketing campaign, plan ahead and schedule communications to be distributed in the months leading up to a given season.  For example, your summer campaign should begin to buzz in Spring.  Planning ahead for summer heat or events allows ample time for customers to consider your services and assess their potential need.
  2. Be Consistent – When launching a seasonal marketing campaign, you should be consistent in all of your touchpoints and marketing materials. Just one post on Facebook or a blurb in your newsletter is not enough.  Where and when relevant, your seasonal appeal should be evident and accessible throughout your mailers, website, social media profiles and email communications.
  3. Customize – Not all seasonal services will be pertinent to all leads and clients. For new HBW leads, use the permit data reports to identify which services are most appropriate for their home or commercial building.  On social media and your website, use analytics to better understand where your site visitors are located to determine their needs.  With your current clients, review their accounts to find matching and seasonally appropriate products or services that can benefit them.

Seasonal marketing isn’t about having snowmen on your newsletter in December and beach scenes in June.  Although images are useful, seasonal marketing is much more than recognizing a change in the weather or major holidays… It’s about offering services that can help prospects and customers when they need it most.  Along with being a great way to package products and services, seasonal marketing opens the doors to new conversations, and new business.

For more information on construction business and marketing tips, stay connected with the HBW Blog.  To get ahead of construction activity and gain access to the latest permitting data in Florida, Texas, Georgia, Alabama and Oklahoma, contact HBW for more information on construction data reports and industry leads.

HBW Report – Growth in Florida Residential Permits in May

More than 5,100 permits are on record with HBW for Florida housing starts in May, a 35% increase in comparison to April.

fl hbw report no txt

Along with Orlando continuing to hold the #1 spot for total housing starts in May, every major area of Florida, from Jacksonville to Miami, experienced growth in new residential construction permits since April.  The HBW database has 5,158 new residential construction leads on file for May which is a 35% increase in permitting activity in comparison to April.  Out of the close to $1.5B in total construction across the state, Orlando had the most total starts for the month (1,384 permits), and the southeast region experienced the greatest growth in housing starts since April with a colossal 91% increase in permits on file.  Southeastern Florida also held the highest average value for housing starts in May (average value: $329,736).

Florida New Residential Construction Permits - May 2016

Florida New Residential Construction Permits – May 2016


FL Average Value of Residential Construction - May 2016

FL Average Value of Residential Construction – May 2016

In Orlando, the area saw a 34% increase in total permits since April and had approximately $408.5M in new residential construction for the month.  The bulk of activity in and around Orlando continued to take place in Orange and Osceola counties.  As previously mentioned, the southeast region saw the most growth in total permits for the month (up 91%) with 704 housing starts and more than $232M in total value.  Jacksonville was third highest for growth with a 45% increase in housing starts (967 permits) on file with HBW and nearly $233M in construction value.  Southwest Florida and Tampa came in at second and third highest for total permits with 1090 and 1013 housing starts for the month.

When breaking the latest permit data reports down by counties, there was major growth evident in every one of the top ten counties for total housing starts.  Although there was some shifting in the top spots, all counties had more new residential construction permits on file in comparison to April, with Orange County (Orlando) continuing to lead.  Orange County experienced a 65% increase in housing starts since April with 566 new residential construction permits and approximately $191M in total construction for the month.  Also maintaining its position in the top ten list, Hillsborough County (Tampa) held on to #2 with a 42% increase in new permits since April having 454 housing starts and close to $154.5M in construction value.  Polk County (Tampa) took a mammoth leap from #10 in April to #3 in May as it more than doubled in total housing starts.  Polk County had 416 starts last month and approximately $76M in construction value.

FL Top 10 Counties for Total Permits - May 2016

FL Top 10 Counties for Total Permits – May 2016

Information utilized for the graphs and above listed figures for Florida residential construction was directly derived from HBW construction data reports. To gain access to the HBW database and receive custom and detailed reports on the latest residential and commercial building activity in Florida, Georgia, Texas, Alabama, and Oklahoma, please contact HBW for details.

Texas Home Builders Spotlight – May 2016

TX report

This week, our eye has been on Texas.  With nearly 7,000 new permits on file with HBW for the month of May, it has been an active period for new residential construction in the Lone Star state.  As reported in the Texas Home Building Report earlier this week, the HBW database experienced a 37% increase in new residential construction permits between April and May.  As one may expect, the companies behind the new construction have also experienced increases in housing starts, some as high as 72%.

The top three home builders for housing starts in May remain the same as April.  Even though they are holding the same positions in leading new residential construction, they certainly experienced an increase in new projects over the month.  Here’s a look at the top three home builders from permitting reports reviewed from Dallas, Houston, Austin and San Antonio:

#1 – D.R. Horton – D.R. Horton has held the #1 spot for total permits on file every month since the beginning of the year.  In May, there were 72% more housing starts on file throughout Texas for D.R. Horton in comparison to April.  With 794 new residential construction permits in May, it is no surprise that this builder has a strong hold on new home construction in Texas.

#2 – Pulte Homes – Holding in the second highest spot since April, Pulte Homes had 356 housing starts on file for the month of May.  Pulte Homes also experienced an increase in starts on file with a 29% surge in total permits since April.

#3 – Lennar Homes – Continuing to be side-by-side and close to Pulte Homes each month for total new permits, Lennar Homes was third highest for housing starts; in May, the home builder had 347 starts which is approximately a 28% increase in total permits in comparison to April.

Focusing in and taking a more detailed look at home builders in each given metro area, we notice that there are clearly a few other home builders worth recognition.  Although D.R. Horton has held the most statewide housing starts in May, Continental Homes of Texas took the lead in San Antonio, and Lennar Homes had the most permits on file for the month in Houston.  Here is a look at the top five home builders for housing starts last month:

Dallas

There is no shortage of new construction data for Dallas in the HBW database.  With more than 2,250 housing starts and nearly 275 active builders on file for the month, the area continues to offer great opportunity for home builders.  The top three builders from April continued their lead in May, while also experiencing increases in total starts. D.R. Horton held the top spot with 238 housing starts (up 23% since April) and nearly $52.5M in total construction value.  Pulte Homes continued to be the second highest for total new permits with 155 housing starts (37% increase since April) and more than $26.7M in construction value.  In at #3, First Texas Homes had a 35% increase in starts on file since April with 87 new residential construction permits and a total value in excess of $32.7M.

Dallas Top Builders for Total Permits - May 2016

Dallas Top 5 Home Builders Total Permits – May 2016

Houston

Out of the nearly 320 active builders in Houston for the month, Lennar Homes jumped up from second to the lead with a 20% increase in activity.  Lennar Homes had 196 housing starts with a total value of nearly $31.2M for the month.  Close and following, D.R. Horton dropped one spot to second in May with 149 housing starts in the area and close to $21.2M in construction.  Not far behind and with a 45% increase in new permits since April, K. Hovnanian Homes jumped up one spot to third with 127 housing starts and more than $23M in value.

Houston Top 5 Home Builders Total Permits - May 2016

Houston Top 5 Home Builders Total Permits – May 2016

Austin

In Austin, the top three builders from April maintained their lead for May.  D.R. Horton held strong at #1 in Austin with a massive increase in new permits with 375 housing starts and more than $62M in construction.  KB Homes also held steady with 107 housing starts and close to $19M in construction value.  Following close and stable at third highest, Pulte Homes had 81 housing starts (10% increase since April) and close to $18.2M in total value on file for May.

Austin Top 5 Builders Total Permits - May 2016

Austin Top 5 Builders Total Permits – May 2016

San Antonio

In San Antonio, Continental Homes of Texas held onto the top spot with a 12% increase in activity since April.  Continental Homes had 93 housing starts on file for May with a total construction value of nearly $18.7M.  KB Homes maintained its place at #2 with 57 new residential construction permits and close to $12.5M in value.  Following close to KB Homes, RSI Communities which was not on the top five list in April joined in at #3 in May with 41 housing starts and more than $4.5M in total value.

San Antonio Top 5 Home Builders Total Permits - May 2016

San Antonio Top 5 Home Builders Total Permits – May 2016

Information utilized for the graphs and above listed figures for Texas residential construction was directly derived from HBW construction data reports. To gain access to the HBW database and receive custom and detailed reports on the latest residential and commercial building activity in Florida, Georgia, Texas, Alabama, and Oklahoma, please contact HBW for details.

Texas Home Building Report – May 2016

With a 37% spike in residential construction permits since April, the HBW database is brimming with new construction data in Texas.

hbw REPORT TX

There is no shortage of news on the real estate market and home building in Texas.  Just take a look at the latest report from Redfin – Dallas and Austin were recently listed as two of the “hottest housing markets” of 2016.  The term “hot market” refers to how likely homes in that area will sell within two weeks.  Dallas was listed as having 57.1% of homes selling within two weeks, and Austin was stated to have 52.6% of homes as “hot homes”.

When reviewing the latest news regarding home building in Texas, the population of the “Texas Triangle” (Austin, Dallas-Fort Worth, Houston and San Antonio) has jumped 41% over the past 15 years  (source: Lawnstarter), and to meet that demand more than 1.3M building permits were issued for single-family homes between 2000 and 2015.

When accessing the latest HBW reports on home building in the “Texas Triangle” for May, there was a marked increase in residential construction permits in comparison to April… a 37% increase to be exact.  During the month of May, there were nearly 7,000 housing starts in the four metro areas listed above and nearly $1.7B in total construction value.

TX New Residential Construction Permits - May 2016

TX New Residential Construction Permits – May 2016

Across all major metro areas reviewed, there were significant increases in residential construction activity.  Houston led in housing starts (2,591 permits), while Dallas was #1 for highest average value of construction ($303,259).  Houston had an approximate increase of 28% in new residential construction since April, and Harris County held more than half of the new Houston area permits on file.  Dallas also experienced growth for the month with more than a 32% increase since April and 2,257 housing starts for May.  Out of the four major metro areas, Dallas held the highest total construction value for the month with more than $684M in value; the Dallas counties of Collin, Tarrant and Dallas led the area and held the bulk of new residential construction permits for the month. Although third and fourth for total permits, Austin (1,396 permits) and San Antonio (732 permits) experienced the greatest spikes since April with Austin up 54% and San Antonio up more than 65% in monthly housing starts.

TX Average Value Residential Construction - May 2016

TX Average Value Residential Construction – May 2016

From a county perspective, four of the top ten counties for total new residential permits are in Dallas.  Harris County in Houston continued to be the lead county as it had nearly $286M in new residential construction and a whopping 1,385 housing starts last month. Collin County in Dallas jumped up two spots (in comparison to April) and was second highest with 739 housing starts and more than $263M in construction value.  Although Travis County in Austin dropped one spot to third since April, it still had an 11% increase in new permits with 632 housing starts and more than $132M in total construction value for May.

TX Top 10 Counties for Permits - May 2016

TX Top 10 Counties for Permits – May 2016

Information utilized for the graphs and above listed figures for Texas residential construction was directly derived from HBW construction data reports. To gain access to the HBW database and receive custom and detailed reports on the latest residential and commercial building activity in Florida, Georgia, Texas, Alabama, and Oklahoma, please contact HBW for details.

Financial Incentives for Green Construction

With the demand for solar and energy-efficient home features growing, home builders can offer valuable resources for consumers to reap financial rewards for going green.

gdr

Going green is more than just a preference; in many ways it is a necessity.  With our ever-changing environment, growing population and depleting resources, energy-efficiency is increasingly more important to consumers and home builders.

In NAHB’s latest home buyer preference survey (source: NAHB Eye On Housing), it was apparent that home buyers still look for green features in homes and are willing to pay more up front to save on utility and other expenses on the back-end.  In addition to insulation that is above-code, Energy Star® appliances, Energy Star® whole home rating and Energy Star® windows were in the top ten of most popular home features to be considered essential or desirable. When it comes to investment, the median amount of buyers would pay more up front if the ROI is 20%.  The average rate of return needed has fluctuated over the years and came in at 9.3% in 2015.

Although many home buyers are willing to pay more to go green, they would also welcome ways to reduce the various expenses associated with energy-efficient construction.  Along with local programs that may be available through utility providers, there are a multitude of programs and grants of which many builders and consumers are unaware.  Here is just a sample of some of the rebate and credit incentives for energy-efficient home construction and design:

Solar

DOE’s SunShot Initiative – Along with permitting, there are a number of added costs associated with solar installation that the U.S. Department of Energy (DOE) says may add up to $2,500 to the overall cost of going solar (source: gosparc.org).  For this reason, DOE launched the SolSmart program to make solar more attainable for home owners.  Cities and communities must be nominated for the SolSmart designation.  Visit the SolSmart program website to learn more and nominate your community.

Energy-Efficient Homes

Tax Credit for Home Builders

Incentive Amount: $1,000-$2,000 (depends on energy savings and home type)

Expiration: December 31, 2016

Yes, you read that correctly.  This incentive is for home builders.  Site-built homes qualify for the credit if they are certified to reduce cooling and heating energy consumption by 50% relative to the IECC 2006 and meet minimum efficiency standards established by the DOE.

Residential Energy Efficiency Tax Credit

Expiration: December 31, 2016

Although the current tax credit available is a maximum of $500 for all improvements made in 2011-2016, it is a benefit worth sharing with clients looking to upgrade with the purchase of high-efficiency heating, cooling and water-heating equipment.  To be eligible, the improvement must meet the prescriptive requirements established for it under the 2009 Energy Conservation Code.

Regional

Orlando Utilities Commission – Residential Energy Efficiency Rebate Program

This program for Orlando Utility customers offers rebates on various energy efficient improvements for residential clients.  Incentives include but are not limited to: window film or solar screens ($1/sq.ft.); Energy Star® Windows ($2/sq.ft.); Energy Star® Heat Pump Water Heaters (100% of cost up to $650); heat pumps ($20-$1,275/unit); ceiling insulation upgrades ($0.05/sq.ft.) and more.  To receive the rebate, a proof of purchase and application must be mailed to OU Customer Connection.

Texas Renewable Energy Systems Property Tax Exemption

The Texas property tax code allows 100% exemption of the appraised property value increase arising from the installation or construction of solar or wind-powered devices.  The system must be used primarily for onsite energy needs. Those wishing to claim exemption must fill out Form 50-123 “Exemption Application for Solar or Wind-powered Energy Devices”.

No matter how small, clients will appreciate you offering resources and ways to fund new green building projects and renovations.  To find incentives that are right for you, your projects and clients, visit DSIRE.

For more information on construction business tips and industry updates, stay connected with the HBW Blog.  To get ahead of construction activity and gain access to the latest permitting data in Florida, Texas, Georgia, Alabama and Oklahoma, contact HBW for more information on construction data reports and industry leads.