
With close to 2,000 swimming pool starts, new pool construction was up in Florida last month.

The month of May proved to be the best month for new swimming pool construction in Florida since the start of the year. Nearly 2,000 new pool permits and more than $80M in construction value were added to the HBW database last month. In addition to May having the highest total number of Florida pool permits since the start of the year, new swimming pool construction was up 20% since April.
Throughout the state, and out of five regions (SW, SE, Jacksonville, Tampa, Orlando), every area experienced an increase in swimming pool starts since April. The southwest region of the state had the greatest number of total permits on file in May with 532 pool starts and more than $22.4M in construction value. The bulk of pool construction activity in the southwest took place in Lee and Manatee counties. The southeast portion of the state was second highest with 446 new swimming pool permits and more than $21.2M in construction. While the southeast counties of Palm Beach and Miami-Dade were highest in the area and very close for total permits (140 and 143 permits), Miami-Dade held the highest total value in construction (> $8.6M). By region, Orlando was third highest with 407 pool starts and nearly $15.6M in construction value. Orlando’s Orange County was highest for total pool starts holding 20% of new activity in Central Florida.
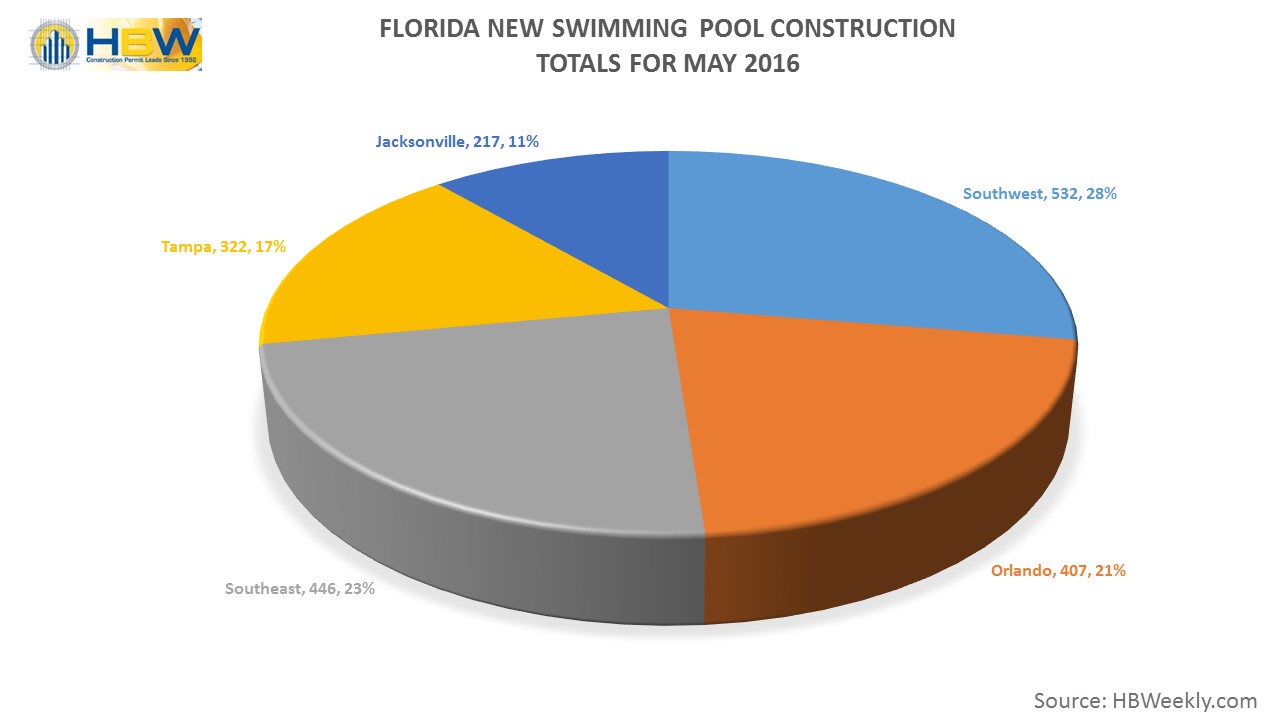
FL Pool Permits by Area – May 2016
When taking a look at the average value of construction, there was a shift since April. While the southeast continued to rank #1 for average value, Jacksonville dropped from second to fifth in one month. Southeast Florida held the highest average value of $47,624. Southwest Florida was second highest with an average value of $42,210, and Tampa was third with an average value of $40,213.
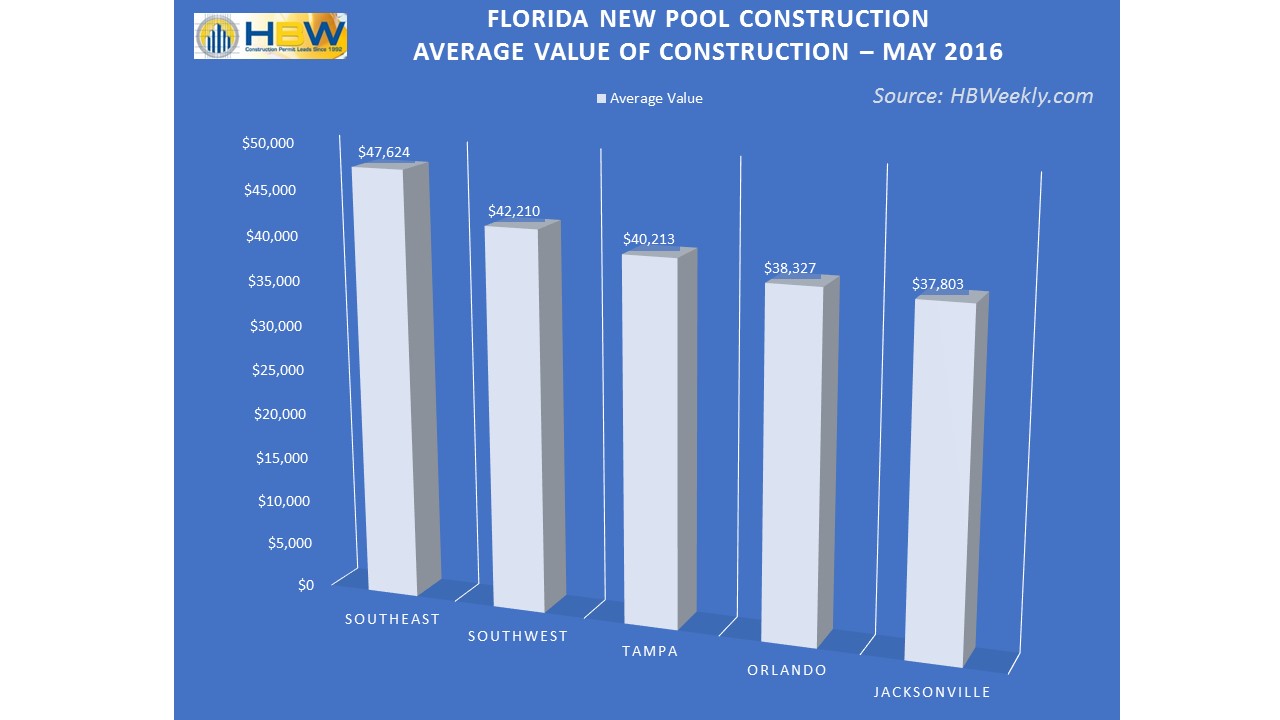
FL Pool Construction Average Value – May 2016
As we take a look at the most active counties throughout the Sunshine State, the top five counties were tight and very close in total permits. Hillsborough County of Tampa was highest for total new permits with 147 pool starts and more than $7.4M in total construction value; nearly half of Tampa’s new swimming pool construction activity took place in Hillsborough last month. On the heels of Hillsborough, Lee County (SW) was second highest with 144 new permits and close to $6.2M in construction value. While third highest for total pool starts (143 permits), Miami-Dade (SE) took the top spot for total value of construction with more than $8.6M in new permits for the month. Palm Beach (SE) and Orange (Orlando) counties ranked fourth and fifth highest for new permits on file with 140 and 137 pool starts.
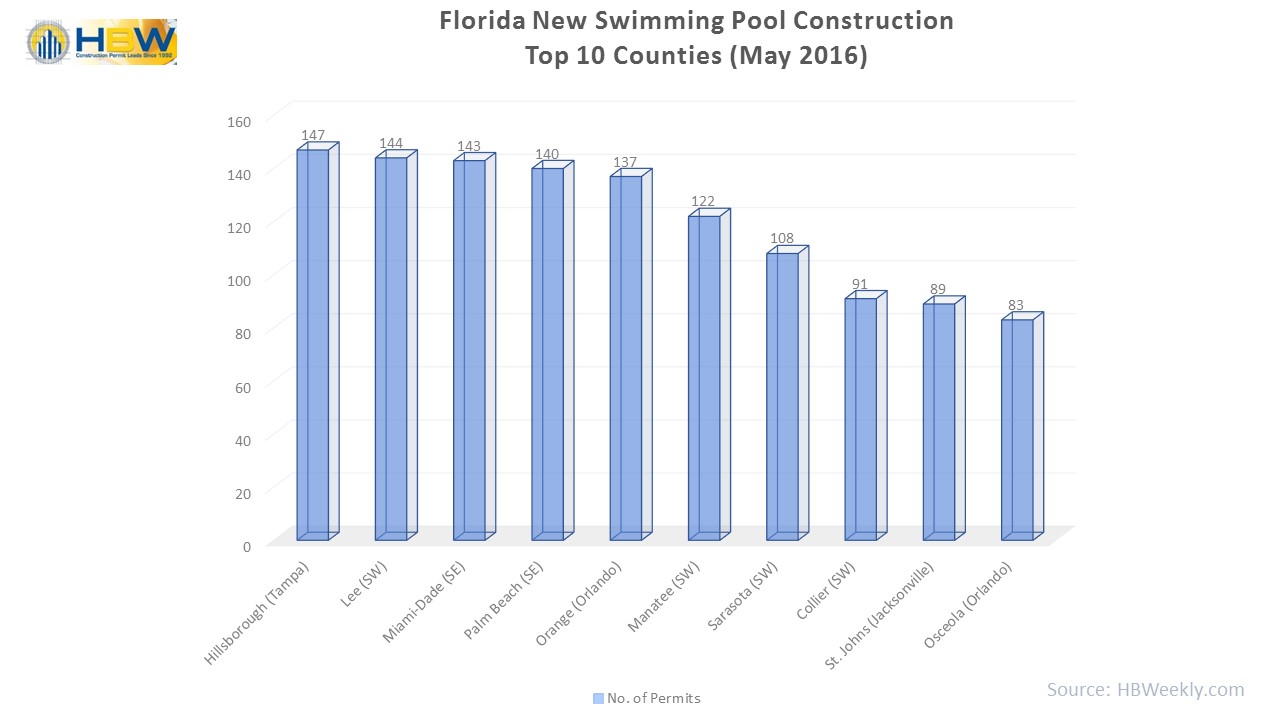
FL Top 10 Counties for Total Pool Permits – May 2016
Information utilized for the graphs and above listed figures for Florida swimming pool construction was directly derived from HBW construction data reports. To gain access to the HBW database and receive custom and detailed reports on the latest residential and commercial building activity in Florida, Georgia, Texas, Alabama, and Oklahoma, please contact HBW for details.