Consumer Trend Watch: Wallpaper

Believe it or not, wallpaper is back, and it is making an appearance in a new, bold and trendsetting way.

Trend watch HBWeekly.com

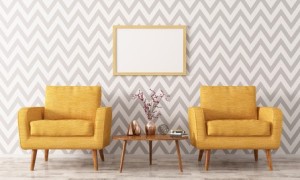
Don’t be surprised if your clients express an interest in wallpaper.  Wallpaper has been buzzing on the consumer’s home décor scene, and we are not talking about outdated florals you may remember in grandma’s house of yesteryear.  No, this wallpaper is making a statement and showing up in designer’s illustrations and mainstream publications.  Vogue Magazine listed texture and wallpaper as a home decorating trend to watch in 2017, and Houstonia Magazine also recognized wallpaper as a trend expected to rise in 2017, noting artist-inspired wallpaper and wallpaper for texture on their list.

So, how is wallpaper new and improved?  Well, for starters, new advances brought about by digital printing have made it possible for wallpaper designers to create fresh new designs that were not previously possible with handprinted versions.  Having an array of bold and modern designs make it more appealing to the client who is looking to achieve an original and custom look.  Additionally, the wallpaper of today is easier to apply (think “peel and stick”) and less labor intensive than the previous varieties.  Say goodbye to the hours dedicated to application and painstaking efforts for removal.

As for designs, Realtor.com recently highlighted six awe-inspiring designs that ran the spectrum from ornate to classic.  From metallic and silk to embossed and embellished, there seems to be something for every palate. And how it’s being used is another thing… not every wall is covered, and not every room is the same.  Complementary designs can be mixed between bold solids and modern geometric patterns.  Placement can range from an entire room to accent walls or framed sections on adjacent walls.

Homeowners who are interested in adding a “wow” factor without breaking the bank for stone or expensive textiles are finding that wallpaper is an easy and affordable way to give their homes that “je ne sais quoi”.  Also, as noted in our post covering popular industry predictions for 2017, home design trends are expected to move from industrial and stark to warm and cozy, and wallpaper has a unique way of warming up a space.  In the same way that it can make a room cozy, wallpaper can add space too; vertical lines can give the appearance of height to spaces with lower ceilings, and horizontal lines can tease the eye into seeing a more spacious and wider room.

So why should you, the home builder, want to know about design trends?  Well, it’s simple.  Knowing your clients and understanding their vision is one thing, but being able to make their vision a reality is another.  By staying in touch with buzzworthy content that may be in their news feed and demonstrating your expertise in the latest construction techniques and designs will allow you to broaden your offerings; as you keep your knowledge base current and on the cutting-edge of industry technologies and methods, you can create current and customized proposals that will standout from your competition.

For more information on construction business tips and industry trends, stay connected with the HBW Blog.  To get ahead of construction activity and gain access to the latest permitting data in Florida, Texas, Georgia, Alabama and Oklahoma, contact HBW for more information on construction data reports and industry leads.

HBW’s 2016 Swimming Pool Construction Roundup

With more than 32,500 new swimming pool permits from Florida, Texas and the Atlanta area combined, it would seem that 2016 was the year of the swimming pool.

hbw pool report

In 2016, swimming pool construction was on a high in Florida and Atlanta in comparison to 2015.  Texas also saw its fair share of pool construction; while Texas experienced a minor 1% dip in permits, there were more than 7,700 pool starts for the year, with Dallas and San Antonio experiencing a boost of approximately 5% since 2015.

Dallas led for total new swimming pool permits with more than 4,150 pool starts for the year, reflecting a 4% year-over-year increase.  San Antonio was also up with a 5% year-over-year increase, resulting in 615 swimming pool starts.

Texas Swimming Pool Permit Totals by Area - 2015 vs. 2016

Texas Swimming Pool Permit Totals by Area – 2015 vs. 2016

From a countywide perspective, Denton County (Dallas) made its mark with a 42.5% year-over-year increase, while a few other counties stood out for total starts:

County Total Permits (2016)
Collin (Dallas) 1,334
Harris (Houston) 1,334
Tarrant (Dallas) 961


Florida

When most of us think of Florida, sunny beaches and, of course, swimming pools come to mind.  Along with the expanding population and growing residential communities, swimming pool construction just keeps getting better and better in the Sunshine State.  While up 7% last year (22,820 permits) in comparison to 2015, new swimming pools have been on the rise since 2011.

FL Pool Permits 2011-2016

FL Swimming Pool Permits 2011-2016

In 2016, the greatest amount of growth could be found in the northeastern portion of Florida, as it experienced an 18% year-over-year increase in new pool permit activity.  In the northeast, more than half of all permits originated from St. Johns and Duval Counties.  Both counties had a significant increase in pool starts, ranging from 14%-19%.

While the northeast led in growth, the southwest region held the lead for total pool starts with more than 6,100 swimming pool permits last year, a 2% increase since 2015.  Here’s a closer look at the breakdown of total swimming pool starts and annual growth in new pool construction over the past year:

FL Swimming Pool Permit Totals by Region - 2015 vs. 2016

FL Swimming Pool Permit Totals by Region – 2015 vs. 2016

FL Top 5 Counties for Pool Permits 2016

FL Top 5 Counties for Pool Permits 2016

Atlanta

Moving north to the metro Atlanta area, we find the greatest annual increase in swimming pool construction.  With a 17% year-over-year increase, the Atlanta area had its best year on record for five years.  Out of the nearly 2,000 new pool permits on file with HBW in 2016, Fulton County came out on top with more than 350 pool permits, a 5% increase since 2015.  Cobb County was also up for the year with a 35% increase in new pool construction and nearly 270 new permits.  Running in third highest for total permits, Cherokee County had a 22% year-over-year spike in pool starts resulting in close to 180 permits for the year.

Atlanta Top 5 Counties for Total Pool Permits - 2015 vs. 2016

Atlanta Top 5 Counties for Total Pool Permits – 2015 vs. 2016

Want more details on permit data for new pool construction and builders in Texas, Florida and Georgia? You can gain access to the HBW database and receive custom and detailed reports on the latest residential and commercial building activity available by contacting HBW for details.

Florida Housing Starts Hit a High in 2016

Last year, Florida experienced a 13% year-over-year increase in housing starts, resulting in more than 64,000 residential construction permits on file with HBW.

FL Residential Construction Permits 2011-2016

FL Residential Construction Permits 2011-2016

Across the Sunshine State, new residential construction was booming in 2016, making it the best year for total housing starts in more than five years.  Every region experienced an increase in housing starts in comparison to 2015, and Central Florida led with a 10% year-over-year increase and nearly 13,600 permits on file for the year.  In Central Florida, Orange County continued to shine as a hot place for new residential construction with more than 5,900 housing starts in 2016, the greatest number of starts for any county across the state.

West Florida was also flourishing last year as there were nearly 13,000 housing starts in the region, a 16% increase since 2015.  The western county of Hillsborough (Tampa) was on top and ranked second statewide in comparison to other major counties as it experienced a 20% year-over-year increase in residential construction, resulting in nearly 4,500 housing starts.

Although ranked fourth for total starts on file for the year, Northeast Florida exhibited the greatest percentage of growth over the year.  In the northeast region, there were nearly 10,200 housing starts last year, a 21% increase since 2015.  Additionally, the northeastern county of Putnam ranked fourth statewide for total new permits on file with HBW as it had a 27% year-over-year increase in housing starts.

Here is a closer look at how regions across Florida stacked up over the year:

FL Resid. Permits by Area - 2015 vs. 2016

FL Resid. Permits by Area – 2015 vs. 2016

Although southeast Florida ranked lowest for total permits, it experienced a 5% increase in housing starts over the previous year.  Additionally, the area continues to hold a higher value in residential construction.  Out of the more than 6,300 housing starts in southeast Florida last year, 1,185 represented homes with values greater than $500k.

When it comes to higher value construction, the central portion of the state is gaining.  In comparison to 2015, Central Florida experienced close to a 9% increase in new residential construction valued greater than $500k.  Across the state, all regions with the exception of the southwest exhibited growth in higher value construction.

FL Resid. Permits >$500k

FL Resid. Permits >$500k – 2015 vs. 2016

As previously mentioned, Central Florida and its expansive county of Orange took the lead for housing starts across the state.  Other notable counties that gained attention for both growth and total new construction activity could be found in the northeastern, western and southwestern areas of the state.  More specifically, Hillsborough County (West) ranked second highest for total housing starts as it experienced a 20% year-over-year increase in residential construction, resulting in close to 4,500 new permits in the HBW database.  Lee County (SW) also exhibited a healthy year-over-year increase in residential construction (+13%) and ranked third highest for total housing starts (3,443 permits).  Coming in close to Lee, St. Johns County (NE) had a whopping 27% year-over-year increase in housing starts, resulting in more than 3,400 new residential construction permits in 2016.

FL Top 5 Counties for Total Permits - 2016

FL Top 5 Counties for Total Permits – 2016

Information utilized for the graphs and above listed figures for Florida residential construction was directly derived from HBW construction data reports. To gain access to the HBW database and receive custom and detailed reports on the latest residential and commercial building activity in Florida, Georgia, Texas, Alabama, and Oklahoma, please contact HBW for details.

Housing Starts on the Rise in Atlanta

When it comes to residential construction in Atlanta, it just keeps getting better. In 2016, the metro Atlanta area experienced a 14% year-over-year increase in housing starts.

Atlanta 2016 Report HBWeekly.com

Atlanta isn’t often referred to as “Hotlanta” just for the weather, nor for the many activities and events that take place there.  Atlanta is a popular city for many reasons, and in 2016, new residential construction continued to add the “hot” to Atlanta.  With more than 22,000 housing starts on file with HBW in 2016, this southern city has continued to grow in new residential construction.  In fact, since 2011 there has been consistent upward momentum, with 2016 having the most new residential construction permits on file in five years.

ATL Residential Construction Permits 2011-2016

ATL Residential Construction Permits 2011-2016

In a recent article by the Atlanta Business Chronicle several planned and new residential projects around metro Atlanta were highlighted, with some of the largest projects taking place in the counties of Gwinnett, Cobb and Cherokee.  Those same counties were on HBW’s top five for residential construction in 2016 and continue to be areas to watch – Gwinnett County had the most housing starts of any county in the Atlanta area last year, and Cobb County had a 64% year-over-year increase in new residential construction.  While Gwinnett County experienced a 10% year-over-year increase in housing starts in 2016, its upward climb to the top started years prior.  Since 2011, residential construction has been on the rise and climbing in Gwinnett:

Gwinnett County Residential Permits 2011-2016

Gwinnett County Residential Permits 2011-2016

Other areas that may not have as many housing starts but show great potential for growth based on % change from year to year are the counties of Banks, Carroll and Rockdale.  Here’s a look at the counties with the greatest percentage of growth in new residential construction from 2015 to 2016:

ATL Top 5 Counties for Growth 2016 (%)

ATL Top 5 Counties for Growth 2016 (%)

Since growth in housing starts from year to year does not signify the greatest amount of construction, we narrowed down the highest volume of residential permits to five counties.  Out of the 24 counties reviewed, Gwinnett (as noted above) took the top spot.  Next in line was the county of Forsyth; although Forsyth has remained steady without any significant growth over the last year, it ranked second highest of metro Atlanta counties with 2,865 residential construction permits on file with HBW in 2016.  Another county with high volume but limited growth was Fulton.  Last year, Fulton County experienced an 8% dip in housing starts while still ranking third with more than 2,400 permits on file for the year.  From 2011 to 2015, residential construction was steadily rising in Fulton County, and it continues to be the leading county for higher value construction (>$500k); it will most definitely be an area to watch in the coming year.  Cherokee and Cobb counties closed the top chart in fourth and fifth with 1,995 and 1,601 permits respectively.

ATL Top 5 Counties for Total Resid. Permits - 2016

ATL Top 5 Counties for Total Resid. Permits – 2016

Information utilized for the graphs and above listed figures for metro Atlanta residential construction was directly derived from HBW construction data reports. To gain access to the HBW database and receive custom and detailed reports on the latest residential and commercial building activity in Florida, Georgia, Texas, Alabama, and Oklahoma, please contact HBW for details.

HBW Report: Texas Residential Construction Year-End Review 2016

In Texas, while housing starts in 2016 were consistent with totals from the previous year, areas like Austin showed tremendous growth and have maintained an upward pattern over the last several years.

TX report

The year-end reports are in, and with more than 66.5k housing starts in the Texas Triangle (including Dallas, Houston, San Antonio and Austin) last year, there is fresh data and plenty of new permits to review.  For starters, three out of four areas were actually ahead of 2015, with Austin showing the most growth (+21%) and having more than 11k housing starts last year.  Although San Antonio had the lowest number of housing starts (6,322 permits) for the year, it was also up with a 4% year-over-year increase. In Dallas, residential construction remained somewhat steady as there was a slight (+1%) increase in new residential construction and approximately 21.5k housing starts for the year.  Additionally, all three areas have been on an upward trend over the past five years, with each year having more new residential construction permits on file with HBW than the last. Although residential construction in Houston was down 11% since 2015, it still came out ahead of the other three major metropolitan areas as it had the most housing starts (27,581 permits) on file for the given period.

Texas Residential Construction Permits by Area - 2015 vs. 2016

Texas Residential Construction Permits by Area – 2015 vs. 2016

In Houston, Harris County had the greatest concentration of housing starts in comparison to other counties statewide.  With more than 14.3k new residential construction permits last year, it is clear that Harris County is #1 for total housing starts.  Trailing behind and ranked second for total housing starts is Collin County in Dallas; having experienced a year-over-year increase of more than 6%, Collin County had nearly 7k housing starts last year, the most starts on record in the county for more than five years.

Moving to the rapidly growing area of Austin, Travis County ranked third for total housing starts last year.  The area experienced the most growth of any county reviewed (+25%) having more than 5,900 residential construction permits added to the HBW database last year.

TX Top 5 Counties for Resid. Permits - 2016

TX Top 5 Counties for Resid. Permits – 2016

When looking for the areas with the greatest signs of growth in residential construction, Travis County was not alone.  In San Antonio, Comal County has exhibited significant growth over the last five years, with the area having more than a 23% year-over-year increase in housing starts. Other counties that have been gaining year after year are the counties of Williamson (+19.5%) and Hays (+15.3%) in the Austin area.

Top 5 Counties for Growth - 2015 vs. 2016

Top 5 Counties for Growth – 2015 vs. 2016

In addition to reviewing total housing starts, we took a closer look at residential construction valued over $500k and found Dallas to be leading the Lone Star State.  Dallas experienced a year-over-year increase of more than 8% in higher-value construction with an excess of 1,900 housing starts in this value bracket.  The Dallas counties of Collin and Dallas were ranked in the top spots for higher value construction out of all counties throughout the state, with Collin County experiencing the most significant year-over-year increase of 33%. Here’s a closer look at counties with the greatest concentration of new residential construction valued over $500k:

TX Top 5 Counties for Resid. Permits Valued >$500k

TX Top 5 Counties for Resid. Permits Valued >$500k – 2016

Information utilized for the graphs and above listed figures for Texas residential construction was directly derived from HBW construction data reports. To gain access to the HBW database and receive custom and detailed reports on the latest residential and commercial building activity in Florida, Georgia, Texas, Alabama, and Oklahoma, please contact HBW for details.

Florida Swimming Pool Construction Thrived in December

December was one of the top months for swimming pool construction in Florida, having experienced a 45% month-over-month increase.

Florida New Swimming Pool Construction Permits - Jan thru Dec 2016

Florida New Swimming Pool Construction Permits – Jan thru Dec 2016

The month of December was a busy one for swimming pool construction in Florida.  From swimming pool builders leading each region to month-over-month increases of more than 50% in some areas, December proved to be a strong month for swimming pool builders in Florida.

Although HBW subscribers can easily gain access to the permit data and details for the more than 1,700 pool starts and nearly $73M in construction value in December, we will take a look at some of the highlights of swimming pool construction in the Sunshine State.  For starters, December ranked in the top five for total swimming pool starts out of all monthly periods in 2016.  With a 45% increase in activity in comparison to November, every area throughout the state had a healthy boost in new pool construction.  Southwest Florida experienced the greatest month-over-month increase (+66%) and ranked #1 for total pool starts with 534 permits and nearly $23.2M in total construction value;  the southwestern counties with the most permits on file were Lee, Collier and Manatee.

Southeast Florida ranked second for both total pool starts and greatest increase in new pool construction last month.  Out of the more than 400 new permits and approximately $18.2M in construction value, Palm Beach County had the greatest number of new pools (176 permits) in the area, while Miami-Dade County carried the highest average value for new pool construction at more than $56k.

Tampa also experienced a significant month-over-month increase (+30%) in swimming pool starts last month with more than 300 new permits and $13.6M in construction value added to the HBW database.  Just as in residential construction, Hillsborough County had the greatest concentration of new permit activity in the area.

Not far behind, Orlando had a 25% increase in swimming pool starts since November with nearly 300 new construction permits totaling more than $11M in value.  More than 68% of all new permits took place in the larger counties of Orange and Osceola.

Florida Total Pool Permits by Area - Dec 2016

Florida Total Pool Permits by Area – Dec 2016

Despite Jacksonville having the least amount of swimming pool starts, it was an improvement since November.  In December, a 40% month-over-month increase in Jacksonville resulted in more than 165 new swimming pool construction permits with close to $6.6M in total value.

When looking at the average value of construction, there were no major shifts in any of the regions reviewed.  In fact, the range in average value of construction is fairly tight across the state, with less than a $10k difference from highest to lowest.  Southeast Florida maintained its lead at the top with an average value of $44,847 for swimming pool starts last month, while Orlando continued to hang at the lower end of the spectrum with an average value of $36,917.  Tampa moved up two spots since November, ranking second highest for average value at $44,518.

FL Average Value of New Swimming Pool Construction - Dec 2016

FL Average Value of New Swimming Pool Construction – Dec 2016

Out of the hundreds of active pool builders throughout the state last month, there were standouts in each region.  Here’s a breakdown of the builders with the most pool starts on file in each region for December:

Top Pool Builders by Region - December 2016

Just as there are top builders in each region, there are counties that experience more new construction than others.  Last month, every area except Jacksonville had a county ranked in the top 10 for highest concentration of swimming pool starts.  The listing is as follows:

FL Top 10 Counties for Total New Pool Permits - Dec 2016

FL Top 10 Counties for Total Pool Permits – Dec 2016

Information utilized for the graphs and above listed figures for Florida swimming pool construction was directly derived from HBW construction data reports. To gain access to the HBW database and receive custom and detailed reports on the latest residential and commercial building activity in Florida, Georgia, Texas, Alabama, and Oklahoma, please contact HBW for details.

Florida Residential Construction Update – December 2016

Florida experienced more than a 55% month-over-month increase in new residential construction in December, resulting in nearly 4,300 new permits on file with HBW.

FL Residential Construction - Jan thru Dec 2016

FL Residential Construction – Jan thru Dec 2016

Out of the approximately 4,300 new permits and $1.2B in construction value added to the HBW database for Florida last month, the southeast, southwest, Orlando, Tampa and Jacksonville areas all experienced major increases in new residential permitting activity since November.  In December alone, there was a 55% month-over-month increase across the Sunshine State, and Tampa took the lead having 1,103 housing starts and approximately $294M in construction value.  In Tampa, the greatest number of housing starts (more than half) took place in the counties of Hillsborough (371 permits) and Polk (323 permits), and across the entire metro area there was a 67% spike in starts in comparison to November.

Just under Tampa and up 55% since November, the southwest region of Florida had 966 housing starts with approximately $265M in total value added to the HBW database.  In the southwest, the highest concentration of new residential construction permits could be found in Lee County (318 permits), while the highest average value of new residential construction was in Collier County, with an average value of $321k.

Just as in Tampa, the Orlando area also had a 55% increase in housing starts on file since November.  During the month of December, there were 925 housing starts and more than $269M in total construction value.  According to Zillow’s latest press release listing the 10 Hottest Housing Markets of 2017, the City of Orlando ranks #4 nationwide, with a forecasted home value appreciation of 5.7%. (source: Zillow) .  Housing starts are also hot in Orlando and continue to be highest in the more central areas of the city, with 40% of housing starts taking place in Orange County last month.

FL Total Residential Construction Permits - Dec. 2016

FL Total Residential Construction Permits – Dec. 2016

The area that had the greatest month-over-month increase was Jacksonville (+69%).  Out of the 813 new residential construction permits with a value in excess of $187M in Jacksonville last month, the counties of Duval and St. Johns had the greatest amount of new construction activity as more than half of all housing starts on file were sourced from there.

Although the southeast portion of Florida had the least amount of housing starts in comparison to other regions throughout the state, it experienced an impressive 49% month-over-month increase resulting in nearly 490 housing starts with approximately $172M in total value.  St. Lucie and Palm Beach counties had the most residential construction activity with 148 permits and 125 permits respectively.  As per usual, the southeast region held the highest value of new residential construction last month at more than $351k.

When looking at the average value of residential construction throughout the state, the lineup has remained somewhat consistent every month.  As previously mentioned, the southeast continued to hold the highest average value of housing starts at $351,081.  Orlando held in second highest with an average value of $290,905, while the southwest region was not far behind at $274,519.  Tampa was next in line with an average value of $266,627, and Jacksonville continued to hold the lowest average value for new residential construction at $230,374.

FL Average Value of New Residential Construction - Dec. 2016

FL Average Value of New Residential Construction – Dec. 2016

Information utilized for the graphs and above listed figures for Florida residential construction was directly derived from HBW construction data reports. To gain access to the HBW database and receive custom and detailed reports on the latest residential and commercial building activity in Florida, Georgia, Texas, Alabama, and Oklahoma, please contact HBW for details.

Texas Residential Construction Hits a High Note in December

Despite the holidays and vacations of December, there wasn’t any time lost for residential construction in the Lone Star State.

Texas residential construction received a great gift over the holiday season.  In December, the HBW database had an influx of new residential construction permits in Texas, resulting in more than 5,700 new permits, a month-over-month increase of nearly 70%.  From a yearly perspective, the month of December ranked fourth highest in 2016 for total new permits during any given monthly period.

Texas - Residential Construction Permits Jan. thru Dec. 2016

Texas – Residential Construction Permits Jan. thru Dec. 2016

Out of the 5,738 permits and nearly $1.4B in total value in the “Texas Triangle” (Dallas-Fort Worth, Houston, Austin, San Antonio), Houston was #1 for total new permits in December as it experienced a month-over-month increase of 65% in housing starts.  Out of the 2,453 housing starts and approximately $469M in total construction value in the Houston area, more than half of the housing starts took place in Harris County (1,380 permits) while more than 20% originated from Fort Bend County (512 permits).

While Dallas ranked second highest for total housing starts (1,886 permits), it landed the top of the charts for average value at $305,051, and the area had a leading total value of more than $575M in new residential construction last month.  In December, the Dallas area experienced a month-over-month increase of more than 75% in new residential construction, and the county with the highest concentration of housing starts was Collin.

Texas - Total Residential Permits by Area in Dec. 2016

Texas – Total Residential Permits by Area in Dec. 2016

Austin also had a month-over-month spike in new residential construction permits in December; an increase of approximately 67% in comparison to November had Austin ranked third highest with 976 housing starts and nearly $243M in total value.  Nearly all of the housing starts took place in the counties of Williamson (455 permits) and Travis (409 permits).

Although San Antonio had the fewest housing starts on file in comparison to the larger metro areas of Texas, it had an increase of 63% in new residential construction permits since November.  In San Antonio, 423 new permits with a total value of approximately $95.4M were added to the HBW database last month.  More than half of San Antonio’s housing starts took place in Bexar County.

When looking at the average value of new residential construction, Dallas continued to shine.  As previously mentioned, Dallas had an average value of $305,051, significantly higher than the other metro areas within the Texas Triangle.  Austin was ranked second highest at $248,906, while San Antonio came in third with an average value of $225,535.  While Houston led for total housing starts, it had the lowest average value of construction at $191,101 for the month.

Texas -  Average Value of Residential Construction in Dec. 2016

Texas – Average Value of Residential Construction in Dec. 2016

Information utilized for the graphs and above listed figures for Texas residential construction was directly derived from HBW construction data reports. To gain access to the HBW database and receive custom and detailed reports on the latest residential and commercial building activity in Florida, Georgia, Texas, Alabama, and Oklahoma, please contact HBW for details.

5 Tips for Successful Resolutions

How do you make your new year’s resolutions count?  Here are easy ways to increase your chances for achieving your latest goals.

Goals - HBWeekly.com

Resolutions… They are not just for the new year.  No, resolutions are decisions and intentions that you set to accomplish, usually within a given period of time.  Although the new year provides an apropos moment to set such intent, resolutions can and should be happening throughout the year.  Think about it – From new job sites and projects to monthly meetings and new office systems, new goals and directions come about year-round.  In order for these goals and objectives to be successful, there must be realistic expectations, consistent effort and thorough follow through.  Here are five ways to help turn a resolution into a realization:

  1. Document It – If you’ve got a resolution, don’t just talk about it – write it down. Have a place where it is recorded, visible and accessible.  By committing the goal to paper (or file), it is not only reinforced in your own thinking, but it gains a more concrete reality.  Additionally, it gives you time to review it and make modifications if necessary.
  2. Review It – One surefire way to miss a goal is to make it unattainable. To set a goal for success, take time to review it to ensure that it is realistic and based on you or your company’s current timelines and resources, not those that you hope to have in the future.  If there are other team members involved in reaching those goals, include them in the setting and review process for input and feedback.
  3. Break It Down – Now that you have a solid and realistic goal or resolution, break it down by the steps that you will need to take to achieve it. Include a timeline, list of resources, action items, players, stipulations and budgets if applicable.
  4. Set Checkpoints – Incorporated in the timeline should be “checkpoints”. These checkpoints should be set to ensure that you are on schedule and will be able to reach your set goal within the given time frame (one year for resolutions).  An easy general guideline would be to set checkpoints at 25%, 50% and 75% completion; they should include the expected status of action items, available and utilized resources, as well as the players to report on the specific stages of progress.
  5. Follow Through – Once you have achieved your goal, give yourself a pat on the back, but it doesn’t end there. Follow through and maintenance are part of the next stage and usually ongoing for many goals.  If it is a project-based goal, great, you’ve reached the finish line, but if it is a business goal, the journey has just begun.  Just as when you set the goal, you will want to assign key players to maintain the new system or project that has been added.  Just as in checkpoints, you will need to have regular “check-ins” throughout the year to make sure your new endeavor can grow with your business in the years to come.  This can be as easy as adding a new line item to your meeting agenda or requesting quarterly reports from a team member(s).

Resolutions get quite a bit of hype this time of year, but they are essentially goals.  As your business grows, so will your goals.  The success of a business relies on the success of meeting objectives.  By taking a methodical and structured approach to setting and attaining realistic resolutions, you will drive your business to a successful new year, every year.

For more information on construction business and marketing tips, stay connected with the HBW Blog.  To get ahead of construction activity and gain access to the latest permitting data in Florida, Texas, Georgia, Alabama and Oklahoma, contact HBW for more information on construction data reports and industry leads.

Industry Update: 2018 Energy Code

Although it’s constantly in progress and changes won’t be active for another year, here is a quick look at the latest on progress within the Energy Code.

HBW Energy Article

As you most likely already know, the International Energy Conservation Code (IECC) is the model building energy code that is recognized by the U.S. Department of Energy, stated in federal law and used by more than 40 states; the code is updated every three years based on input from code officials, efficiency advocates, builders and more.  The process of updating the code is lengthy, with the latest update having been in progress for over a year.

So why so much emphasis on energy codes in recent years and what is the point?  It’s simple and complex at the same time.  To start, Americans spend more than $200 billion each year on their energy bills (source: EIA).  That being stated, the Department of Energy recently reported that a mere 4%-5% increase in stringency of the building energy code could cumulatively save consumers $126 billion on energy bills from 2010-2040 (source: EnergyCodes.gov), not to mention the importance of sustainability and energy efficiency.  The truth is that it is much more costly and cumbersome to make modifications to an existing building for the purpose of energy efficiency rather than to get it right and more efficient on the front-end and during construction, in this case within the code.

According to the latest from the National Resource Defense Council (NRDC), the 2018 IECC was finally approved by code officials after several rounds of review, and it resulted in support for upholding the efficiency requirements of previous years’ energy codes for building owners. (source: NRDC.org) With the previous code in place and business as usual, there were no major additions, and the gains that were made in previous cycles of the code are being maintained.  There were a variety of proposals, and those that would have significantly weakened the code didn’t make the cut, as well as those that may have helped states and municipalities achieve carbon neutrality.  Although there appears to be a bit of a flatlining in the upcoming code, according to NRDC, there were a few successful proposals that are expected to make homes and businesses more efficient in 2018:

On the residential side of the code, these will clarify how the Energy Rating Index (ERI) path of the code is calculated to ensure consistency for consumers, require a minimum level of efficiency for homes that meet the code with renewable energy, and mandate the installation of more efficient windows in most climate zones. Commercial buildings (including large multifamily buildings) will be required to have more efficient showerheads. (Source: NRDC)

Timeline

Although proposals have been approved, votes still need to be confirmed and certified in the months ahead.  The final version of the 2018 IECC is slated to be published in the middle to end of this year.  Once the Department of Energy has analyzed the energy savings of the new code and all approvals have been processed, states are expected to adopt the code once it goes into effect in 2018.

For more details on the proposals, from position briefs to important dates and timelines, visit the U.S. Department of Energy website here.  Other useful resources include the Building Code Assistance Project, where users can utilize maps that provide a snapshot of building energy code adoption (including the status of energy codes) by state.

For more information on construction industry news, business and marketing tips, stay connected with the HBW Blog.  To get ahead of construction activity and gain access to the latest permitting data in Florida, Texas, Georgia, Alabama and Oklahoma, contact HBW for more information on construction data reports and industry leads.