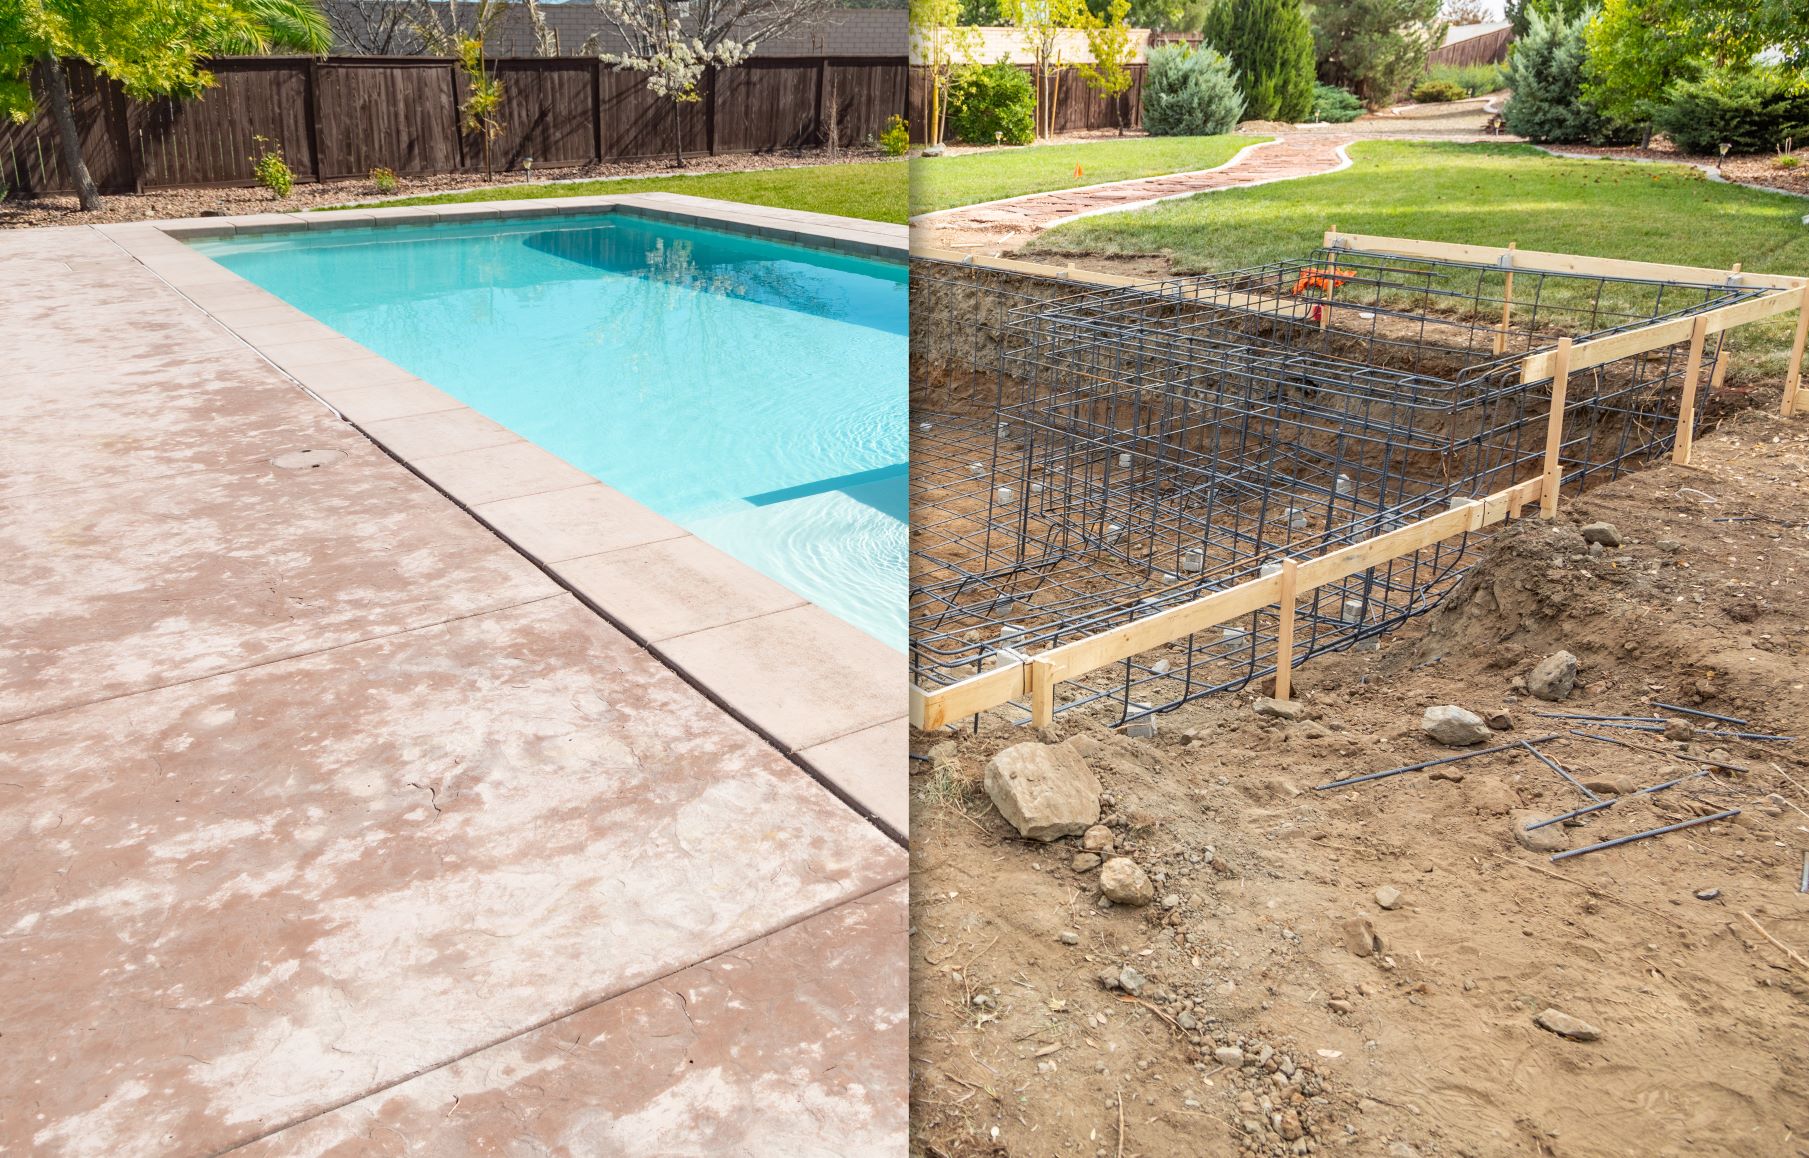
A quarterly review (Q1-2023) of new swimming pool construction activity in Texas

Since the start of this year, there have been just over 1,850 new swimming pool construction permits added to the HBW database for Texas; this figure reflects a substantial year-over-year decline of 44 percent in pool construction. This decrease stands in sharp contrast to the annual growth we have seen in the Lone Star State over the last several years. In fact, since 2019 the market has shown improvement, with year-over-year increases ranging from a low of 1 percent (2022) to a high of 29 percent (2020). And while 2022 demonstrated slower growth than previous years, the major decline in the first quarter of this year is a notable shift from an established upward moving pattern.
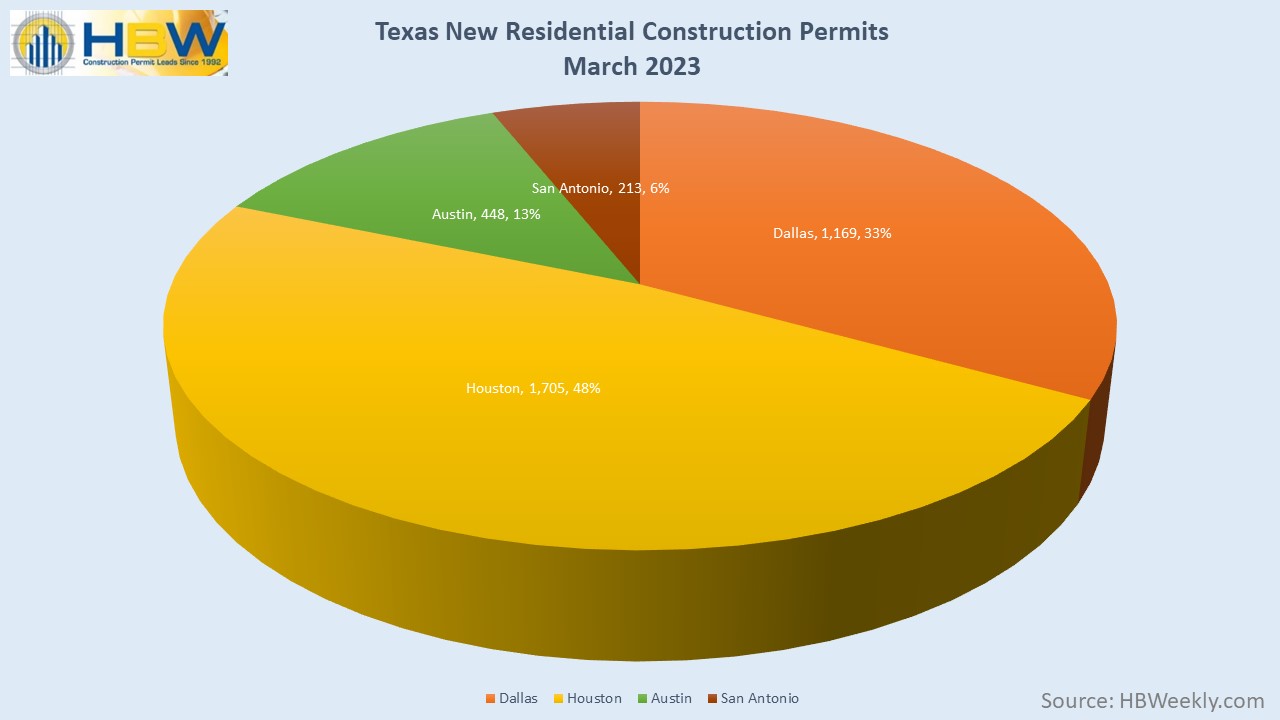
In the latest Swimming Pool Construction Activity Trend Report (Q1-2023) produced by HBW, all four major metro areas in Texas (Dallas, Houston, Austin, San Antonio) are on a low when it comes to new pool permits this year. Year-over-year drops in new swimming pool construction range from -40 percent (Austin) to -51 percent (Houston). Out of the four regions reviewed, the greatest concentration of new construction could be found in Dallas (906 permits), while the lowest level of construction took place in the San Antonio area (172 permits).
From a county perspective, there are five counties that carried 63 percent of all new swimming pool construction across the state; those counties are as follows:
#1 – Harris County (Houston) – 294 permits
#2 – Dallas County (Dallas) – 245 permits
#3 – Travis County (Austin) – 224 permits
#4 – Tarrant County (Dallas) – 206 permits
#5 – Collin County (Dallas) – 197 permits
While it is still early in the year, leaving ample time for the market to play a bit of catch up, the latest reports certainly demonstrate a slowing in new swimming pool construction that is worthy of monitoring and reviewing in future HBW reports.
To gain more information on the builders, homeowners and permits for the construction activity above, check out HBW for your copy of the latest construction data reports. To gain access to the HBW database and receive custom and detailed reports on the latest residential and commercial building activity in Florida, Georgia, Texas, Alabama, and Oklahoma, please contact HBW for details.