Florida Residential Construction Review Q3-2021

A review of permit data on record with HBW for new home construction in Florida through the third quarter of 2021

Over the last several years, the Sunshine State has exhibited annual increases in new home construction ranging from a low of 2 percent to a high of 15 percent, and so far this year the upward trend has continued.  From January through September of 2021, there has been a 43 percent increase in new residential construction permits in comparison to the same time last year, resulting in more than 99,800 new permits on record with HBW.

Out of the six regions reviewed, more than 45 percent of all new residential construction permits originated from the southwest and west where there were 22,993 and 22,287 permits on record through Q3 respectively.

Here is a closer look at the total permits, % year-over-year increase in residential construction (YTD), as well as the leading counties in each of the six Florida regions reviewed:

Southwest

In the southwestern region, there were 22,993 new permits through the third quarter of this year, reflecting a 78 percent increase in comparison to the same period last year. Out of the five counties that make up the southwest, Lee County (7,691 permits) held the highest concentration of new home construction activity.

West

Through Q3-2021, there have been 22,287 new residential construction permits added to the HBW database for the western region of Florida, reflecting a 40 percent year-over-year increase in new home construction. Out of the seven counties reviewed, the highest concentration of new permits originated from Polk County (7,207 permits) and Pasco County (6,916 permits)

Northeast

In Northeast Florida, there have been 19,094 new residential construction permits added to the HBW database through the third quarter of this year, reflecting a 51 percent increase in comparison to the same time last year. Out of the eight counties that make up the northeastern region, more than half of all new permits originated from the two counties of St. Johns (5,045 permits) and Duval (4,617 permits).

Central

Through the third quarter of this year, there have been 14,591 residential construction permits recorded for Central Florida, reflecting a 34 percent year-over-year increase in new home construction. Out of the six counties included in the Central Florida report, the highest concentration of new residential construction activity could be found in Orange County where there were 3,920 new permits on record for the 9-month period.

Northwest

In the northwestern region of Florida, there has been an 8 percent year-over-year increase in new home construction, resulting in 10,783 new permits on record with HBW. Out of the 18 counties that were included in the regional report, more than 50 percent of all new residential construction activity took place in Santa Rosa, FL (1,591 permits), Baldwin, AL (2,327 permits), and Bay, FL (1,505 permits).

Southeast

Through the third quarter of this year, there have been 10,055 new residential construction permits added to the HBW database for the southeastern region of Florida; this reflects a 39 percent year-over-year increase in new home construction. Out of the seven counties that make up the southeast, the County of St. Lucie (4,605 permits) carried the highest volume of new residential construction permits.


To gain more information on the builders, homeowners and permits for the construction activity above, check out HBW for your copy of the latest construction data reports. To gain access to the HBW database and receive custom and detailed reports on the latest residential and commercial building activity in Florida, Georgia, Texas, Alabama, and Oklahoma, please contact HBW for details.

HBW Quarterly – Florida Swimming Pool Construction Q3-2021

A review of permit data for new swimming pool construction in Florida through the third quarter of this year

Swimming pool construction is on the rise in Florida. According to the Florida Swimming Pool Association, during 2020 the pool industry experienced an increase in demand, serving Floridians who were home and utilizing their backyards more than usual. “Interest in owning a swimming pool soared with a 23 percent increase in new pool permits over the prior year, the largest single-year increase in more than a decade.”  Based on HBW reports, this rising trend does not appear to be changing any time soon.

As evident in the latest HBW Swimming Pool Construction Activity Trend Report for Florida, there has been a 43 percent year-over-year increase in new swimming pool construction so far this year (thru Q3-2021), resulting in 32,170 new permits added to the HBW database. Out of the six major Florida regions reviewed (Southwest, Central, West, Southeast, Northeast, Northwest), the highest concentration of new pool permits could be found in the southwestern region of the state (10,749 permits); the southwestern region, along with the southeast, also exhibited the greatest gains in new pool construction as both areas had a 68 percent increase in new pool permits in comparison to the same time last year.

Here is a closer look at the total permits, growth rates and leading counties for new swimming pool construction across the Sunshine State through Q3-2021:

Southwest

Total Permits: 10,749

% Change YTD: +68 percent

Leading Counties for Total New Permits: Lee County (3,523 permits); Collier County (2,192)

Southeast

Total Permits: 6,238

% Change YTD: +68 percent

Leading Counties for Total New Permits: Palm Beach County (2,300 permits); Miami-Dade County (1,807 permits)

West

Total Permits: 5,316

% Change YTD: +25 percent

Leading Counties for Total New Permits: Pasco County (1,502 permits); Polk County (1,030 permits)

Central

Total Permits: 4,233

% Change YTD: +28 percent

Leading Counties for Total New Permits: Orange County (1,802 permits); Brevard County (823 permits)

Northeast

Total Permits: 3,069

% Change YTD: +27 percent

Leading Counties for Total New Permits: St. Johns County (1,187 permits); Duval County (584 permits)

Northwest

Total Permits: 2,565

% Change YTD: +6 percent

Leading Counties for Total New Permits: Santa Rosa County (530 permits); Walton County (327 permits)

To gain more information on the builders, homeowners and permits for the construction activity above, check out HBW for your copy of the latest construction data reports. To gain access to the HBW database and receive custom and detailed reports on the latest residential and commercial building activity in Florida, Georgia, Texas, Alabama, and Oklahoma, please contact HBW for details.
Texas Home Construction Review Q3-2021

A review of permit data on record with HBW for new home construction in Texas through the third quarter of 2021

Since the start of this year, new home construction has been on the rise in the Lone Star State; in fact, housing starts are up by 18 percent in comparison to the same time last year.  Based on HBW’s latest Building Activity Trend Report for new residential construction in Texas, there have been more than 74,300 new permits added to the HBW database (thru Q3-2021) from the combined areas of Dallas, Houston, Austin, and San Antonio.

Out of the four metro areas reviewed, Houston (32,301 permits) carried the highest concentration of new residential construction activity, while Dallas held the greatest amount of higher value (>$500k) housing starts.

Here is a closer look at the total permits, leading counties and year-over-year growth rates for new home construction in Texas through Q3-2021:

Houston

As previously noted, Houston has carried the greatest concentration of new home construction activity, having more than 32,300 new permits on record with HBW through the third quarter of this year; this reflects a 19 percent year-over-year increase in new home construction.  Out of the five counties that make up the area, nearly half of all new permits originated from Harris County, where there were 16,005 new permits on record for the nine-month period.

Dallas

Since the start of this year (thru Q3), the Dallas area has experienced a 20 percent year-over-year increase in new home construction, resulting in approximately 24,675 new permits.  As previously noted, Dallas holds the greatest amount of higher value (> $500k) residential construction in comparison to other Texas regions reviewed, and so far this year there have been 1,567 higher value permits recorded for the area.  Out of the six counties factored into the Dallas report, the bulk of new home construction could be found in the counties of Collin (8,840 permits) and Tarrant (7,167 permits).

Austin

Through the third quarter of this year, there have been more than 10,525 new residential construction permits added to the HBW database for Austin; this reflects a 10 percent increase in comparison to the same time last year.  Out of the four counties that make up the area, nearly all new home construction could be found in the two counties of Travis and Williamson where there have been 4,890 and 4,325 new permits respectively.

San Antonio

Through the third quarter of this year, San Antonio has experienced an 18 percent year-over-year increase in new home construction, resulting in approximately 6,800 new permits on record with HBW.  Out of the three counties that make up the area, nearly half of all new residential construction activity took place in Bexar County where there have been 3,370 new permits on record for the given period.


To gain more information on the builders, homeowners and permits for the construction activity above, check out HBW for your copy of the latest construction data reports. To gain access to the HBW database and receive custom and detailed reports on the latest residential and commercial building activity in Florida, Georgia, Texas, Alabama, and Oklahoma, please contact HBW for details.

HBW Quarterly – Texas Swimming Pool Construction Q3-2021

A review of permit data for swimming pool construction in Texas from January through September 2021

Since 2018, new swimming pool construction has been on the rise in Texas, with annual increases ranging from 3 percent (2019) to 29 percent (2020); so far this year (thru Q3-2021), the upward trend appears to be holding as there has been a 21 percent year-over-year increase in new swimming pool construction activity, resulting in more than 10,000 new permits on record with HBW.

Out of the four major metro areas reviewed (Houston, Dallas, Austin, San Antonio), Houston has experienced the greatest boost in new swimming pool construction, having a 28 percent year-over-year increase and approximately 3,570 new permits on record through Q3-2021.  As far as the highest concentration of permits is concerned, Dallas ranked #1 as there were approximately 4,775 new permits on record through Q3, reflecting a 23 percent increase in swimming pool construction in comparison to the same time last year.

Another area worth noting is Austin.  Over the last four years, swimming pool construction has been on the rise in the Austin area, and as of the latest Q3 reports, that pattern appears to be holding; from the start of this year through September, Austin has demonstrated a 2 percent year-over-year increase in new pool construction, resulting in more than 1,000 new permits on record with HBW.

While San Antonio had the lowest total number of swimming pool starts on file through the third quarter of this year, the area reflects gains in new pool construction.  Since the start of this year (through September), there has been a 6 percent year-over-year increase in new pool construction, resulting in approximately 690 new permits added to the HBW database. 

When looking at construction patterns from a county-by-county perspective, there were four counties that held 60 percent of all new permitting activity:

Harris County (Houston area) was a standout, as there were approximately 2,075 new permits resulting from a 26 percent year-over-year increase in new pool construction.  In the Dallas area, the bulk of new construction permits originated from the counties of Collin (1,576 permits), Tarrant (1,292 permits), and Denton (1,111 permits) where there have been year-over-increases in swimming pool construction ranging from 25 percent (Tarrant) to 67 percent (Denton).


To gain more information on the builders, homeowners and permits for the construction activity above, check out HBW for your copy of the latest construction data reports. To gain access to the HBW database and receive custom and detailed reports on the latest residential and commercial building activity in Florida, Georgia, Texas, Alabama, and Oklahoma, please contact HBW for details.
Florida Residential Construction Review – September 2021

A review of permit data for new home construction in Florida during the month of September 2021

Based on HBW’s latest construction data reports, there were 8,421 new residential construction permits with a total value in excess of $2.4 billion added to the HBW database for the Sunshine State last month; this reflects about a 21 percent month-over-month decrease in new home construction.

Out of the five regions covered in the reports (Southwest, Tampa, Orlando, Southeast, Jacksonville), the greatest concentration of new home construction activity took place in the Southwest (2,516 permits), while the highest average value of new residential construction permits could be found in the Southeast (average value: $308,486).

Here is a closer look at the total permits, average value of construction, leading counties, and top home builders for each of the Florida regions reviewed:

Total Permits

As noted above, there were 8,421 new residential construction permits added to the HBW database for the month of September.  Out of the five regions reviewed, the southwestern region carried 30 percent of all new construction, while the southeastern region carried the fewest (10 percent) new permits on record.  Total permits by area for the one-month period are as follows:

Average Value

Across the Sunshine State, the average value of new home construction ranged from a high of $308,486 (Southeast) to a low of $241,970 (Jacksonville):

Top Counties

Out of the approximately 30 counties included in the construction data reports for Florida, there were five counties that carried nearly 40 percent of all new construction activity, and the total permits on record for each of those counties are as follows:

  • Lee County (Southwest) – 850 permits
  • Hillsborough County (Tampa) – 800 permits
  • Pasco County (Tampa) – 612 permits
  • Polk County (Tampa) – 504 permits
  • Sarasota County (Southwest) – 497 permits

Leading Home Builders

Although hundreds of contractors were actively pulling new residential construction permits last month, there were three home builders that carried the greatest share of new permits for the one-month period; those top three home builders are as follows:

#1 – D.R. Horton (1,229 permits)

#2 – Lennar Homes (1,082 permits)

#3 – Pulte Homes (640 permits)


To gain more information on the builders, homeowners and permits for the construction activity above, check out HBW for your copy of the latest construction data reports. To gain access to the HBW database and receive custom and detailed reports on the latest residential and commercial building activity in Florida, Georgia, Texas, Alabama, and Oklahoma, please contact HBW for details.

HBW Report: Florida Swimming Pool Construction – September 2021

A review of permit data for new swimming pool construction in Florida during the month of September 2021

Based on the latest construction data reports from HBW, last month there were nearly 2,870 new swimming pool construction permits with a total value in excess of $160 million added to the HBW database for Florida.  Out of five major regions reviewed (Tampa, Southwest, Orlando, Southeast, Jacksonville), the southwestern region (1,146 permits) carried the highest volume of new swimming pool construction, while Jacksonville (average value: $69,141) carried the highest average value of construction.

Here is a breakdown of new pool construction activity, by region, across the Sunshine State during the month of September 2021:

Southwest

As previously noted, the southwestern region of Florida ranked #1 for new pool construction, having 1,146 new permits with a total construction value of nearly $59.7 million on record for the month of September.  The average value of construction landed on the lower end of the spectrum (average value: $52,071) in comparison to other Florida regions reviewed, and more than half of all new permits originated from the counties of Lee (379 permits) and Collier (300 permits).

Out of the 180 contractors with new pool construction activity on record in the area last month, the following ranked as the top three for total new permits:

Builder Total Permits
1-Aragon Pools & Spas 187
2-Coast to Coast Pools 97
3-Pinnacle USA 69

Southeast

Last month, there were more than 600 new swimming pool construction permits with a total value of $30.7 million on record for the southeastern region of Florida.  The average value of new pool construction was $51,101, which was lowest in comparison to other Florida regions reviewed, and more than half of all new permits originated from the two counties of Miami-Dade (186 permits) and Palm Beach (182 permits).

Out of the 210 pool builders with new construction activity on record in the area last month, the following ranked as the top three for total new permits:

Builder Total Permits
1-A&G Concrete Pools 26
2-Fountain Blue Pool Service 20
3-Apex Pavers & Pools 18

Tampa

In Tampa, there were more than 550 new swimming pool permits with a total value of nearly $36 million added to the HBW database last month.  The average value of new pool construction was $64,966, and more than half of all new construction activity took place in the counties of Hillsborough (185 permits) and Pasco (116 permits).

Out of approximately 145 contractors with new pool construction on record in the Tampa area last month, the following ranked as the top three for total new permits:

Builder Total Permits
1-Challenger Pools 33
2-T&D Pool Construction 30
3-Pointer Pools & Spas 21

Orlando

Last month, there were more than 315 new swimming pool construction permits with a total value of approximately $16.6 million on record for the Orlando area.  The average value of new pool construction was $52,452, and nearly half of all new permits originated from Orange County (145 permits).

Out of the more than 85 contractors with new swimming pool construction on record in the area last month, the following ranked as the top three for total permits:

Builder Total Permits
1-Dreamscapes Pools & Spas 21
2-Legacy Pools 16
3-Holland Pools 16

Jacksonville

In Jacksonville, there were more than 250 new pool permits with a total value in excess of $69 million last month.  The average value of new pool construction was highest in the Jacksonville area (average value: $69,141) in comparison to other Florida regions reviewed, and the bulk of new construction activity took place in St. Johns County and Duval County where there were 115 and 61 permits respectively.

Out of 75 pool builders with new construction activity on record in Jacksonville last month, the following ranked as the top three for total new permits:

Builder Total Permits
1-Pools by John Clarkson 22
2-Palace Pools 11
3-Kerry Martin Pools 9


For more information on the builders, homeowners and permits for the construction activity above, check out HBW for your copy of the latest construction data reports. To gain access to the HBW database and receive custom and detailed reports on the latest residential and commercial building activity in Florida, Georgia, Texas, Alabama, and Oklahoma, please contact HBW for details.
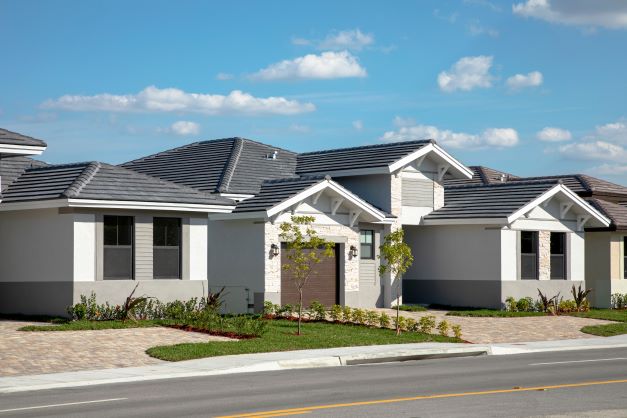
Texas New Home Construction by the Numbers – September 2021

An overview of permit data for new home construction in Texas during the month of September 2021

Based on HBW’s latest construction data reports, there were more than 6,360 new residential construction permits with a total construction value of nearly $1.7 billion in Texas last month.  Out of the four major metro regions reviewed (Houston, Dallas, Austin, San Antonio), the highest concentration of new permitting activity could be found in Houston, where there were 2,831 new permits for the one-month period, while the highest average value of new home construction could be found in Dallas (average value: $326,192).

Here is a closer look and visual breakdown of the new permitting activity, average value of construction projects, as well as leading counties and contractors for new home construction in Texas last month:

New Permits

As previously noted, just over 6,360 new residential construction permits were added to the HBW database for Texas last month.  The total permits recorded for each metro area are as follows:

Average Value of Construction

Last month, the average value of new home construction in Texas ranged from a low of $196,979 (San Antonio) to a high of $326,192 (Dallas).  Here is a closer look at the average value of new residential construction permits in each of the four Texas metro areas based on total new permits on record for September:

Leading Counties

While each metro area has one or two counties where new residential construction is concentrated, when taking a statewide perspective, the top ten counties for new home construction in Texas (based on total permits) are as follows:

Top Ranked Home Builders

Every month, HBW reports provide valuable data on the contractors that are driving new residential construction figures, and month after month two major players continue to dominate the Lone Star State: D.R. Horton and Lennar Homes.  Based on total new permits on record for the month of September, the following Texas home builders ranked as the top three for the one-month period:

#1 – D.R. Horton: 721 permits

#2 – Lennar Homes: 461 permits

#3 – Pulte Homes: 218 permits


To gain more information on the builders, homeowners and permits for the construction activity above, check out HBW for your copy of the latest construction data reports. To gain access to the HBW database and receive custom and detailed reports on the latest residential and commercial building activity in Florida, Georgia, Texas, Alabama, and Oklahoma, please contact HBW for details.

Texas Swimming Pool Construction Report – September 2021

A review of the latest permit data for new swimming pool construction in the Lone Star State during the month of September 2021

Based on the latest HBW construction data reports, there were 850 new swimming pool permits with a total value in excess of $45.5 million added to the HBW for Texas last month; this reflects a 25 percent month-over-month decrease in new pool construction.

Out of the four major metro areas reviewed (Dallas, Houston, Austin, San Antonio), Dallas ranked #1 for new pool construction having nearly 390 new permits on record for the one-month period, and Houston carried the highest average value of new pool construction (average value: $66,099).

Here is a closer look at new pool construction activity in Dallas, Houston, Austin and San Antonio last month:

Dallas

Out of the four major metro areas reviewed, Dallas held the highest concentration of new pool construction last month, having nearly 390 new permits for the one-month period.  The average value of new pool construction was $44,876, and the majority of all permits originated from the counties of Collin (148 permits) and Tarrant (102 permits).

Out of the 160 contractors with new swimming pool construction activity on record for the Dallas area last month, the following ranked as the top three for total new permits:

Builder Total Permits
1-Prestige Pool 20
2-Riverbend Pools 20
3-Foley Custom Pools 20

Houston

During the month of September, there were approximately 295 new swimming pool construction permits added to the HBW database for Houston.  The average value of new pool construction was highest in Houston (average value: $66,099) in comparison to other Texas regions reviewed, and nearly half of all new construction took place in Harris County (132 permits).

Out of the more than 120 pool builders with new construction activity on record in the Houston area last month, the following ranked as the top three for total new permits:

Builder Total Permits
1-Anthony & Sylvan Pools 30
2-Platinum Pools 22
3-Premier Pools 18

Austin

Austin ranked #3 for new pool construction last month, having 93 new permits added to the HBW database.  The average value of new pool construction landed on the higher end of the spectrum (average value: $65,876), and nearly all permits originated from the two counties of Travis County (49 permits) and Williamson (39 permits).

Out of the approximately 50 contractors with new pool construction on record in the Austin area last month, the following rank as the top three for total new permits:

Builder Total Permits
1-Denali Pools 14
2-Texas Pools & Patios 8
3-Premier Pools & Spas of Austin 6

San Antonio

San Antonio held both the lowest amount of new pool construction activity and the lowest average value of construction, having 76 new permits and an average value of approximately $35,130 on record with HBW last month.  Nearly all new pool construction took place in Bexar County where there were 64 new permits on record for the one-month period.

Out of the 30 contractors with new swimming pool construction activity on record in the San Antonio area last month, the following ranked as the top three for total new permits:

Builder Total Permits
1-Cody Pools 13
2-Keith Zars Pools 12
3-Alamo Pool Builders 8


To gain more information on the builders, homeowners and permits for the construction activity above, check out HBW for your copy of the latest construction data reports. To gain access to the HBW database and receive custom and detailed reports on the latest residential and commercial building activity in Florida, Georgia, Texas, Alabama, and Oklahoma, please contact HBW for details.
HBW Quarterly Report: Metro Atlanta Residential Construction (Q3-2021)

A review of new residential construction permit data for the Metro Atlanta area from January through September 2021

Things are looking up in the Atlanta area, and by “up” I mean the residential construction market.  After three years of a slow decline in activity, new home construction appears to be climbing again in Atlanta.  From January through September of this year, there have already been approximately 22,430 new permits added to the HBW database for the Metro Atlanta area, reflecting a 42 percent increase in new home construction in comparison to the same time last year.

The counties with the highest concentration of new residential construction activity for the nine-month period include:

  • Gwinnett County – Last year, Gwinnett County climbed out of a two-year decline in new home construction by having a 17 percent year-over-year increase in new permits during 2020.  This year, the upward pattern appears to be holding as there have been 3,515 new residential construction permits through Q3-2021, reflecting a 39 percent increase in new home construction in comparison to the same time last year.  
  • Forsyth County – Forsyth County had been experiencing a decrease in housing starts year after year since 2016 until last year when the market took a turn for the better; in 2020, Forsyth exhibited a 10 percent year-over-year increase in new home construction, and through the third quarter of this year the upward trend has continued. As of Q3-2021, there have been nearly 1,975 new permits added to the HBW database for Forsyth County, reflecting a 38 percent year-over-year increase in new home construction.
  • Fulton County – Since the start of this year (thru Q3), Fulton County has experienced a 95 percent year-over-year uptick in new home construction, resulting in 1,895 new permits on record with HBW. The area appears to be recovering from a two-year (2019 and 2020) decline in the market, and it also ranks #1 for higher value housing starts, having 328 new permits with construction values in excess of $500k.
  • Cherokee County – Not far behind Fulton County, there have been 1,827 new residential construction permits added to the HBW database for Cherokee County through Q3, reflecting a 14 percent increase in comparison to the same time last year.
  • Henry County – Henry County ranked #5 for new home construction through Q3-2021, having 1,546 new permits on record for the nine-month period; this reflects a 50 percent year-over-year increase in new home construction.


Information utilized for the above listed figures for Metro Atlanta residential construction was directly derived from HBW construction data reports. To gain access to the HBW database and receive custom and detailed reports on the latest residential and commercial building activity in Florida, Georgia, Texas, Alabama, and Oklahoma, please contact HBW for details.
Atlanta Quarterly Report: Swimming Pool Construction – Q3-2021

A review of permit data for new swimming pool construction in the Metro Atlanta area from January through September 2021

Over the last seven years, new swimming pool construction has been on the rise in the Metro Atlanta area, and through the third quarter of this year, the upward pattern appears to be dramatically increasing. From January 2021 through September 2021, there have been 3,480 new swimming pool permits added to the HBW database for Atlanta; this figure reflects a massive 68 percent increase in new swimming pool construction in comparison to the same time last year.

Out of the 24 counties reviewed, Fulton County ranked #1 for new swimming pool construction, having approximately 665 new permits on record with HBW through Q3-2021; this reflects a 129 percent year-over-year increase in new pool construction so far this year.  Since 2015, Fulton County has experienced annual growth in swimming pool construction activity ranging from a low of 5 percent to a high of 23 percent, and with just one more quarter remaining this year, it looks like 2021 could be the strongest year yet for the local market.

Just behind Fulton County, Cobb County ranked second for total new swimming pool construction permits through the third quarter of this year. Having 453 new permits on record so far this year, Cobb County has demonstrated a 43 percent increase in new pool construction through Q3.

Next in line, we have the counties of Gwinnett and Cherokee – Both areas had approximately 320 new swimming pool permits added to the HBW database since the start of this year (thru Q3), reflecting year-over-year increases of 24 percent and 10 percent respectively. 

Other Metro Atlanta areas that are seeing higher levels of new swimming pool construction activity include: Forsyth County (305 permits); Fayette County (202 permits); and Coweta County (197 permits).


To gain more information on the builders, homeowners and permits for the construction activity above, check out HBW for your copy of the latest construction data reports. To gain access to the HBW database and receive custom and detailed reports on the latest residential and commercial building activity in Florida, Georgia, Texas, Alabama, and Oklahoma, please contact HBW for details.