A review of permit data for new residential construction in Florida during 2022
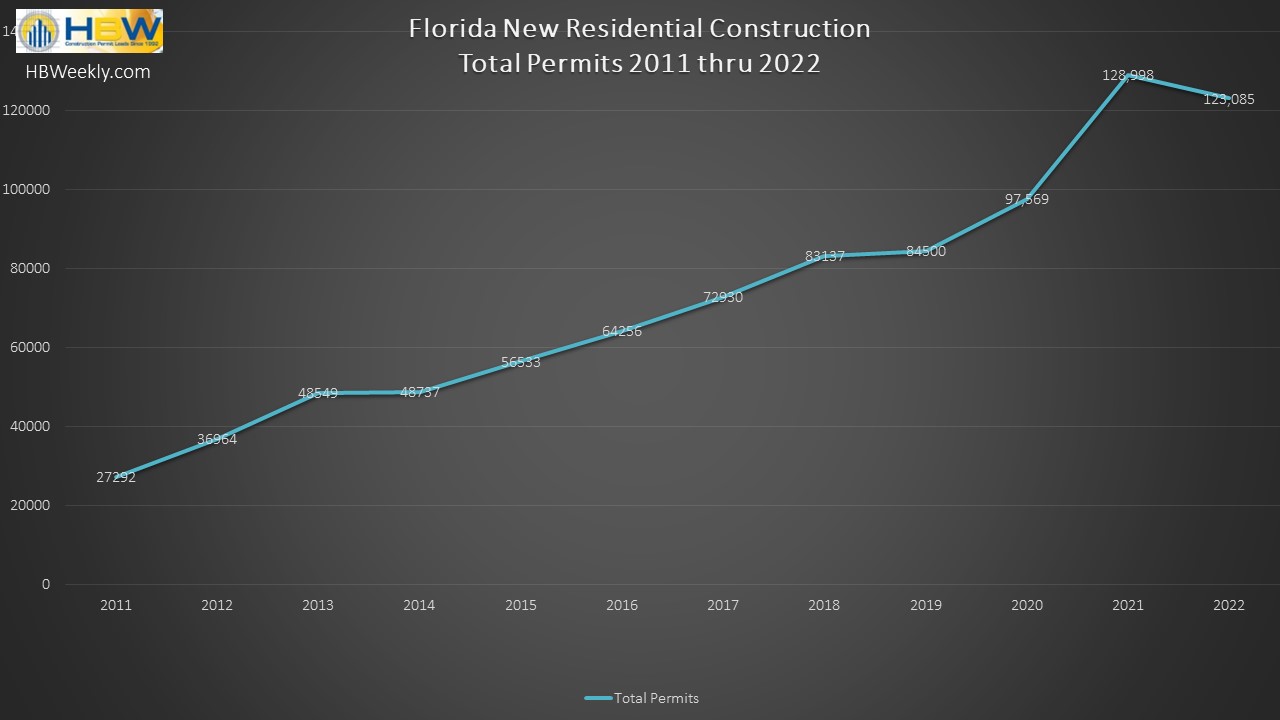
Based on HBW’s latest “Building Activity Trend Report”, new residential construction in Florida appears to have slowed over the last year. Since 2011, the market had been on upward trajectory, reflecting annual increases as high as 32 percent or more, but in 2022, the growth pattern took a downward turn. From January 1st to December 31, 2022, there was a 5 percent year-over-year decrease in new home construction in the Sunshine State, resulting in 123,085 new permits on record with HBW.
Out of the six major regions reviewed (Northwest, Northeast, Southwest, Southeast, West, Central), there was not a single area that exhibited growth over the last year. That being stated, the regions with the greatest concentration of new permits on record for the one-year period include West Florida (28,308 permits) and Southwest Florida (28,531 permits).
Here is a breakdown of the total residential construction permits, annual comparisons, and leading counties by Florida region in 2022:
Southwest Florida
Total permits: 28,531
% Change in total permits (in comparison to 2021): -3 percent
Top county for total permits: Lee (8,997 permits)
Total permits representing “high value” (>$500k) properties: 2,345 permits
West Florida
Total permits: 28,308
% Change in total permits (in comparison to 2021): -4 percent
Top county for total permits: Hillsborough (6,464 permits)
Total permits representing “high value” (>$500k) properties: 2,307 permits
Northeast Florida
Total permits: 23,454
% Change in total permits (in comparison to 2021): -3 percent
Top county for total permits: Marion (5,736 permits)
Total permits representing “high value” (>$500k) properties: 1,083 permits
Central Florida
Total permits: 18,822
% Change in total permits (in comparison to 2021): -0 percent
Top county for total permits: Orange (4,272 permits)
Total permits representing “high value” (>$500k) properties: 1,802 permits
Northwest Florida
Total permits: 13,065
% Change in total permits (in comparison to 2021): -7 percent
Top county for total permits: Bay (2,395 permits)
Total permits representing “high value” (>$500k) properties: 1,343 permits
Southeast Florida
Total permits: 10,905
% Change in total permits (in comparison to 2021): -16 percent
Top county for total permits: St. Lucie (4,537 permits)
Total permits representing “high value” (>$500k) properties: 1,655 permits
To gain more information on the builders, homeowners and permits for the construction activity above, check out HBW for your copy of the latest construction data reports. To gain access to the HBW database and receive custom and detailed reports on the latest residential and commercial building activity in Florida, Georgia, Texas, Alabama, and Oklahoma, please contact HBW for details.