In previous posts, we have covered a variety of benefits gained from using building permit data in business development efforts. From historical permit data used to identify prospective clients’ needs to the latest permit data helping to discover regional trends, building permit reports are a valuable tool in elevating a construction contractor’s business.
Today, we are looking at just a few of the many ways that contractors can use permit data to boost sales and fine-tune marketing efforts; here are a five to get you started:
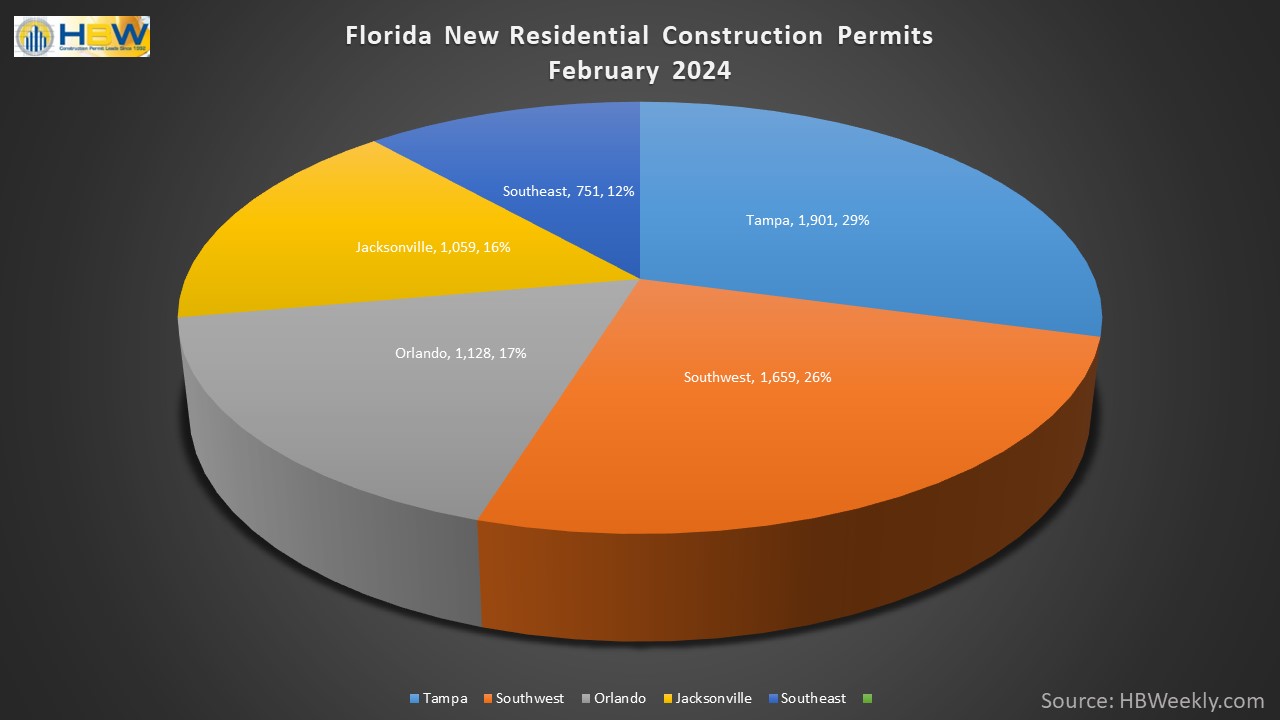
- Market Analysis – Contractors can analyze building permit data to identify trends in construction activity within specific geographic regions, enabling them to design and develop comprehensive targeted marketing efforts. Additionally, understanding the market can strengthen a contractor’s project planning – Building permit data offers valuable insight into the types of projects that are being planned and/or approved within a given area, and contractors can use this information to plan their own projects and schedules more effectively.
- Client Targeting – Building permit data can help contractors identify potential clients who have recently obtained permits for construction projects, allowing them to reach out with targeted marketing campaigns and services tailored to their needs. This is the same for historical permit data which can be used to identify properties that are due for services based on the age of the building or structural features.
- Competitive Analysis – Gaining a competitive edge in the market requires understanding the competition. Contractors can use building permit data to understand their competitors’ activities, such as the types of projects they have in the works or areas where they are focused, helping them develop strategies to stay competitive.
- Networking Opportunities – This is one area that is not talked about enough – networking and partnerships. Permit data can be used to identify key stakeholders involved in construction projects, such as developers, architects, and other contractors, providing opportunities for networking and collaboration. By creating partnerships with other major players in the industry, contractors can expand their reach and work with other industry experts to secure new projects.
- Risk Assessment – By reviewing and examining building permit data, contractors can better assess the level of competition and market saturation in various areas or sectors, enabling them to make informed decisions about where to focus their efforts and investments. Equally as important, permit data can also be used to identify regions where the predicted ROI would be low.
Contractors can use building permits and HBW construction data reports in a variety of ways to benefit their businesses. To get ahead of construction activity and gain access to the latest permitting data in Florida, Texas, Georgia, Alabama and Oklahoma, contact HBW for more information.