Warming Up to Cold Calling

The “Who”, “What” and “When” for cold calling success

With social media taking over our phones, and our lives, it can be easy to rely on social networks alone for reaching our audience.  Traditional and more costly methods for marketing can fall back in priority, and leads and potential revenue can easily be left on the table.  With texting and smartphones, it may appear that the only way to reach someone is through a viral post or personal text, but that couldn’t be more distant from the truth.  Cold calling is not a dinosaur yet, and it is still a viable option for reaching prospects.  The key to a solid marketing strategy is having a variety of effective touch points, delivered with intention and direction.  Even the greatest of social posts won’t have a view without being directed to an interested viewer.  The same goes for cold calls.  The “who”, “what” and “when” of the call will directly impact your conversion rate.

“Who” – Who you call is just as important as the content of your call.  Having qualified leads that are interested in your product or service will hold the greatest impact on your conversion rate.  There are many options for buying leads, but the quality and accuracy of the information is often not realized until you have embarked on a cold calling campaign.  For this reason, acquire your leads from trusted and reliable sources; moreover, they should be leads that are recent, fresh and are determined to be within your target market.  For example, home builders should have leads that are individuals and businesses looking for new construction, additions or renovations.  Leads through HBW cover all of your bases by having the latest permit data, so you know where your prospect is in the construction process, as well as accurate contact information and details that will ensure your dialing isn’t wasted.

“What” – In an ideal world, the person on the other end of the line has nothing but time to talk with you; realistically, you have less than 30 seconds (or less) to engage your listener, and what you communicate must be engaging and speak to their current interests and needs.  Build a script outline, but don’t read from it like an automated system; instead, use it as a guide for keeping you focused on your purpose and objective.  Your script should include a few sentences introducing you and your product/service.  Additionally, anticipate questions and potential rejection; be prepared with answers, and keep a positive attitude.  Not all openings will work for every prospect, so be flexible and adjust as you identify which methods and approaches have the most favorable outcomes.

“When” – Timing is everything – really!  Think about it… You don’t know the mood of the person on the other end of the line or what events may be taking place in his/her day.  They could have just had a bad day at the office or be in the process of driving, talking to a client or eating dinner – so don’t take responses or rejection personally.  Instead, try to schedule calls at a time that increases the likelihood of their availability.  For example, midweek (Wednesday or Thursday) is a better time to reach leads in comparison to when they are gearing up for the weekend (Friday) or just starting their week (Monday).  Avoid calls during dinner and lunch hours, and start out with the standard morning or late afternoon timeframe.  Ultimately, your results will begin defining the best timing for your business, so be sure to have an effective tracking tool, system or software in place that will enable you to run analytics on calls.  The same principles will apply to your follow up on returned calls – When leads return a call from a previous conversation or message, respond quickly and within the same day while their interest is at its peak.

While cold calling isn’t the only way to reach your prospects, it is still very much alive and well and can be an effective tool to add to your marketing tool box.   By having targeted leads and directed information at the ready, your cold prospects will become warm clients down the road.

For more information on construction business and marketing tips, stay connected with the HBW Blog.  To get ahead of construction activity and gain access to the latest permitting data in Florida, Texas, Georgia, Alabama and Oklahoma, contact HBW for more information on construction data reports and industry leads.

HBW Report: New Swimming Pool Construction in Florida – June 2017

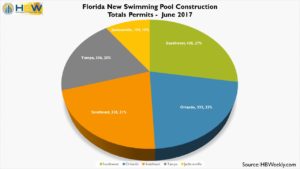
To have solid leads, you need to keep them fresh, and if you’re looking for the latest on swimming pool construction in Florida, then look no further than HBW’s construction data reports.  Using the swimming pool permit reports, we found more than 1,500 new permits and an excess of $68M in value for the month of June.  Out of the five major regions reviewed (Orlando, Jacksonville, Tampa, SE and SW), Southwest Florida remains the leader for the most new swimming pool construction activity across the state.

Since May, Orlando bumped up one spot to be the second hottest place for new swimming pool construction, while the southeast region slipped down one spot, ranking third for total swimming pool starts last month.

Here is a quick look at the latest permitting activity for swimming pools in Florida…

FL Pool Permits by Area – June 2017

The southwest region of Florida continues to be a popular spot for swimming pools.  In June, there were nearly 430 new pool starts with a construction value in excess of $19.5M.  The counties of Lee (178 permits) and Collier (105 permits) held more than half of all new construction activity for the month.  And while Aragon Pools and Spas dominated the area for total permits, Pinnacle USA and Aquadoc were also leading a healthy heap of new projects.

Moving to the central portion of the state, Orlando was up one spot since May and ranked second for new pool construction last month.  Out of the 335 pool starts and nearly $16M in construction value, close to 40% of all new swimming pool construction took place in the city-center county of Orange.  All Seasons Pools continues to be a builder of choice at it took top spot for the most new permits of any local builder in June.

Having slipped down one spot since May, the southeast region was close to Orlando for total permits with 328 pool starts and nearly $14M in construction value last month.  More than half of all new pools were started in South Florida’s highly populated county of Miami-Dade (90 permits) and expansive region of Palm Beach (106 permits).  Pool builders leading the latest starts included A&G Concrete Pools, Pools by Greg and RHR Pools.

Tampa is a place that has been gaining quite a bit of attention for its growth and increased popularity.  Last month, there were more than 300 new swimming pool starts with a total value of nearly $13M.  The larger county of Hillsborough carried more than 38% of new pool construction activity with 117 new permits on file for the month.  Local pool builders leading new construction in the area for the month include Olympus Pools, Tampa Bay Pools and Natural Springs Pools.

Finally, we took a look at the northern-most region of Jacksonville.  New pool construction and value in Jacksonville was lower than any other major area reviewed last month.  Out of the more than 150 pool starts and approximately $6M in construction value, the bulk of new permits originated from the two counties of St. Johns (63 permits) and Duval (45 permits).  Pool builders that had the greatest concentration of starts for the month include Surfside Pools and Spas, Blue Haven Pools and Stanley Pools.

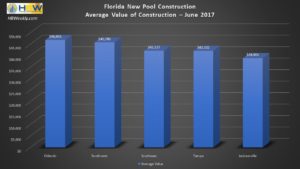
As far as the average value of pool construction in Florida is concerned, the range has remained somewhat consistent over the last couple of months, having a maximum value of just about $46k.  In June, Orlando held the highest average value and was on target with figures from May at $46,856, while Jacksonville was at the other end of the spectrum with an average value of $38,905.

FL Average Value of Pool Construction – June 2017

Information utilized for the graphs and above listed figures for swimming pool construction in Florida was directly derived from HBW construction data reports. To gain access to the HBW database and receive custom and detailed reports on the latest residential and commercial building activity in Florida, Georgia, Texas, Alabama, and Oklahoma, please contact HBW for details.


HBW Report: Florida New Residential Construction – June 2017

FL Residential Construction Permits – June 2017

Out of the nearly 5,000 housing starts in Florida last month, Orlando jumped one spot since May to lead the state for total new permits on file with HBW.  Out of the hundreds of active builders last month, D.R. Horton and Lennar Homes were leading builders in the five major regions reviewed (Orlando, Tampa, Jacksonville, SW, SE).  From top builders to top counties, here is the latest review of new construction in the Sunshine State during the month of June:

Orlando

Out of the 160 active builders in the Orlando area last month, there were more than 1,300 housing starts with a total construction value of nearly $380M.  Close to half of all new residential construction activity took place in Orange County (633 permits), where the average value of new construction was 17% higher ($339.5M) than the average for the Central Florida area.  The breakdown for new home construction for the month is as follows:

Total Housing Starts: 1,311

Average Value of Construction: $289,195

Top County for Total Permits: Orange County (633 permits)

Top Builders for Total Permits: D.R. Horton (137 permits); Lennar Homes (108 permits); KB Homes (68 permits)

Tampa

There were more than 180 active builders on file with HBW in the Tampa area last month.  Out of the more than 1,150 housing starts and ~$304M in value, new construction was highest in the larger County of Hillsborough (438 permits) where the average value of construction was approximately 17% higher than new construction across Tampa for the one-month period.  Here is a breakdown of housing starts in June:

Total Housing Starts: 1,158

Average Value of Construction: $262,529

Top County for Total Permits: Hillsborough County (438 permits)

Top Builders for Total Permits: D.R. Horton (135 permits); Lennar Homes (119 permits); MI Homes (62 permits)

Southwest Florida

The southwest region ranked third for total new residential construction permits for the month of June.  Approximately 200 home builders were active in the area last month having close to 1,100 housing starts and $278M in total construction value on file with HBW.  Higher concentrations of new construction could be found in Lee County where there were more than 380 housing starts that carried an average value 15% lower than the average across the region.  While Lennar Homes had the most new residential permits on file for the month, D.R. Horton was a close second for total starts having 125 new permits pulled for the one-month period.

Total Housing Starts: 1,088

Average Value of Construction: $255,576

Top County for Total Permits: Lee County (381 permits)

Top Builders for Total Permits: Lennar Homes (136 permits); D.R. Horton (125 permits); Taylor Morrison (70 permits)

Jacksonville

From the more than 125 active builders in the Jacksonville area last month, there were 840 new residential permits with total value in excess of $203M on file with HBW.  Just about 75% of all new construction took place in the counties of St. Johns and Duval, two areas that have consistently been leading for new residential construction this year.  Here is a closer look at housing starts in the area last month:

Total Housing Starts: 840

Average Value of Construction: $241,727

Top County for Total Permits: St. Johns County (318 permits)

Top Builders for Total Permits: D.R. Horton (135 permits); Dream Finders Construction (72 permits); Lennar Homes (62 permits)

Southeast Florida

While the total for new residential construction permits was lowest in the southeast region, the average value of construction was just above Orlando at more than $290k.  Out of the 150 active home builders for the month, Lennar Homes pushed out on top for total housing starts.  From a county perspective, new residential construction activity was highest in Miami-Dade and Palm Beach Counties.  Here’s a closer look at new home building activity in June:

Total Housing Starts: 585

Average Value of Construction: $290,572

Top County for Total Permits: Miami-Dade County (156 permits)

Top Builders for Total Permits: Lennar Homes (89 permits); D.R. Horton (81 permits); Kolter Signature Homes (61 permits)

Information utilized for the graphs and above listed figures for Florida residential construction was directly derived from HBW construction data reports. To gain access to the HBW database and receive custom and detailed reports on the latest residential and commercial building activity in Florida, Georgia, Texas, Alabama, and Oklahoma, please contact HBW for details.

Solar Required in South Miami

If you are building new homes or renovating existing residential structures in South Miami, be prepared to install solar.

When we hear “solar”, most of us think of the sun, and when we think of sun, it is easy to think of the Sunshine State.  Despite the fact that Florida is known for sunshine, it has not been the most active state when it comes to solar requirements and installations.  According to the Solar Energy Industries Association (SEIA), Florida doesn’t even make the top ten for the amount of solar capacity installed in 2016.  That being said, the Sunshine State did “shine” as it ranked #5 for total solar jobs nationwide and has shown signs of growth in solar having bumped up two spots since the previous year for total solar capacity.

Overall, solar appears to be gaining in popularity in Florida, and as of this week, it has even become a requirement in a city to the south.  On July 18, 2017, the City of South Miami passed a new law that will require all new home construction (and even some residential renovations) in the city to include solar panels.  Why is this newsworthy you ask?  Well, it is the first law of this level for solar in Florida – a breakthrough for sustainable construction and alternative energy for the state.  From a nationwide perspective, this new law puts South Miami on the map for renewable energy as it has just become the 4th U.S. city (and the first city outside of California) to require solar panels on new homes. The law will go into effect in just a couple of short months (September 18, 2017).

For our Florida home builders, it is important to know what this new law means for residential construction in South Miami.  Under the new rules, there are new requirements for both new residential construction and home renovations.  The requirements for solar are as follows (source: Miami Herald):

  1. New Construction (including single-family homes, townhouses and multi-story residential buildings) – 175 sq. feet of solar panel must be installed per 1,000 sq. feet of sunlit roof area OR 2.75 kw per 1,000 sq. feet of living space (whichever is less).
  2. Home Renovations – Any residential renovation that replaces more than 75% of the current structure or extends the current living space by more than 75% will also be required to meet the above listed rules.

With Florida ranking third for its potential to draw power from the sun (source: SEIA), the new law in South Miami may just be the beginning of solar requirements in Florida.  With so much potential, it could just be a matter of time before surrounding cities catch a ride on the renewable energy wave.  Thanks to South Miami raising the bar, things are looking up for solar and new construction is getting a little brighter in the Sunshine State.

For more information on construction trends, business and marketing tips, stay connected with the HBW Blog.  To get ahead of construction activity and gain access to the latest permitting data in Florida, Texas, Georgia, Alabama and Oklahoma, contact HBW for more information on construction data reports and industry leads.

Texas Home Building Report – June 2017

HBW Report: The latest residential construction permit data across the Lone Star State

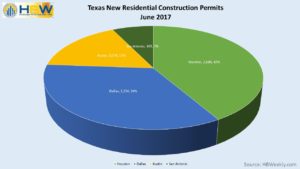
TX New Residential Construction Permits – June 2017

From D.R. Horton’s dominance in Dallas to the high concentration of housing starts in Houston, summertime in Texas is looking like home building time.  While there was a dip in total starts in comparison to May, home builders were active throughout the state as there were nearly 6,500 new residential construction permits and approximately $1.6B in total value on file with HBW for the month of June.

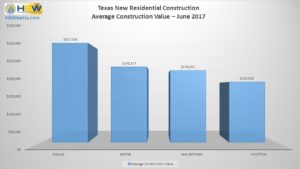
Out of the four major metro areas reviewed (Houston, Dallas, Austin, San Antonio), Houston maintained top spot for total housing starts having nearly 2,700 new permits and approximately $519M in total construction value for the month.  And while Houston had the highest concentration of new residential construction permits, it carried the lowest average value of new construction at $193k.  On the other end of the spectrum, Dallas continued to hold the highest average value of new residential construction at more than $317k, resulting in more than $700M in total construction value across Dallas in June.

TX Average Value of Resid. Construction – June 2017

Here is a closer look at home building activity in Texas during the month of June:

Austin

Total Housing Starts: 1,074

Total Value of Construction: $259M+

Top County (for total permits): Travis County (675 permits, $160M total value)

Top Builder: KB Homes (108 permits)

Average Value of Construction: $241,177


Dallas

Total Housing Starts: 2,234

Total Value of Construction: ~$709M

Top County (for total permits): Collin County (928 permits, $318.3M total value)

Top Builder: D.R. Horton (342 permits)

Average Value of Construction: $317,334


Houston

Total Housing Starts: 2,688

Total Value of Construction: ~$519M

Top County (for total permits): Harris County (1,340 permits, $266.3M total value)

Top Builder: D.R. Horton (211 permits)

Average Value of Construction: $193,051


San Antonio

Total Housing Starts: 469

Total Value of Construction: ~$108M

Top County (for total permits): Bexar County (245 permits, total value: >$57M)

Top Builder: KB Homes (60 permits)

Average Value of Construction: $229,651

Information utilized for the reports and graphs for Texas residential construction was directly derived from HBW construction data reports. To gain access to the HBW database and receive custom and detailed reports on the latest residential and commercial building activity in Florida, Georgia, Texas, Alabama, and Oklahoma, please contact HBW for details.

Hot Home Trends – Predictions from Pantone

Keeping an eye on design trends, now and in the not so distant future.

We are only in summer of 2017, and the home building trend crystal ball is already glowing.  Designers and trend watchers are getting 2018 buzz going when it comes to home design and patterns, and we are here to review and share some of Pantone’s predictions.

While home trend predictions are far from an exact science, much of it is based on real data.  And while Pantone was once known for just choosing the color of the year (with exceptional accuracy), in recent years they have positioned themselves as experts in general home design predictions, now including seasonal colors and home décor.  Pantone doesn’t just pull a color out of the hat so to speak; it actually researches and analyzes trends worldwide and over two years in advance of releasing their predictions.  They gather information from pop culture, architecture, consumer goods, current events and trends, and as they described on their website, they provide “a color snapshot of what we see taking place in our culture that serves as an expression of a mood and an attitude.”

In addition to those in the fashion industry, Pantone’s predictions prove to be valuable to the home design and décor industry as well.  Along with being ahead of the trend, having such data can help you guide your trend-conscious clients in the right direction.  From Realtor.com to Elle Décor, publishers in our industry have been sharing Pantone’s latest predictions since Pantone’s Executive Director (Leatrice Eiseman) announced expected color and design trends for 2018 at the International Home and Housewares Show in Spring.  Here is some of what we have found as it relates to home builders and designers:

  1. Shine – As many trend watchers are aware, metallics have been on the scene for quite some time now. That being said, predictions point to shiny metallics as classics that are now seen to be in similar classification as neutrals.  Other shiny surfaces such as iridescent, pearl and translucent materials are eye-catching and will be unavoidable in the upcoming year.
  2. Typography – When colors and images don’t make a statement, stylists are bringing in words. Words and text have been on the home décor scene for some time now, and although they are less of a centerpiece and more of a complementary addition, you will most likely continue to find them incorporated on pillows, in art pieces and murals.
  3. Geometric Design – There was buzz of textures and geometric designs in wallpaper this year, and it looks like the latest predictions have included shape driven patterns once again. While such patterns can easily be incorporated in fabrics, walls and wall art will also carry geometric patterns with the coming trends.
  4. Earthy – Blame it on technology or the speed of our lives, but there has been a significant shift in interest with emphasis on getting back to basics. Think raw wood, wood floors and wood home accents including walls and ceilings.  Sustainability and the idea of getting back to nature has and is expected to continue to find its place in home design.  On the décor front, fringes on fabrics from curtains to blankets will also become more prevalent.
  5. Bold – Intense colors appear to be on the menu in the next year, of course with iridescent and pearl accents. Color groups ranged and were represented through a group of eight varieties. Intense colors have been predicted across a spectrum including fun and whimsical bright yellows and greens to vibrant and peacock feather like blues and greens, fuschia and purple shades.

For more information on construction trends, business and marketing tips, stay connected with the HBW Blog.  To get ahead of construction activity and gain access to the latest permitting data in Florida, Texas, Georgia, Alabama and Oklahoma, contact HBW for more information on construction data reports and industry leads.
5 Ways to A+ Testimonials

Solid testimonials that are shared at the right time and place can boost sales and your business reputation.

Many people will say that word of mouth referrals are the best referrals to get.   When good things are being said about your business, word can travel quickly, but getting the word started in some ways is up to you.  How do we get those referrals?  Well, the obvious answer is producing a top-notch final product and service, but great service and high-quality performance won’t get you there alone.  You must provide opportunities for customers to share your good work and the positive experience they had with your company.

Here are 5 ways to get and gain the most out of testimonials from your clients:

  1. Find Your Stars – Rather than just asking every client for a testimonial, identify your star clients. Whether it is a high-profile individual or business or the project was your largest and most impressive to date, make a list of the clients and projects that best represent your top work.
  2. Make it Personal – Once you have identified your star projects and clients, make a personal “ask” for a testimonial. Talk to your customer about why their feedback is important and where you will share it. Let your client know their value and your appreciation for their business and time.
  3. Make it Easy – Not everyone wants or has the time to write a testimonial, so an online survey that is directed to acquiring the most important information needed can make it easier to develop well-rounded testimonials. “Great job” or “nice work” is not going to set you apart from the competition.  For this reason, your survey or the questions you ask your clients should specifically address your service or product.  Rather than just asking for a testimonial, ask:
    1. How competitive was our pricing compared to others?
    2. What is the greatest benefit of using our company?
    3. Did you find our team and crews to be professional?
    4. How quick was our response time to questions, and how helpful was customer service?

By providing a guide on the feedback you need most, you will increase the probability of getting the key words and endorsements you are seeking.

  1. Clean it Up – Not every client will have impeccable writing skills, so don’t be afraid to make appropriate edits. Along with the obvious corrections to spelling and grammatical errors, you may find the need to paraphrase in order to focus your message. That being stated, make sure to get sign off and approval from the customer before publishing new and improved versions of their testimonial.
  2. Be Real – Testimonials must be real, and while you may be getting authentic feedback from your customers, the presentation of it may not look as authentic as necessary. In other words, source your testimonials.  A full name, location, company name and picture is ideal, but not all customers will want to make their personal information public on websites and social media. In such cases, offer their business name and a website link to help drive traffic to their site; perhaps a logo instead of their photo will be more appealing.

Once you have finalized your testimonials and thanked your customers, now it’s time to share them with your HBW leads and prospects.  From your flyers, email blasts, social media pages, websites and more, your satisfied clients’ endorsements will be a welcome addition to your marketing efforts.

For more information on construction business and marketing tips, stay connected with the HBW Blog.  To get ahead of construction activity and gain access to the latest permitting data in Florida, Texas, Georgia, Alabama and Oklahoma, contact HBW for more information on construction data reports and industry leads.
Texas New Swimming Pool Construction Report – May 2017

A review and report on the latest swimming pool construction in Texas for the month of May.

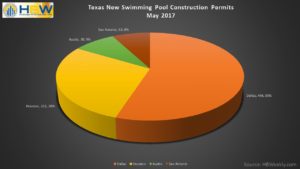
TX New Swimming Pool Permits by Area – May 2017

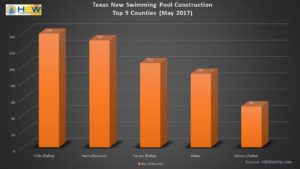
With the summer temperatures rising, so do the new swimming pool permits and leads with HBW.  In May, more than 800 new swimming pool permits were added to the HBW database for the Lone Star State.  Out of the four major metropolitan areas reviewed (Dallas, Houston, Austin, San Antonio), Dallas is experiencing the most new swimming pool construction.  More than half (55%) of all activity took place in the Dallas area as there were close to 450 pool starts and $20M in total construction value for the month.  The bulk of Dallas pool construction took place in Collin, Tarrant and Dallas counties, all making the top five counties list for the month.

TX Top 5 Counties for Pool Permits – May 2017

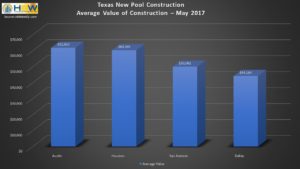
And while Dallas had the greatest number of total new permits, it ranked lowest for average value of construction at just over $44k.  On the other end of the spectrum, pool value was at a high in Austin (average value: $61,850), especially in Travis County where the average value of new pools started exceeded $71k.  The average value of pool construction was also on the higher end in Houston.  With 232 permits and an average value just over $60k, Houston ranked #2 for both average value and total pool starts in May.  More than half of all new pool construction in the Houston area took place in Harris County, where there were 131 pool starts and close to $9M in new construction for the one-month period.

TX Average Value of Pool Construction – May 2017

As with every construction report, we like to take a look at and recognize the local builders in each region who are leading the latest starts.  The #1 builders for total swimming pool starts during the month of May are as follows:

Dallas: Hauk Custom Pools

Houston: Anthony & Sylvan Pools

Austin: Cody Pools

San Antonio: Keith Zars Pools

Information utilized for the graphs and above listed figures for swimming pool construction in Texas was directly derived from HBW construction data reports. To gain access to the HBW database and receive custom and detailed reports on the latest residential and commercial building activity in Florida, Georgia, Texas, Alabama, and Oklahoma, please contact HBW for details.

Florida New Residential Construction At-A-Glance (May 2017)

With a month-over-month increase of 25%, Florida residential construction saw spikes in all regions across the state during the month of May.

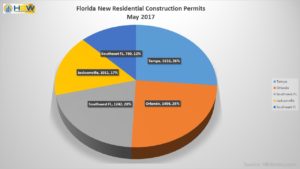
FL New Resid. Permits by Area – May 2017

While all of us expect to see fireworks this holiday weekend, not everyone was planning for the fireworks happening in Florida’s booming residential construction market.  In May, there were 6,125 housing starts with a total value of approximately $1.7B throughout the Sunshine State (25% month-over-month increase).  Out of the hundreds of active builders contributing to the rise in activity, Lennar Homes and D.R. Horton took the lead for having the most residential permits on file with HBW for the given period.

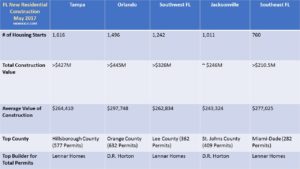
Although all regions reviewed (Tampa, Orlando, Southwest, Southeast, Jacksonville) exhibited impressive month-over-month increases ranging from 8% to 42%, Orlando was in the spotlight for its construction growth since April; as a result of a 42% month-over-month increase in new residential construction, Orlando moved up one spot in rank to #2 for total permits with nearly 1,500 housing starts and more than $445M in total construction value.  Additionally, Orlando ranked highest for average value of construction at nearly $300k.

The Tampa area was also noteworthy, as it continued to hold its lead as the number one spot for housing starts. In May, there were more than 1,600 housing starts with a total construction value in excess of $427M in Tampa, reflecting a month-over-month increase of just over 30%.  The county of Hillsborough (Tampa) ranked second statewide for total housing starts having 577 new residential construction permits with a total value of approximately $190M on file.

Other areas reviewed were ahead of April as well… Having an 8% month-over-month increase in residential construction, the southwest region ranked third highest for total housing starts (1,242 permits) for the month.  Not far behind, Jacksonville experienced a healthy spike of 23% in housing starts resulting in more than 1,000 new permits and approximately $246M in total construction value.  And while the southeast region experienced less housing starts than all other areas, it was still ahead of April by 20% having 760 new permits and more than $210.5M in construction on file with HBW for the month.

Here’s a detailed look and comparison guide for new residential construction in each Florida region during the month of May:

Information utilized for the graphs and above listed figures for Florida residential construction was directly derived from HBW construction data reports. To gain access to the HBW database and receive custom and detailed reports on the latest residential and commercial building activity in Florida, Georgia, Texas, Alabama, and Oklahoma, please contact HBW for details.

Florida New Pool Construction Review – May 2017

When looking for leads in new swimming pool construction, look no further than HBW’s latest construction data reports.  Here’s the latest on new pool construction in the Sunshine State…

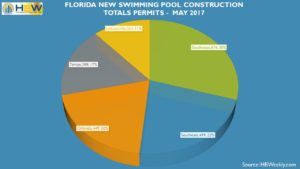
With summertime comes the summer heat, and there is no better way to cool off than by splashing into a new pool.  And while we are not diving into pools right now, we are diving into pool reports for Florida.  With more than 2,270 swimming pool starts last month, there will be plenty of home owners cooling off with new pools and in need of maintenance and other services.

FL Pool Permits by Area – May 2017

Pool builders in the southwest region of Florida were leading the state for new construction having close to 675 swimming pool starts and more than $27.6M in construction value for the month.  More than half of all construction took place in Lee (203 permits) and Collier (175 permits) counties, but there was a healthy dose of new construction activity in all major counties reviewed.  Out of the 130 or so active pool contractors on file for the month, Aragon Pools and Spas was a standout in the southwest and led for total pool starts with more than 110 permits on file for the one-month period.

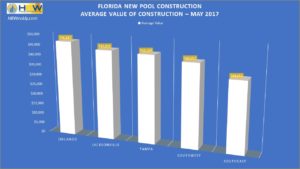
Southeast Florida ranked second highest for new pool construction last month, having nearly 500 new permits and more than $17M in construction value last month. While real estate value in the area is usually much higher than other regions in the state, the average value of new pool construction was at the lower end at just $34,651.  Swimming pool construction in Palm Beach and Miami made up the bulk (72%) of all pool starts last month, and out of the 163 active contractors on file for the month, A&G Concrete Pools ranked #1 for total starts having nearly 30 permits for the one-month period.

Orlando pool builders were most certainly busy in May.  There were nearly 450 swimming pool starts in Central Florida last month totaling more than $21M in construction value.  New pool construction in Osceola (163 permits) and Orange (136 permits) accounted for more than half of all new activity.  Out of the more than 80 active builders on file for the given period, All Seasons Pools took top spot, having the most permits on file with 65+ pool starts.

Coming in close to Orlando’s totals, the Tampa area had just about 390 swimming pool starts and more than $16.7M in total construction value last month.  The larger county of Hillsborough had the highest concentration of new pool construction activity with 130 starts and more than $6.5M in new pool construction taking place there.  Out of more than 105 active pool builders in the area, construction was widespread and led by companies including Tampa Bay Pools (31 permits), Gulfstream Pools & Spas (26 permits) and T&D Pool and Spa Construction (22 permits).  While the average value of pool construction was on the higher end (>$55k) with Tampa Bay Pools, the average value of construction in the area was just over $43k.

Finally, we took a look at new pool construction in Jacksonville.  And while the northern-most metro area of Florida did not have the highest count of new pools for the month (261 permits), the area was second highest for average value of construction at $43,851.  The highest concentration of new pool construction was found in St. Johns County (106 permits), and Duval County ranked second highest for total pool starts with more than 75 permits on file for the month.  Out of just about 75 active builders in the area in May, Blue Haven Pools (20 permits), Surfside Pools and Spas (17 permits) and Pools by John Clarkson (14 permits) ranked at the top for total starts.

FL Average Value of Pool Construction – May 2017

Information utilized for the graphs and above listed figures for swimming pool construction in Florida was directly derived from HBW construction data reports. To gain access to the HBW database and receive custom and detailed reports on the latest residential and commercial building activity in Florida, Georgia, Texas, Alabama, and Oklahoma, please contact HBW for details.