If you haven’t already set your plans for holiday marketing, then now is the time. The holiday season is right around the corner, and it is the perfect time to plan your happy holiday wishes to current clients while providing holiday “gifts” and offers that are perfectly wrapped for the season.
According to the Conference Board, Consumer Confidence Index (CCI) figures are at an 18-year high. In recent months, the CCI increased in September, following a large improvement in August. Consumers’ assessment of current conditions remains very favorable and is bolstered by a strong economy and healthy job growth. According to Lynn Franco, Director of Economic Indicators at The Conference Board: “The historically high confidence levels should continue to support healthy consumer spending and should be welcome news for retailers as they begin gearing up for the holiday season”. (Source: Conference Board)
With the economy and consumer confidence levels in your favor, you should be gearing up to take advantage of this positive position in the form of holiday marketing strategy. Here are a few areas to review and sharpen as you plan for the season ahead:
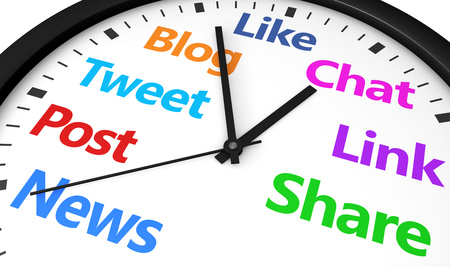
1 – Focus on Social Media – As recently published by Mobile Marketer, social media ranks #1 for holiday ad spending. In the study reviewed, FaceBook was determined to be the most popular social media platform with nearly 42% of SMBs stating that they will primarily spend on the social network (followed by Google – 28%), and more than a third (36.4%) of advertisers will allocate the majority of their holiday ad budgets to social media, followed by email marketing (15.2%).
2- Make Content Count – Generic messages and predictable holiday notices will most likely fade into the background of the many similar announcements that your target audience will receive throughout November and December. For this reason, your email subscribers and social media followers should receive content that is of value to them and makes them want to share it with others. Whether it is something truly unique and entertaining or tips and technology that they will find useful, make sure your content matters. Of course, one-of-a-kind gift ideas, packages and holiday discounts and deals will also be enticing for the holiday shopper.
3 – Make Sharing Easy – Don’t assume that because your email has been “opened” or your social post was scheduled that you have made the most of this opportunity. Your campaigns must be easy to share, and with a few minor adjustments you can increase the likelihood of expanding your reach. This can be done by adding social share icons to the top of your e-newsletters, encouraging shares and retweets, asking followers to tag friends, and keeping the main message at the front of the post so that it can be quickly and easily viewed.
4 – Be Authentic – With the many automation tools available, it is easy to just let technology handle your campaigns for you, but you should resist the urge. To be unique, it is important that you add a personal touch, and while automation tools make it easy to keep your accounts active, it will benefit you to be deliberate with your posts, customizing them to your audience and each distinct social network.
5 – Join the Holiday Cheer – From your customers to your suppliers, there are bound to be plenty of holiday conversations and posts being generated that relate to your business. Join the conversation by sharing others’ posts that can link back to your services, as well as respond to customer feedback and industry conversations; offer your expertise, solutions and packages that will meet their needs long after the holiday season has ended.
For more information on construction business and marketing tips, stay connected with the HBW Blog. To get ahead of construction activity and gain access to the latest permitting data in Florida, Texas, Georgia, Alabama and Oklahoma, contact HBW for more information on construction data reports and industry leads.