
A quarterly review of new swimming pool construction permits in Florida through the second quarter of 2018.
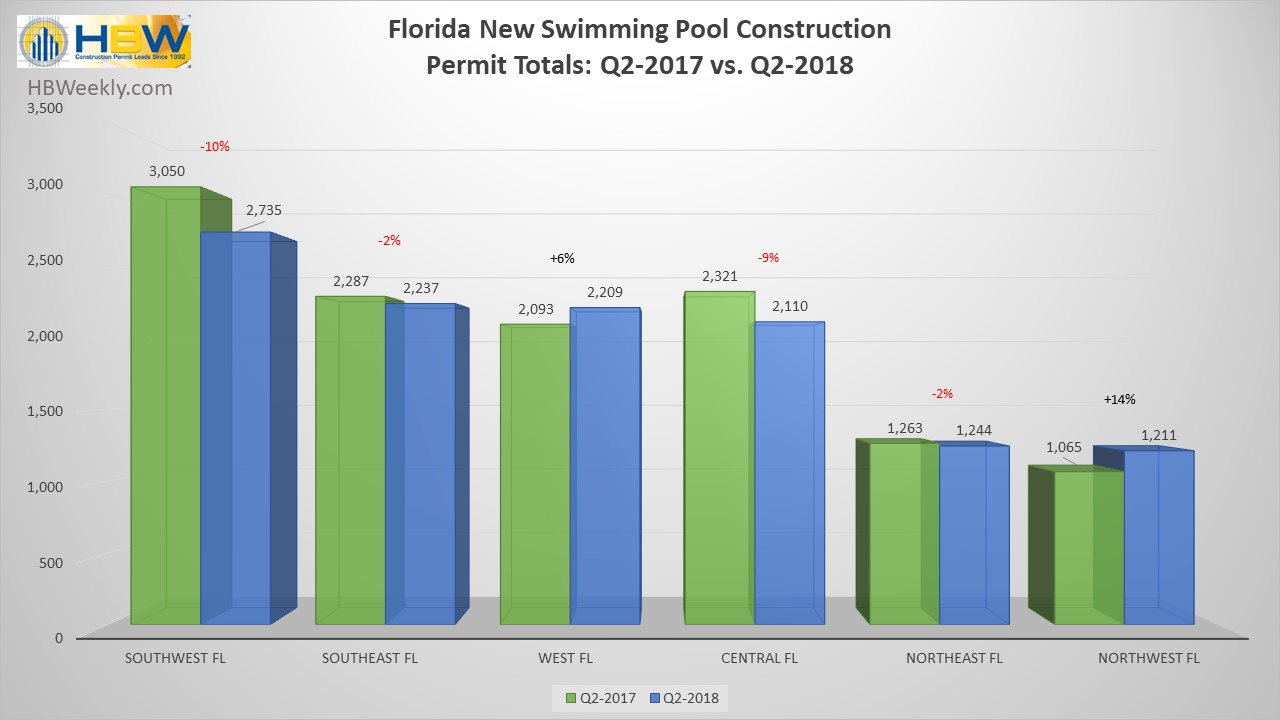
FL New Pool Permits by Area thru Q2 – 2017 vs. 2018
The western and northwestern regions of Florida had a healthy dose of new swimming pool construction in the first half of this year. Both regions have reflected an annual growth pattern in pool construction over the last five years, and through Q2 of this year the west and northwest have demonstrated year-over-year increases of 6% and 14% respectively.
Overall, the Sunshine State is slightly behind last year’s swimming pool construction figures. Since the start of this year (through Q2), Florida has experienced a 3% year-over-year decrease in pool starts. Every region reviewed, with the exception of the west and northwest, has experienced dips in new swimming pool construction ranging from 2% to 10%.
Across the state, there have been approximately 11,750 new pool permits added to the HBW database through Q2-2018, and while the southwest region has experienced a 10% year-over-year decrease in construction so far, it still holds the highest concentration of pool starts (2,735 permits).
Other areas that carried higher concentrations of new pool permits through Q2 include the southeast and west. Southeast Florida is slightly below last year’s construction figures having a 2% year-over-year decrease so far and approximately 2,240 pool starts on file for the six-month period. As previously mentioned, the west portion of Florida is 6% ahead of last year (thru Q2) which resulted in it ranking third highest for total new permits having 2,210 pool starts for the given period.
Not far behind the West, Central Florida ranked #4 for swimming pool construction. While new pool construction has been on the rise in Central Florida since 2014, the first half of this year reflects a slower market resulting in a 9% year-over-year decrease and 2,110 pool starts through June.
When reviewing and breaking down new pool construction from a county perspective, there were a few counties that made our “ones to watch” list for their annual increase in new construction activity. The Florida counties that have show marked increases in pool construction in the first half of this year are as follows:
- Hillsborough County (West) – Pool construction in Hillsborough has been on the rise for nearly five years and this year is no exception. Through Q2, Hillsborough has experienced a 16% year-over-year increase in swimming pool starts, resulting in more than 780 new permits on file.
- Lee County (SW) – Since 2017, pool construction figures have been climbing in Lee County. Through Q2, Lee County has more new pool permits (~1,075 permits) on file than any other Florida County, reflecting a 7% year-over-year increase in new swimming pool construction
- Brevard County (Central) – While the total number of permits is lower in Brevard County (455 permits), a fairly new growth pattern is developing – Pool construction has picked up in Brevard over the last couple of years. In 2017, the area experienced a 34% year-over-year increase in pool starts, and through Q2 of this year, Brevard is already reflecting a 26% year-over-year increase, making it our third pick for “ones to watch”.
To gain more information on the builders, homeowners and permits for the construction activity above, check out HBW for your copy of the latest construction data reports. To gain access to the HBW database and receive custom and detailed reports on the latest residential and commercial building activity in Florida, Georgia, Texas, Alabama, and Oklahoma, please contact HBW for details.