Ways to Beat the Heat

With summertime comes summer heat, and there is no time like the present to prepare your crews for proper safety on the job site during the hottest months of the year.

Summer time temperatures are beginning to creep up on us, and before you know it, crews will be working in high and often dangerous temperatures.  For this reason, it is important to refresh your team on heat safety and get heat and preventative measures on their radar.

According to OSHA, every year dozens of workers die and thousands more become ill while working in extreme heat or humid conditions. Moreover, 40%+ of heat-related worker deaths occur in the construction industry, and conditions are not just limited to dehydration; there are a variety of heat illnesses and they can affect anyone, regardless of age or physical condition.

Under OSHA law, employers are responsible for providing workplaces free of known safety hazards, and extreme heat is considered a significant hazard.   In order to educate employers and the public, OSHA runs a campaign (Water.Rest.Shade) with the intention of keeping more workers safe under high heat conditions.  An employer should establish a complete heat illness prevention program that includes but is not limited to:

  • Providing workers with Water, Rest and Shade.
  • Having a plan for new or returning workers to gradually increase workloads and take more frequent breaks as they adjust or build their tolerance for working in high heat conditions.
  • Planning ahead for heat related illnesses, injuries and emergencies; making sure all team members are equally and properly trained to handle potential scenarios.
  • Have the site supervisor monitor workers for signs of heat related issues or illnesses.

To monitor the most common of symptoms for serious heat related illnesses, OSHA created a simple go-to reference guide covering symptoms and first aid measures that should be taken if a worker shows signs of a heat-related illness.  The full chart can be found by visiting their list of symptoms here.

While recognizing symptoms can be life-saving in certain situations, prevention is the best way to stay ahead of heat stroke and other illnesses.  The most direct way to do this is simple: Keep the work environment cooler.  Depending on the location of your workers, you may be able to incorporate only a few of the preventative measures, but every effort counts.  OSHA lists a variety of engineering controls that can reduce workers’ exposure to heat, and they are as follows:

  • Air conditioning (such as air-conditioned crane or construction equipment cabs, air conditioning in break rooms).
  • Increased general ventilation.
  • Cooling fans.
  • Local exhaust ventilation at points of high heat production or moisture (such as exhaust hoods in laundry rooms).
  • Reflective shields to redirect radiant heat.
  • Insulation of hot surfaces (such as furnace walls).
  • Elimination of steam leaks.

In addition to keeping the environment and conditions as cool as possible, employers should have a clear emergency plan in place, as well as ensure that drinking water is always replenished and close to the work area.  Employers may also want to consider rotating work/rest cycles with crews and scheduling heavier outdoor work for cooler times of the day (morning).  Individual team members can also rotate job functions and alternate their jobs to minimize over exposure to high heat conditions on any one individual.  As with any safety plan, first aid practices should be clearly understood and demonstrated by your team, and all personal protective equipment (coolmax clothing, wide brim hats, sunblock, etc.) should be required and provided by the employer.

With proper preparation and training, your crews can and should stay safe and hydrated on the job.  By showing your team that you are putting their health and safety first, you are not only fulfilling a legal obligation – You are showing your employees that you care about their well-being and are actively working to provide them with a safe and secure workplace.

For more information on construction business and marketing tips, stay connected with the HBW Blog.  To get ahead of construction activity and gain access to the latest permitting data in Florida, Texas, Georgia, Alabama and Oklahoma, contact HBW for more information on construction data reports and industry leads.

Atlanta Swimming Pools Quarterly Report: Q1-2018

When you think of Atlanta homes, chances are that you do not think of homes with swimming pools.  In fact, according to Georgia Home Digest, “the most rare item in all of Georgia is a home with a swimming pool.”  That being stated, there is still some demand for swimming pools in the Metro Atlanta area, and HBW maintains a watchful eye on the latest permitting activity.

In the first quarter of this year, new swimming pool construction is off to a slower start in Atlanta.  With 418 pool starts, the Atlanta area has experienced a 4% year-over-year decrease in new pool permitting activity.  That being stated, the winter months are not the high season for swimming pool construction in Atlanta, so there is still plenty of time for pool builders to catch up and even surpass last year’s figures.

From a countywide perspective, Fulton took the lead for total starts.  With just over 100 swimming pool starts since the beginning of the year, Fulton County is already ahead of 2017 by 7%.  Other Atlanta areas/counties that are seeing higher levels of new pool construction include: Cobb County (56 permits, -2%), Gwinnett County (43 permits, +2%) and Cherokee County (42 permits, +2%).

Over the last five years, the Metro Atlanta area has experienced incremental and consistent increases in new pool construction, and while first quarter figures can provide clear data on construction activity at the start of the year, it is a finite view and not necessarily indicative of construction permit data to come.  HBW continuously monitors and collects data on the latest permitting activity, and with weekly construction and swimming pool permit reports readily available, new in-ground swimming pool construction patterns and trends will be identified and explored in future reviews and posts.

To gain more information on the builders, homeowners and permits for the construction activity above, check out HBW for your copy of the latest construction data reports. To gain access to the HBW database and receive custom and detailed reports on the latest residential and commercial building activity in Florida, Georgia, Texas, Alabama, and Oklahoma, please contact HBW for details.

Florida Swimming Pools Quarterly Report

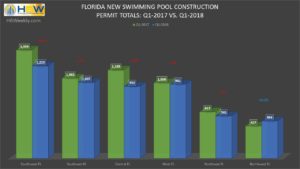
FL New Swimming Pool Construction Permits Q1 2017 vs 2018

In comparison to last year, new swimming pool construction in Florida is at a slower pace in the first quarter of this year; statewide there has been an 8.5% year-over-year decrease in new pool construction with central (-18.6%) and southwest (-14.6%) Florida taking the greatest hits.  Out of the six major regions reviewed (Central, West, Southeast, Southwest, Northeast, Northwest) there have been more than 5,200 pool starts in Q1-2018, with only one area experiencing gains in new pool construction – The northwestern region of the state (inclusive of two Alabama counties) had a running start in comparison to last year having more than a 16% year-over-year increase in pool starts resulting in nearly 500 new permits in Q1-2018.

Despite the decrease in construction overall in Florida, certain major counties have experienced some notable gains.  For example, Charlotte County (SW) had 183 pool starts in the first quarter of this year which reflects more than a 46% boost in pool construction in comparison to Q1 of last year.  Additionally, Hillsborough County (West) is ahead with a more than 18% year-over-year increase in pool starts resulting in 360 new pool construction permits in the first quarter.  In the southeast, the counties of Palm Beach (384 permits) and Broward (115 permits) both experienced year-over-year gains of 6.5% and 20% respectively.

When looking at total new pool construction permits by area, the southwest ranked #1 for total starts having 1,225 new permits added to the HBW database in the first quarter of this year. The southeast region ranked second highest with more than 1,000 pool starts, and the western region was close behind and ranked third with 981 new swimming pool construction permits for the three-month period.

To gain more information on the builders, homeowners and permits for the construction activity above, check out HBW for your copy of the latest construction data reports. To gain access to the HBW database and receive custom and detailed reports on the latest residential and commercial building activity in Florida, Georgia, Texas, Alabama, and Oklahoma, please contact HBW for details.

Florida Quarterly Home Builder Report: Q1-2018

Depending on where you look in Florida, new residential construction has been on a significant high or at a lull in the first quarter of this year.  Across the Sunshine State, housing starts had a year-over-year increase of 6.1% in the first quarter resulting in more than 17.7k new construction permits in the HBW database.  Areas with the most notable growth include the southeastern (+~21%), northeastern (+18%) and northwestern (+21%) regions of the state.  Areas off to a slower start include Central Florida (-5%), West Florida (-3%) and Southwest Florida (-0.7%).

Here is a closer look at new home building activity in Florida throughout Q1-2018:

Northwest

The northwestern region of Florida (including adjacent counties in Alabama) has experienced the greatest increase in housing starts in comparison to the five other regions reviewed.  With a 21.1% year-over-year increase in new residential construction permits, there were nearly 2,670 housing starts in Q1.  The counties with the highest concentration of permits in the northwest include Baldwin, AL (613 permits, + 10.5%) and Santa Rosa (400 permits, +24%).

Southeast

In the first quarter of this year, the southeastern region ranked second highest for growth with a year-over-year increase of 20.9% and 2,131 new permits.  The counties with greatest total number of housing starts include Miami-Dade (652 permits, +23.3%) and St. Lucie (564 permits) which had a massive 48% increase in new residential construction activity in comparison to the same time last year.

Northeast

The northeastern portion of Florida has also had a strong start to the year.  As previously mentioned there was more than an 18% year-over-year increase in housing starts which resulted in 3,040 permits for the three-month period.  The counties with the greatest total number of new permits in the first quarter include St. Johns (982 permits, +9%) and Duval (808 permits +17.3%).

Southwest

The southwestern region of Florida has experienced a nominal dip (-0.7%) in housing starts in comparison to last year.  The area ranked third highest for total housing starts with 3,028 permits in the first quarter of this year.  The greatest concentration of new home construction could be found in Lee County (1,059 permits, +15.4%) and Sarasota County (743 permits, +1.2%).

West Florida

While West Florida had the greatest total number of housing starts in the first quarter (3,580 permits), the area is down in comparison to Q1-2017 by -2.8%.  Areas that held higher levels of new construction activity included the counties of Hillsborough (1,150 permits, +0.1%) and Polk (883 permits, -12%).

Central Florida

Despite a year-over-year decrease of approximately 5% in Central Florida new home construction, the area ranked second highest for total starts having 3,271 permits on file with HBW in the first quarter of this year.  The larger city-centered (Orlando) county of Orange held nearly half of all new residential construction with 1,416 permits, reflective of a 9% year-over-year increase.  Brevard County was a distant second for housing starts having 565 new residential construction permits (-16.9%) in the first quarter of this year.

To gain more information on the builders, homeowners and permits for the construction activity above, check out HBW for your copy of the latest construction data reports. To gain access to the HBW database and receive custom and detailed reports on the latest residential and commercial building activity in Florida, Georgia, Texas, Alabama, and Oklahoma, please contact HBW for details.

5 Tips for Choosing the Right Subcontractor

If you are a busy home builder, chances are you have worked with your fair share of subcontractors.  With a limited labor pool, it is easy to take on more work than capacity allows, and subcontractors are a great way to keep your business steady and projects flowing in a timely manner.  That being stated, not all subcontractors are created equal, and to make sure you have the right subcontractor for the job, there are a few necessary filters to run and a vetting process that must take place.  Here are five areas to consider when choosing your next subcontractor:

  1. Review – Just as you would with any new hire, review their expertise. This is not simply for the purpose of verifying their professional profile and experience – You will also need to take into account their specialties and how they relate to the project.  Additionally, verify their references, and don’t be afraid to ask the difficult questions from other contractors with whom they have worked to make sure they have produced quality work, on time and under budget.
  2. Check Capacity – As slick of an image and as tight of a list of expertise a subcontractor may have, they may or may not have the capacity to meet the size and demand of your job. What and how much equipment do they have available?  What size and how many crews are on hand?  How many jobs are they currently handling and will have running during your project?
  3. Safety First – Throughout the HBW Blog we touch upon the importance of safety, and the construction industry is where it is essential for safety to be a top priority. Citations and fines aside, the safety of your workers, your projects and your clients’ property must always be at the forefront of your daily operations, and for this reason, your subcontractor’s safety record must be at the forefront of your vetting process.  Check their OSHA records and their workers’ compensation information to review their Experience Modification Rate (EMR) and assess past cost of injuries and future chances of risk
  4. Insurance – While this would seem like a given, you can’t overlook confirming that the company is properly licensed, bonded and insured. An experienced and professional contractor should have this information readily available and provide the credentials upon request.
  5. Time – To keep your job and deliverables on time, you must adhere to an organized and detailed schedule; the same applies to the subcontractor you choose to complete the work. Prior to getting started, the subcontractor should provide a plan inclusive of action items, stages of the job and an appropriate timeline through completion.  Make sure your schedule provides a cushion for any unforeseen circumstances and that it is agreeable by all parties.

Whether you have a go-to crew already or you are just embarking on your search for a subcontractor partner, establishing realistic and clear expectations is paramount to your success.  To be successful, a business must have the room to grow, and when it comes to meeting client demands, a solid subcontractor can be a helpful ally in growing your team and company.

For more information on construction business and marketing tips, stay connected with the HBW Blog.  To get ahead of construction activity and gain access to the latest permitting data in Florida, Texas, Georgia, Alabama and Oklahoma, contact HBW for more information on construction data reports and industry leads.
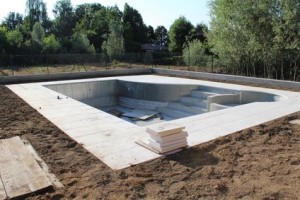
Texas Swimming Pool Construction Quarterly Report

HBW reviews the new swimming pool construction permit data for Texas in the first quarter of 2018.

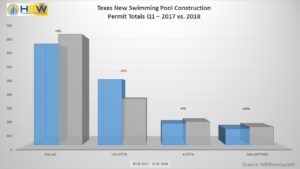
Texas New Pool Permits by Area Q1 – 2017 vs. 2018

Overall, Texas is off to a healthy start for new pool construction.  In the first quarter of this year there were just over 1,550 new pool permits added to the HBW database, reflective of a 3% year-over-year decrease in new construction activity.  This drop is primarily due to the decline in pool construction in the Houston area where pool starts were down 30% in comparison to Q1-2017.  While the first quarter of the year is not the high season for pool builders, all other major metro areas reviewed (Dallas, Austin, San Antonio) are already ahead of last year’s figures.

The area experiencing the greatest increase in pool starts is San Antonio.  With just over 140 new pool permits in Q1-2018, the area is ahead of Q1-2017 by 13%.  Dallas also had a spike in new pool construction; with approximately 870 new pool construction permits on file with HBW, Dallas ranked #1 for pool starts having experienced a 9% year-over-year increase during the first quarter of this year.  The Austin area is also 9% ahead of last year having 183 new swimming pool permits on file for the three-month period.

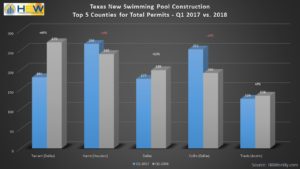
When focusing on Texas counties that have the highest concentration of new pool permits in the first quarter, Tarrant County (Dallas) takes the top spot as it has already experienced a colossal 49% year-over-year increase in new pool construction, resulting in 270 new permits in Q1-2018.  Other counties that are carrying higher totals for pool starts include Harris (Houston) with 240 permits and Dallas with 199 permits.  Here is a closer look at the top five counties for total new swimming pool permits in Q1-2018:

Texas Top 5 Counties for Total Pool Permits Q1- 2017 vs. 2018

To gain more information on the builders, homeowners and permits for the construction activity above, check out HBW for your copy of the latest construction data reports. To gain access to the HBW database and receive custom and detailed reports on the latest residential and commercial building activity in Florida, Georgia, Texas, Alabama, and Oklahoma, please contact HBW for details.

Texas Home Building Report: Q1-2018

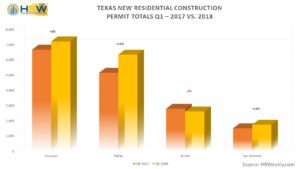
Texas New Permits by Area Q1 2017 vs. 2018

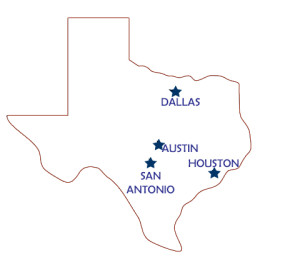
Texas has been hot out of the gates this year when it comes to new residential construction.  In the first quarter, there have been more than 17,900 housing starts on record which reflects an already 11% year-over-year increase.  Out of the four major metro areas reviewed (Houston, Dallas, Austin, San Antonio), Houston continues to dominate for total new permits having 7,217 housing starts for the three-month period.  And while Dallas landed second highest for starts (6,344 new permits), it is leading the Lone Star State for growth as it has experienced a 23% year-over-year increase in new home construction since the start of the year.

The only metro area that hasn’t had a booming start in new home construction is Austin.  Austin ranked third for total housing starts having 2,612 new permits on file with HBW, and while this is reflective of a 6% decrease in new home construction in comparison to the same time last year, Q1-2018 is showing signs of improvement since the latter half of 2017.

Although San Antonio has the least amount of total starts (1,744 permits) in the first quarter, it continues to experience significant gains in the new residential construction market.  Over the last five years, the area has been maintaining a growth pattern, having more housing starts on file year-over-year, and as of Q1-2018 it is already ahead of last year by 16%.

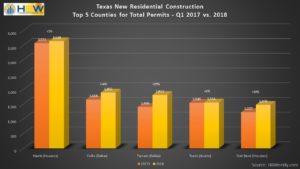
When breaking down new residential construction by county, a couple of counties in Houston and Dallas led for total permits.  With just about a 2% lead over last year’s first quarter, Harris County (Houston) ranked #1 having nearly 3,640 housing starts in Q1-2018.  Next in line and side-by-side were two Dallas area counties… Collin County ranked second having 1,893 housing starts (+14%), and Tarrant County came in a close third with 1,811 housing starts (+29%).

Texas Top 5 Counties for Total New Permits – Q1 2017 vs. 2018

As far as higher value home construction (>$500k) is concerned, Dallas has and continues to rank #1, and with nearly 550 higher value housing starts in the first quarter of this year, the area is tracking to be ahead of last year in this value range.

To gain more information on the builders, homeowners and permits for the construction activity above, check out HBW for your copy of the latest construction data reports. To gain access to the HBW database and receive custom and detailed reports on the latest residential and commercial building activity in Florida, Georgia, Texas, Alabama, and Oklahoma, please contact HBW for details.

Atlanta Residential Construction Quarterly Review

New home construction in Atlanta continues its upward trend in the first quarter of 2018.

HBW’s quarterly building activity trend reports are in, and from the looks of this year’s first quarter, Atlanta is continuing to see growth in the residential construction market.  Having experienced a year-over-year increase of just about 3% in the first quarter of 2018, Atlanta has nearly 5,500 new residential construction permits on file.

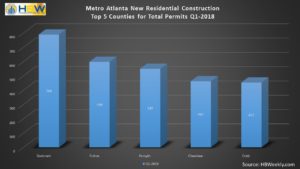
Out of the 24 different Georgia counties reviewed, Gwinnett led for the greatest total number of housing starts so far this year (789 permits), while counties including Paulding (+42%) and Hall (+28%) were notable for their marked annual growth in new residential permits.

Just behind Gwinnett was Fulton County with nearly 600 housing starts in the first quarter of this year, reflecting a stable and consistent trend for the area as figures nearly match new construction activity from the same time last year.  Forsyth County landed the third top spot for housing starts with approximately 550 new permits for the 3-month period.  Cherokee County also made the top five list having more than 460 housing starts on file with HBW.  And finally, Cobb County appears to be keeping up its expansive growth pattern as it leaped ahead with a 20% year-over-year increase (453 permits) in the first quarter.  The top counties for total permits on file in Q1-2018 are as follows:

Metro ATL Top 5 Counties for Total Permits Q1-2018

When looking at higher value construction (>$500k), Fulton County ranked #1 for total new permits (79 housing starts), and Cobb County appears to be outpacing the previous year so far.  Overall, the Metro Atlanta area appears to be on track with last year’s figures for higher value construction while having a slight head start in new residential construction across the board.

Information utilized for the graphs and above listed figures for metro Atlanta residential construction was directly derived from HBW construction data reports. To gain access to the HBW database and receive custom and detailed reports on the latest residential and commercial building activity in Florida, Georgia, Texas, Alabama, and Oklahoma, please contact HBW for details.

Top Home Builders in Texas – March 2018

Every month, thousands of new construction permits are added to the HBW database; from new homes to new pools and even commercial construction, there is a plethora of data about the latest builds, and builders.

Last month, there were approximately 6,560 new residential construction permits added for the four major metro areas of Texas (Dallas, Houston, Austin and San Antonio).  When taking a look at the home builders leading construction figures for the month, D.R. Horton has and continues to be front-and-center statewide (ranked #1 in 3 out of 4 metro areas), but there are also some notable builders in each area that are making their mark in the residential construction market.

So, what exactly is a “top builder”?   When assessing the top builders for HBW’s purposes, we look at the total number of new permits each builder has pulled for any given month.  From there, it is filtered by total construction value.  In essence, “top builders” are those with the most housing starts on file for the one-month period.  Here is a look at the builders leading each metro area in the Lone Star State last month:

Houston

In Houston, there were just about 270 active home builders in the area last month, resulting in more than 2,500 housing starts with a total construction value in excess of $506M.  Leading builder, D.R. Horton, ranked #1 for total permits having 260 housing starts and a total construction value of approximately $40.7M on file with HBW.  The top five builders in Houston were as follows:

#1 – D.R. Horton

#2 – Perry Homes

#3 – K. Hovnanian Homes

#4 – Lennar Homes

#5 – David Weekley Homes


Dallas

D.R. Horton also led in Dallas having more than 480 housing starts with a total value in excess $110M last month.  More than 245 builders are on record for the one-month period and contributed to a total of nearly 2,450 new residential construction permits with a total value of $727.5M.  The top five builders in Dallas are as follows:

#1 – D.R. Horton

#2 – Lennar Homes

#3 – Pulte Homes

#4 – First Texas Homes

#5 – Darling Homes


Austin

In Austin, more than 105 active builders contributed to nearly 1,080 new permits and more than $252M in construction value last month.  D.R. Horton took the lead having nearly 120 housing starts with a total value in excess of $19M on file.  The top five builders in the area for the one-month period are as follows:

#1 – D.R. Horton

#2 – Pulte Homes

#3 – KB Homes

#4 – Lennar Homes

#5 – Meritage Homes


San Antonio

Last month, there were nearly 520 housing starts with a total value in excess of $113M in San Antonio.  Out of the 135 active builders on file for the month, Continental Homes of Texas took top spot for total permits, having 65 housing starts and more than $13M in total construction value last month.  The top five builders were as follows:

#1 – Continental Homes of Texas

#2 – Camillo Properties

#3 – KB Homes

#4 – Fieldstone Homes

#5 – Havenbrook Homes

To gain more information on the builders, homeowners and permits for the construction activity above, check out HBW for your copy of the latest construction data reports. To gain access to the HBW database and receive custom and detailed reports on the latest residential and commercial building activity in Florida, Georgia, Texas, Alabama, and Oklahoma, please contact HBW for details.

Going “Green” for Your Business

Earth Day is right around the corner (April 22, 2018), making it a great time to explore some ways that your business can go “green”.  Along with the obvious benefits to our environment and future generations, a green business can often be a preferred business for clients.  According to a Nielsen global online study conducted in 2015, millennials are most willing to pay extra for sustainable offerings—almost three-out-of-four respondents.  Among global respondents willing to pay more, attributes such as a company being environmentally friendly, a company being known for its commitment to social value and a product being made from fresh, natural and/or organic ingredients ranked highest.

While you may already have your own earth-friendly building products, services and options, you should also take a look at your daily operations.  How “green” are your business practices?  Do you have incentives for employees to decrease their carbon footprint?  Do you recycle?  The list goes on, but the truth is that going “green” can simply be a matter of a few tweaks in how you use energy, paper and resources.  Here are a few easy ways to bump up your sustainability efforts in the office:

  1. Recycle – From paper to plastics, it is easy to implement a recycling program for your office, building or corporate park.
  2. Buy Recycled – While aiming for a paperless office is ideal, you will still need to use paper for certain documents and materials. Printing paper, napkins, paper towels and more are all offered in the form of recycled cardboard and paper goods.  Only Post-Consumer Waste paper is made entirely from the paper we place in our recycling bins. Making PCW recycled paper uses 45% less energy and creates half the waste of the traditional papermaking process. While you may pay a little more, it will certainly reduce overall waste.
  3. Carpool Program – Depending on your location, a company-wide carpool program can be a welcome addition for employees who have hectic city commutes.
  4. Fuel Efficient Fleet – For your fleet, consider adding low-emission and/or electric vehicles; it can reduce your carbon footprint and fuel expense.
  5. Lighting – From office lights to outdoor lighting, consider using eco-friendly LEDs.
  6. Cleaners – From the job site to the office, using biodegradable and natural cleaning products reduces your team’s exposure to harsh toxins and chemicals, as well as reduces the introduction of such substances into the environment.
  7. Beverages – Long gone are the days of Styrofoam and disposable cups in the breakroom. Also, single-use water bottles are a waste of plastic, and money.  Offer filtered water or a water cooler for employees, and consider stocking up on reusable coffee mugs, travel mugs, cups and drinkware adorned with your company logo.
  8. Website – Yes, you actually can go green online. There is such a thing as green web hosts which are companies that host websites and are earth-friendly.  These companies may use renewable energy, plant trees, and/or buy renewable energy certificates to reduce or mitigate the environmental cost of running their servers and infrastructure.  Often, the cost difference is nil from other companies that are running their servers using fossil fuels.

Once you make a few powerful changes, your company can share your good green practices with your clients and community.  By making a commitment to the environment, you are flexing your company’s social responsibility muscle and taking a step toward a sustainable future, and your next earth-conscious customer.

For more information on construction business and marketing tips, stay connected with the HBW Blog.  To get ahead of construction activity and gain access to the latest permitting data in Florida, Texas, Georgia, Alabama and Oklahoma, contact HBW for more information on construction data reports and industry leads.