Using Instagram Stories for Your Business

How to make the most of Instagram Stories to boost your business profile…

Photo Source: Instagram Press

Despite what you may think, Instagram Stories are not just for teens and millennials looking to post a series of their favorite selfies.  No, Instagram Stories can be so much more and an effective tool for getting your business and Instagram activity noticed.  Just a few months ago (June 2018), Instagram announced that it had reached 1 billion monthly active users, after passing 800 million in September 2017 with 500 million daily users.  What do all of those high figures mean?  It means a lot of potential views for your business services and products.

So, how do you get started?  The first step is simple – You need to establish a business account.  The next steps include gathering your high-quality images and videos that you may already be using in some of your established marketing pieces.  We could go on for days on ways to maximize your presence on Instagram, but for the purpose of this post, we are going to focus on Instagram’s feature that may look familiar if you are already working with Snapchat – Instagram Stories.

What are Instagram Stories?  It’s really quite simple.  The “Stories” feature enables you to create photo and video sequences that post just to your story and can be viewed for 24-hours.  While you may not initially understand the power of a 24-hour post, think of incentives, giveaways, company events, holidays, featured projects, product launch – the list goes on.

You can really add almost anything to your story, so it can be tempting to just click “add post to your story” on every image or video that is of interest to you – Resist the urge.  As that may be fine for a personal account, as a business, you will want to be more strategic with the content you post.  After all, it is the first thing that a viewer will see when they click on your profile.

Here are a few ways to make Instagram Stories work for your business:

Harness the Power of Brand Ambassadors – Brand ambassadors don’t have to be celebrities.  Rather, think of them as celebrities of your brand.  Real people who really use your products or live in the homes you’ve designed or built.  Encourage your employees, clients and partners to post photos related to your business and tag you.  With one click, they can be front and center on your “Story”.  You may even consider building a story around your top picks (or pics) for the week.

Give Up Control – Whether you know a social influencer, industry figurehead, well-known client, local celebrity or partnering business, any one of them may be a good contact to have conduct a social “takeover”.  Perhaps you can swap control for a day where they control your story and vice versa.  Takeovers occur when your brand allows an influencer to control content for a specified period of time, and Instagram Stories are a great place to test it and see how it can work for your business in other social arenas.  There are brands that build entire campaigns around takeovers, and it may be an option for changing things up in your Instagram Story.

Create an Actual Story – Yes, the word “story” is even in the name of the feature, but much of the content won’t actually portray a true story with a beginning, middle and end.  Creating a consistent story will take a little more thought, but using it to demonstrate a before and after project or the history of your company during an anniversary year can be a really cool and interesting way to draw in your audience.

Show the Imperfections – Many viewers prefer organic and real content, and real content isn’t perfect; as once stated by Thomas De Quincey, “Even imperfection itself may have its ideal or perfect state.”  While the photos with perfect lighting and models serve a purpose, they become less believable in large amounts.  Make sure to add a little flavor to your story by showing real photos (#nofilter) with real people, on the job and in action.  Sneak peeks and behind-the-scenes stories give viewers a feeling that they are getting exclusive information and a chance to really get to know your business.

With there being so many ways to post interesting stories to Instagram, don’t be afraid to experiment now and again.  The more fun (while staying professional) you have, the more fun the viewer will have in learning about your company.

For more information on construction business and marketing tips, stay connected with the HBW Blog.  To get ahead of construction activity and gain access to the latest permitting data in Florida, Texas, Georgia, Alabama and Oklahoma, contact HBW for more information on construction data reports and industry leads.

Florida Top Home Builders – July 2018

An HBW report on the top ranked home builders for total new permits on file during the month of July 2018.

Florida Total New Residential Permits – July 2018

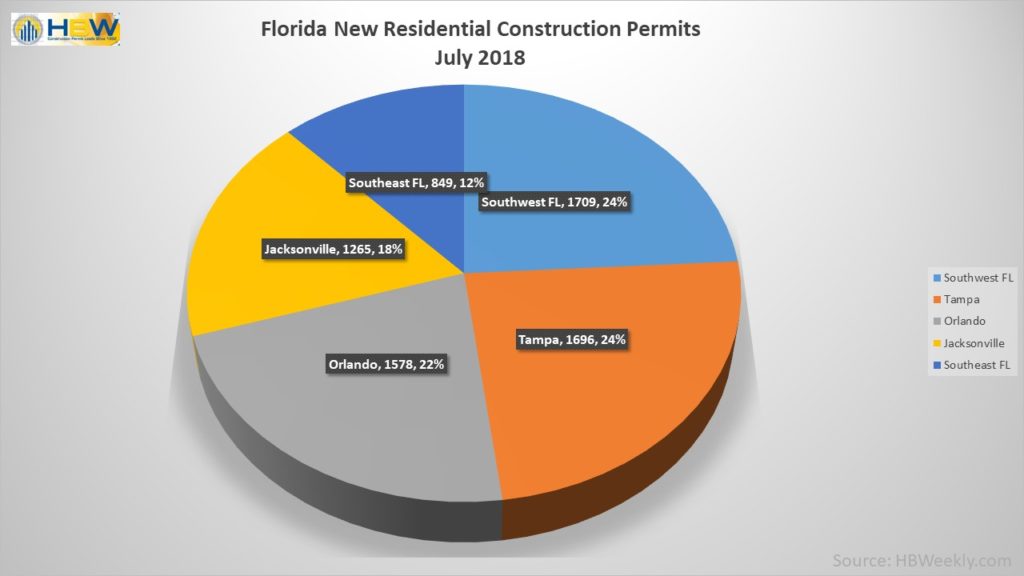
Last month, residential construction was on the rise in the Sunshine State.  Having experienced an 18% month-over-month increase in housing starts, there were nearly 7,100 total new permits added to the HBW database for the one-month period.  Out of the hundreds of home builders active throughout the state, Lennar Homes ranked #1 for total permits in four out of five regions reviewed, while D.R. Horton took top spot in Orlando.

Here is a closer look at new residential construction and the leading home builders by area for the month of July:

Southwest

Housing starts were up by a 17% month-over-month increase in the southwestern region of the Sunshine State last month.  Ranking #1 for total new permits out of all areas reviewed, there were just about 1,710 housing starts with a total construction value of nearly $412M in the southwest. Out of the 265 active home builders in the area, the following ranked as the top five for total new permits for the one-month period:

#1 – Lennar Homes

#2 – D.R. Horton

#3 – Pulte Homes

#4 – Neal Communities of SW FL

#5 – Taylor Morrison

Tampa

Not far behind the southwest, Tampa experienced a 20% month-over-month increase in residential construction, resulting in close to 1,700 housing starts with a total construction value of $480M for the month of July.  Out of the 225+ active home builders in the area last month, the top five for total permits on file are as follows:

#1 – Lennar Homes

#2 – D.R. Horton

#3 – Pulte Homes

#4 – M/I Homes

#5 – Taylor Morrison

Orlando

Last month, Orlando experienced a 27% month-over-month increase in housing starts, resulting in 1,578 new residential construction permits with a total value of $478M.  Out of the approximately 190 active builders in the area last month, the top five for total new permits for the one-month period are as follows:

#1 – D.R. Horton

#2 – Park Square Homes

#3 – Meritage Homes

#4 – Lennar Homes

#5 – Pulte Homes

Jacksonville

In Jacksonville, housing starts were up 19% in comparison to June.  During the month of July, there were more than 1,265 housing starts with a total construction value of approximately $292M added to the HBW database. Out of the 145+ active builders in the area, the top five for total permits on file are as follows:

#1 – Lennar Homes

#2 – D.R. Horton

#3 – Dream Finders Homes

#4 – KB Homes

#5 – David Weekley Homes

Southeast

This summer, housing starts in Southeast Florida have been consistent and steady, having no major monthly shifts in residential construction.  Last month, there were approximately 850 housing starts with a total construction value of nearly $238M. Out of the 190 active home builders in the area last month, the following took the top five spots for total housing starts on file:

#1 – Lennar Homes

#2 – D.R. Horton

#3 – Pulte Homes

#4 – Standard Pacific Homes

#5 – GL Homes

To gain more information on the builders, homeowners and permits for the construction activity above, check out HBW for your copy of the latest construction data reports. To gain access to the HBW database and receive custom and detailed reports on the latest residential and commercial building activity in Florida, Georgia, Texas, Alabama, and Oklahoma, please contact HBW for details.

5 Tips for Getting the “Clicks”

Easy tips for increasing the click rate on mass emails

As an HBW subscriber, you have an ongoing list of leads that are waiting to be engaged.  While there is a myriad of ways to reach your prospects (cold call, mailer, etc), at some point email marketing will most likely come into play. 

So, what makes an email marketing campaign successful?  The answer is layered and has much to do with the source of your leads, knowing your audience and tailoring the information to meet the interest and needs of that audience.  Since you have the verified leads through HBW, and you most likely know your target audience, we will skip right to the nitty-gritty of fine-tuning your mass emails. 

Truth be told, even some of the best of mass emails will have an average open rate of 20% – yes, 20%.  It may not seem like a high figure, but keep in mind that most people are overloaded with emails on a daily, if not hourly, basis.  Make sure to set realistic goals; once you have determined your baseline for open and click rates, you can make modifications in an effort to boost those figures. 

Here are five easy tips for increasing your “open” and “click” rates on mass emails:

1.    Subject Line – Pay attention to your subject line.  This can make or break an email.  Get creative and avoid generic openers.  Short yet descriptive subject lines fare better than those using generic and typical lure tactics; lengthy subject lines often go unread and are cut off on mobile devices.  The subject should be compelling and inviting.

2.    First Words Make First Impressions – As you are probably already aware, the first few words of your email will be visible to most viewers before they even open it.  For this reason, make the first text in the body of the email an extension of the subject line and something of specific interest to the reader.

3.     Time It – Day of the week and hour of the day are important factors in having an email read.  In the construction industry, many of us are accustomed to checking email before the sun rises, but to market to consumers, you will need to think about their typical schedule.  Generally, emails sent on Tuesday or Wednesday (around lunch hour) have a higher probability of being viewed, but you may need to gauge and test different days of the week and times of day to see what works best for your contacts.

4.    Avoid Pressure – While pressure sales may work for some, it becomes a bit gimmicky in the world of email.  Phrases like “Hurry in – Limited…” or “Only 3 Left” can scare off many readers (especially new ones).  Instead, think about using phrases that are inviting and pique interest.

5.   Be to the Point – While design and engaging images are important, don’t create too many distractions.  Your email should lead the reader, not force them to search for content or wander for too long.  You have a very limited time frame to capture the reader, so make the most of it.  All images should have links attached as they are easier to click, and the content should have a clear offer and call to action.  Save your more text heavy messages for your brochures, website and blog.

For more information on construction business and marketing tips, stay connected with the HBW Blog.  To get ahead of construction activity and gain access to the latest permitting data in Florida, Texas, Georgia, Alabama and Oklahoma, contact HBW for more information on construction data reports and industry leads.
HBW Report: Texas Swimming Pool Construction Report – July 2018

Upon review of the latest HBW construction data reports in Texas, there were nearly 900 swimming pool starts during the month of July.  Out of the four major metropolitan areas reviewed (Dallas, Houston, San Antonio, Austin), Dallas had the greatest number of total new swimming pool permits (467), while Austin held the highest average value of construction ($63,689).

Here is a closer look at new pool construction by area:

Dallas

In Dallas, there were 467 pool starts with a total value of in excess of $22.5M during the month of July.  The average value of construction was $48,354, and out of the 160+ active builders on file for the month, the top three builders for total new swimming pool construction permits are as follows:

#1 – Riverbend Pools

#2 – Gold Medal Pools

#3 – Puryear Custom Pools

Houston

In Houston, there were more than 270 pool starts with a total value of approximately $16.7M during the month of July.  The average value of construction was second highest of the four metro areas reviewed coming in at $61,500. Out of the 110 active builders on file for the month, the top three for total new permits are as follows:

#1 – Anthony & Sylvan Pools

#2 – Premier Pools

#3 – Platinum Pools

San Antonio

Last month, there were nearly 75 pool starts with a total value of approximately $3.5M in San Antonio.  The average value of construction was $47,680, and out of the nearly 40 active builders in the area last month, the top three for total new pool permits on file with HBW are as follows:

#1 – Keith Zars Pools

#2 – Cody Pools

#3 – Texas Pools & Patios

Austin

Last month, there were more than 70 pool starts with a total value greater than $4.5M in Austin. The average value of construction was higher in Austin than any other metro area reviewed coming in at $63,689 for the month. Out of the more than 40 active pool builders in the area last month, the top three builders for total new permits on file are as follows:

#1 – Cody Pools

#2 – Texas Pools & Patios

#3 – Majestic Poolscape

To gain more information on the pool builders and permits for the construction activity above, check out HBW for your copy of the latest construction data reports. To gain access to the HBW database and receive custom and detailed reports on the latest residential and commercial building activity in Florida, Georgia, Texas, Alabama, and Oklahoma, please contact HBW for details.

Texas Top Home Builders – July 2018

A review of Texas residential construction and the top builders for total housing starts during the month of July.

Last month, there were more than 8,100 housing starts in the major metro Texas areas of Houston, Dallas, Austin and San Antonio.  D.R. Horton continued to lead for total new permits on file with HBW and ranked #1 in Houston, Dallas and Austin for total housing starts.

Here’s a closer look at the top builders and new residential construction activity by area for the month of July:

Houston

Houston continued to take top spot for housing starts last month having 3,140 new permits with a total value of approximately $669.5M added to the HBW database.  Out of the 345 active builders on file in the area for the one-month period, the top builders for total permits are as follows:

#1 – D.R. Horton (496 permits)

#2 – Lennar Homes (243 permits)

#3 – Perry Homes (160 permits)

Dallas

In Dallas, there were more than 2,780 housing starts with a total value of approximately $825.2M added to the HBW database last month.  Out of the nearly 280 active builders on file in Dallas during the month of July, the top builders for total permits are as follows:

#1 – D.R. Horton (289 permits)

#2 – Pulte Homes (138 permits)

#3 – Lennar Homes (128 permits)

Austin

In July, there were more than 1,310 housing starts with a total value in excess of $284.5M added to the HBW database for the Austin area.  Out of more than 115 active builders in the area for the month, the top builders for total new permits on file with HBW are as follows:

#1 – D.R. Horton (241 permits)

#2 – Milestone Community Builders (116 permits)

#3 – KB Homes (104 permits)

San Antonio

In San Antonio, there were more than 880 housing starts with a total value of nearly $196.5M added to the HBW database for the month of July.  Out of the more than 120 active builders in the area last month, the top builders for total permits are as follows:

#1 – KB Homes (103 permits)

#2 – Continental Homes of Texas (93 permits)

#3 – Bella Vista CMI (88 permits)

To gain more information on the builders, homeowners and permits for the construction activity above, check out HBW for your copy of the latest construction data reports. To gain access to the HBW database and receive custom and detailed reports on the latest residential and commercial building activity in Florida, Georgia, Texas, Alabama, and Oklahoma, please contact HBW for details.

Seven Tips for Content Marketing Success

Here are a few easy-to-apply tips for lifting your content marketing and making sure that you don’t reach the common plateau.

All of us have heard and know the value of keeping marketing content “fresh”, but what does “fresh” really mean?  To some “fresh” translates to “active”, and active does not necessarily mean that you are making your touch points count.  When it comes to marketing, and anything really, you don’t want to confuse movement with progress.  Just because you have regular posts on social media or stick to a consistent mailer distribution schedule doesn’t mean that your content is getting noticed.

So, what will keep it fresh?  The answer isn’t simple, and really, fresh content is constantly changing and developing over time.  That being stated, here are few tips for putting a little life back into your content and marketing strategy:

  1. Schedule It – If you don’t have it on the schedule, there is a high probability that it won’t get done. When developing fresh ideas and new content for your marketing strategy, they will only go as far as you schedule them.  Just as with every new construction project, a new section on the website or a revised FaceBook page will only happen if you put it on the calendar.
  2. Be Consistent – Your blog and social media should be consistently posted. While the content should vary, you will want to have updates on a regular basis.  According to a survey conducted by HubSpot, 82% of marketers who blogged more frequently reported at least one customer generated from their blog versus 57% who were only blogging monthly.
  3. Share Content – You should share your content across all social outlets, email blasts and websites. Additionally, you should encourage your staff and affiliates to share content regarding your latest launch, event, or new product line within their social networks.  Anything you share should include links to forward and share the content with others.
  4. Repurpose and Recycle – We are not talking about recycling old flyers here. Rather, repurposing content refers to taking previously published content and giving it a fresh new look.  For example, you may decide to post a follow up story on a previously posted “new” project, or maybe you want to add new information about updated codes or construction stats that were shared in the past.  There are many ways to take old stories and give them new life in a way that resonates with your target audience.  It’s all about the follow up and keeping your visitors and viewers up-to-date on stories and topics of interest.
  5. Involve Influencers – While most of us do not have the budget to hire well-known influencers to generate buzz over our products and services, it takes very little to make reference to influencers within the industry. Whether you link and share their content or quote them, be sure to tag or message them to make them aware of your mention.
  6. Stay on Trend – What is currently buzzing in the industry? What designs and products do your customers and target audience find to be of greatest interest?  Whether you have access to the latest color trend predictions or the designs and floor layouts that are in highest demand, sharing fresh trends is an effective way to bring something new to the table.
  7. Be Dynamic – Dynamic content is site content that is intuitive in that it automatically adapts to pre-defined conditions, such as a site visitor’s actions/input. This type of content will adjust dynamically so that different users see different content that is somewhat tailored to their interest based on their activity. Dynamic content creates a unique user experience. It increases conversion rates, and if done properly can provide a more personalized experience.  This can be done through your webmaster.

A successful marketing strategy is one that evolves over time and is adjusted as you learn more about where and how you are receiving the greatest response from your target audience. While it can feel comfortable to play it safe and stick with the same methods that have proven to be successful in the past, comfortable does not make you grow; as your business grows, so should your reach and content marketing efforts.

For more information on construction business and marketing tips, stay connected with the HBW Blog.  To get ahead of construction activity and gain access to the latest permitting data in Florida, Texas, Georgia, Alabama and Oklahoma, contact HBW for more information on construction data reports and industry leads.

Swimming Pool Construction on the Rise in West Florida

A quarterly review of new swimming pool construction permits in Florida through the second quarter of 2018.

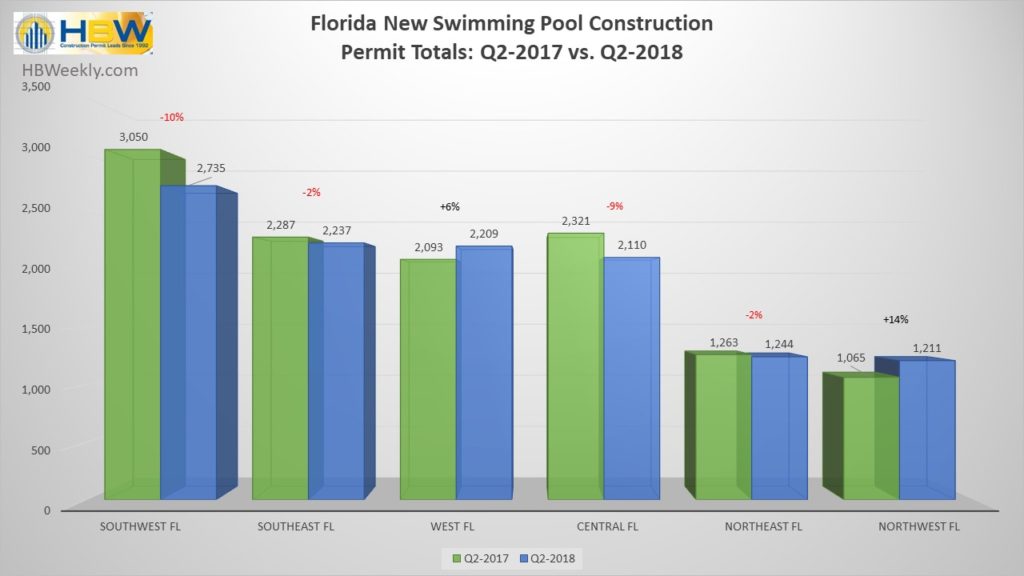
FL New Pool Permits by Area thru Q2 – 2017 vs. 2018

The western and northwestern regions of Florida had a healthy dose of new swimming pool construction in the first half of this year. Both regions have reflected an annual growth pattern in pool construction over the last five years, and through Q2 of this year the west and northwest have demonstrated year-over-year increases of 6% and 14% respectively.

Overall, the Sunshine State is slightly behind last year’s swimming pool construction figures.  Since the start of this year (through Q2), Florida has experienced a 3% year-over-year decrease in pool starts.  Every region reviewed, with the exception of the west and northwest, has experienced dips in new swimming pool construction ranging from 2% to 10%.

Across the state, there have been approximately 11,750 new pool permits added to the HBW database through Q2-2018, and while the southwest region has experienced a 10% year-over-year decrease in construction so far, it still holds the highest concentration of pool starts (2,735 permits).

Other areas that carried higher concentrations of new pool permits through Q2 include the southeast and west.  Southeast Florida is slightly below last year’s construction figures having a 2% year-over-year decrease so far and approximately 2,240 pool starts on file for the six-month period.  As previously mentioned, the west portion of Florida is 6% ahead of last year (thru Q2) which resulted in it ranking third highest for total new permits having 2,210 pool starts for the given period.

Not far behind the West, Central Florida ranked #4 for swimming pool construction.  While new pool construction has been on the rise in Central Florida since 2014, the first half of this year reflects a slower market resulting in a 9% year-over-year decrease and 2,110 pool starts through June.

When reviewing and breaking down new pool construction from a county perspective, there were a few counties that made our “ones to watch” list for their annual increase in new construction activity.  The Florida counties that have show marked increases in pool construction in the first half of this year are as follows:

  1. Hillsborough County (West) – Pool construction in Hillsborough has been on the rise for nearly five years and this year is no exception. Through Q2, Hillsborough has experienced a 16% year-over-year increase in swimming pool starts, resulting in more than 780 new permits on file.
  2. Lee County (SW) – Since 2017, pool construction figures have been climbing in Lee County. Through Q2, Lee County has more new pool permits (~1,075 permits) on file than any other Florida County, reflecting a 7% year-over-year increase in new swimming pool construction
  3. Brevard County (Central) – While the total number of permits is lower in Brevard County (455 permits), a fairly new growth pattern is developing – Pool construction has picked up in Brevard over the last couple of years. In 2017, the area experienced a 34% year-over-year increase in pool starts, and through Q2 of this year, Brevard is already reflecting a 26% year-over-year increase, making it our third pick for “ones to watch”.

To gain more information on the builders, homeowners and permits for the construction activity above, check out HBW for your copy of the latest construction data reports. To gain access to the HBW database and receive custom and detailed reports on the latest residential and commercial building activity in Florida, Georgia, Texas, Alabama, and Oklahoma, please contact HBW for details.

HBW Quarterly Report: Texas Swimming Pool Construction Q2-2018

A quarterly review of new swimming pool construction permits in Texas from January through June 2018

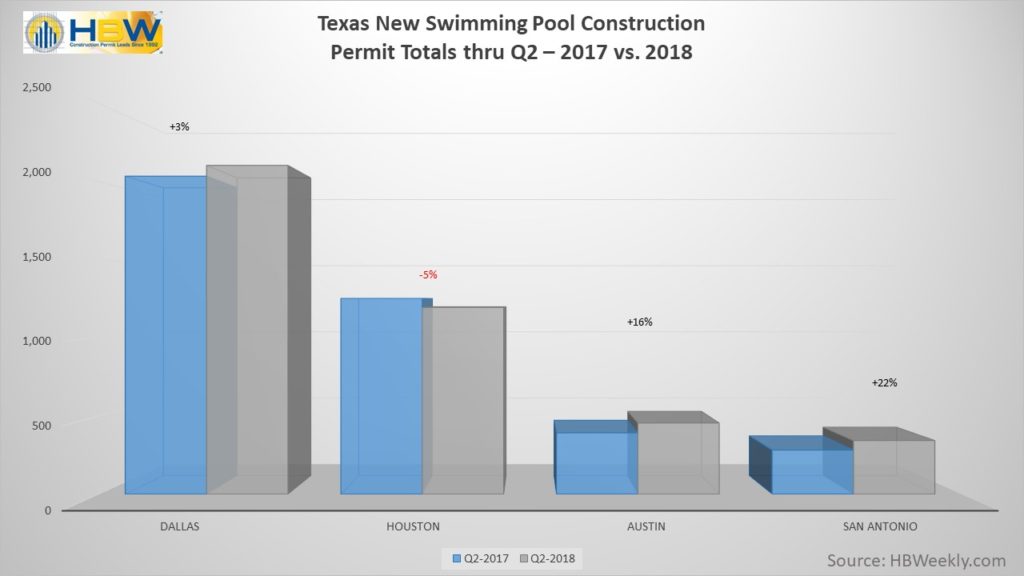
Texas New Pool Permits by Area Q2 2017 vs. 2018

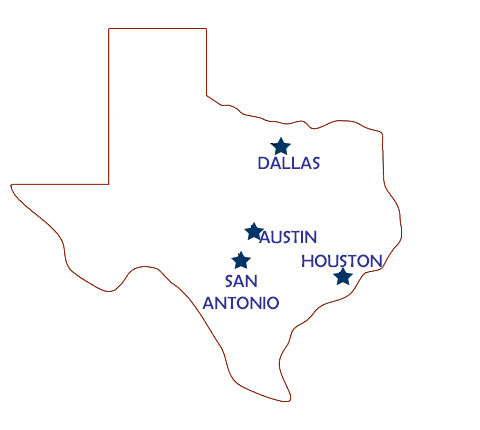
In the first half of 2018, the Lone Star State appears to be climbing out of its lull in new swimming pool construction.  While the state has experienced a slow decline in pool starts since 2015, Texas has already exhibited a 3% year-over-year increase in new swimming pool construction activity.  From Dallas and Houston to Austin and San Antonio, there have been nearly 4,100 pool starts through Q2-2018, with Dallas having the highest total of new permits for the six-month period.  Here is a closer look at new swimming pool construction and permitting activity by area:

Dallas

After experiencing a slight dip in swimming pool construction last year, Dallas appears to be pulling head with new pool construction bumping up 3% in the first half of 2018.   In the six-month period, more than 2,100 new swimming pool construction permits have been added to the HBW database.  The Dallas area counties with the highest concentration of new construction include: Tarrant (579 permits, +21%) and Collin (505 permits, -15%).

Houston

New pool construction has been slowly dropping each year in Houston since 2015, and the area appears to be holding the same pattern so far this year.  In the first half of 2018, Houston has experienced a 5% decrease in pool starts, resulting in 1,194 new permits being added to the HBW database.  The larger county of Harris held the majority of all new pool construction activity with 720 permits on file for the six-month period, reflecting a 2% year-over-year increase.

Austin

While Austin sits on the lower end of the spectrum for total pool starts, new pool construction has been picking up in the area over the last year or so.  Since January (through June) of this year, the area has experienced a 16% year-over-year increase in new swimming pool construction, resulting in 455 new permits on file with HBW.  Nearly all of the new permits originated from Travis County (351 permits), which is also on an upswing having experienced close to a 21% year-over-year increase in new pool construction so far this year.

San Antonio

Although the San Antonio area had the fewest total new swimming pool permits in comparison to other major metro areas in the Lone Star State, pool construction is on the rise.  Since the start of this year, San Antonio has experienced a 22% year-over-year increase in new pool construction resulting in nearly 345 new permits.  Most permitting activity originated from Bexar County (276 permits) which is also exhibiting year-over-year growth in swimming pool construction (+27%).

To gain more information on the builders and permits for the swimming pool construction activity above, check out HBW for your copy of the latest construction data reports. To gain access to the HBW database and receive custom and detailed reports on the latest residential and commercial building activity in Florida, Georgia, Texas, Alabama, and Oklahoma, please contact HBW for details.

HBW Quarterly Report: Florida Residential Construction Rises through Q2-2018

New home construction in Florida is up by 12% in the first half of 2018.

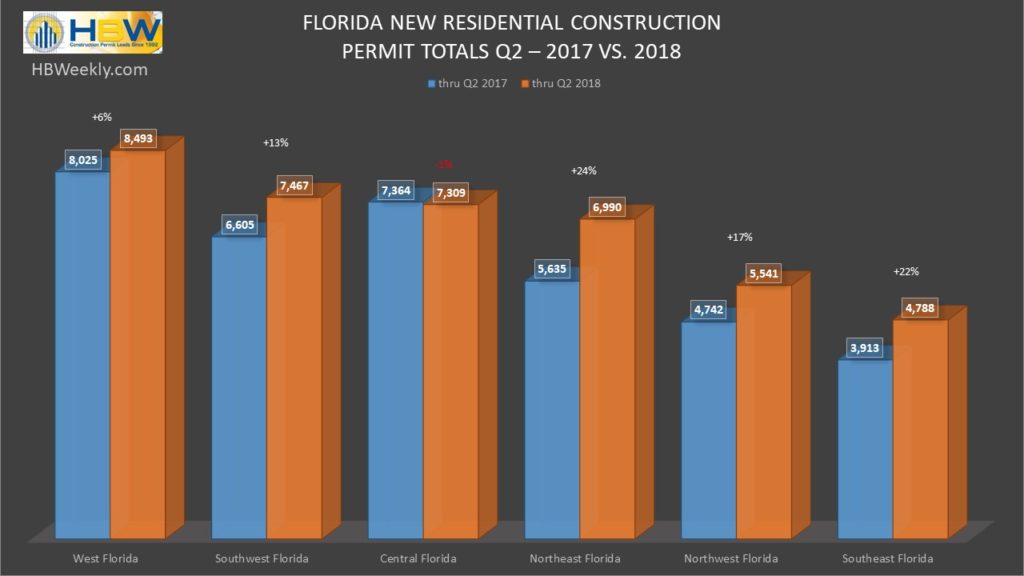
FL New Residential Construction Permits through Q2 – 2017 vs. 2018

Since 2014, new home construction has been on the rise in Florida, and this year is no exception.  Since January (through June), the Sunshine State has experienced a 12% year-over-year increase in housing starts, resulting in nearly 40,600 new permits on file with HBW.  Additionally, Bloomberg News recently ranked Florida second (behind Texas) for population growth, having increased by 410,347 since January 2017.  With housing starts increasing to meet the high demand, we reviewed six major Florida regions (Central, West, Southeast, Southwest, Northeast, Northwest) to identify the highest concentration of new residential construction.

The result:  West Florida ranks #1 for total new residential construction permits through Q2-2018, having nearly 8,500 housing starts for the six-month period; this reflects a 6% year-over-year increase for the west region of Florida.

Every region in Florida, with the exception of Central Florida (-1%), is significantly ahead of new home construction figures from 2017.  Year-over-year increases as high as 24% could be found in the northeastern region where there have been close to 7,000 housing starts since the beginning of the year.  Another area experiencing notable growth in new home construction over the last two years is the southeast where there has been a 22% year-over-year increase in housing starts, resulting in approximately 4,800 new residential construction permits on file with HBW.

New residential construction in the southwest region of Florida has been holding a high growth pattern for the past five years, with annual gains as high as 24% (2015).  This year, the area is already reflecting a 13% year-over-year increase in new home construction, resulting in approximately 7,470 housing starts; this growth rate is the highest it has been since 2015, and it continues to be an area to watch.

Finally, the northwestern portion of Florida is also off to a strong start in residential construction this year.  Having experienced a 17% year-over-year increase in housing starts from January through June, there were nearly 5,550 new permits added to the HBW database for the six-month period.

To gain more information on the builders, homeowners and permits for the construction activity above, check out HBW for your copy of the latest construction data reports. To gain access to the HBW database and receive custom and detailed reports on the latest residential and commercial building activity in Florida, Georgia, Texas, Alabama, and Oklahoma, please contact HBW for details.

HBW Report: Texas Home Building through Q2-2018

HBW reports on residential construction permit data in Texas through the second quarter of 2018.

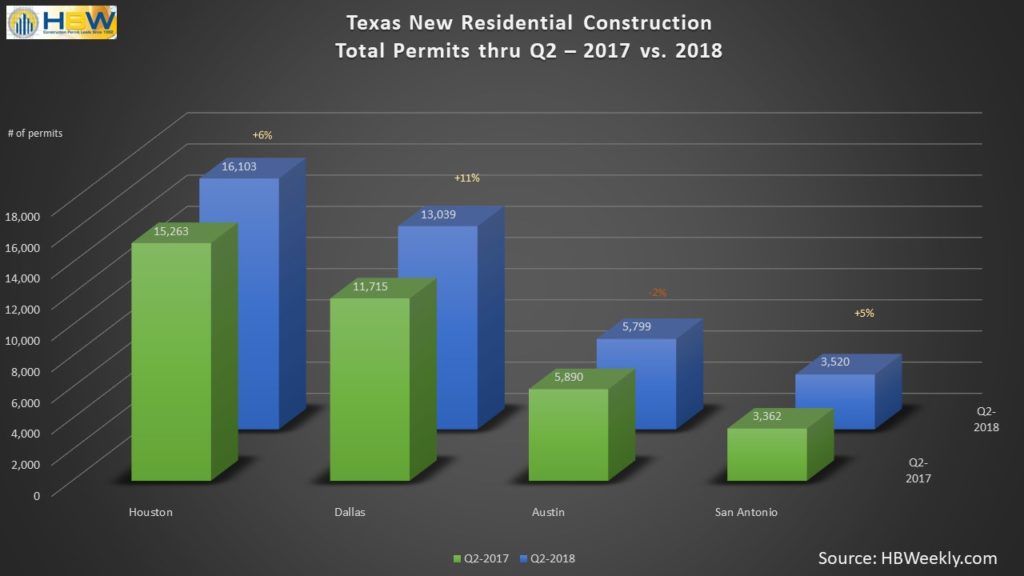
Texas Total Residential Construction Permits thru Q2 – 2017 vs. 2018

This year has already been a year of gains for Texas.  According to a recent report by Bloomberg, the population of the Lone Star State has increased by 494,622 since January 2017 — the biggest gainer among U.S. states, according to government dataThis report and increase is consistent with the latest information acquired from the HBW database.  Based on the permits on record from January 2018 to June 2018, new residential construction permits have experienced a 6% year-over-year increase in Texas, resulting in nearly 38,500 new permits added to the HBW database for Houston, Dallas, Austin and San Antonio combined.

Out of the four major metro areas reviewed, Houston continues to lead the state for total housing starts (16,100+ permits) through the second quarter, and the Dallas area appears to be ranked highest for growth having an 11% year-over-year increase in new residential construction permits.  Every major metro area, with the exception of Austin (5,799 permits, -2%), is already ahead of total permits from the previous year.  While San Antonio has the fewest total permits in comparison to its larger counterparts, it is also experiencing gains this year having 3,520 housing starts through Q2-2018, reflecting a 5% year-over-year increase.

Counties that are demonstrating exemplary growth in new home construction are as follows:

  1. Denton County (Dallas area) – Through the second quarter of this year, residential construction permits in Denton County have experienced a remarkable year-over-year increase of nearly 60%, resulting in approximately 2,250 housing starts.
  2. Montgomery County (Houston area) – Over the last couple of years, Montgomery County has been pulling out of a downward spiral that was apparent in new home construction just a few years ago. In 2017, the area experienced its first increase in housing starts since 2014, closing the year with a 24% year-over-year increase.  This year, new homes continue to boom as there has been more than a 27% year-over-year increase in new permitting activity through Q2-2018, resulting in 3,062 new permits on file.
  3. Bexar County (San Antonio) – The County of Bexar is another one to watch as new home construction began to pick up in the area last year. This year, the area has already experienced more than a 24% year-over-year increase in housing starts, resulting in the majority of new residential construction permits for the San Antonio area (1,952 housing starts).

To gain more information on the builders, homeowners and permits for the construction activity above, check out HBW for your copy of the latest construction data reports. To gain access to the HBW database and receive custom and detailed reports on the latest residential and commercial building activity in Florida, Georgia, Texas, Alabama, and Oklahoma, please contact HBW for details.