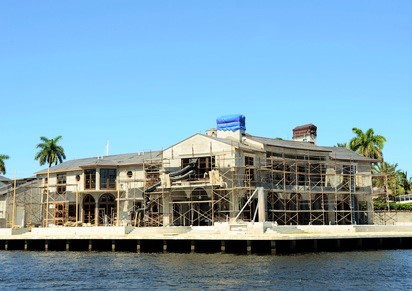
A review of permit data for new swimming pool construction in Texas from January through March 2021
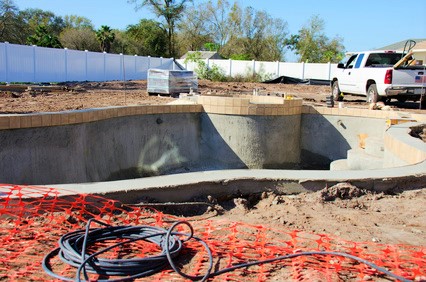
Since the start of this year, new swimming pool construction has been on the rise in most of the major metro regions of Texas. In the first quarter of 2021, there have been 3,270 new swimming pool construction permits recorded in the HBW database from the combined areas of Dallas, Houston, Austin and San Antonio; this reflects a 59 percent increase in new pool construction in comparison to the same time last year.
Nearly all areas reviewed (with the exception of San Antonio) have demonstrated impressive increases in new pool construction activity, with year-over-year increases ranging from 18 percent (Austin) to 75 percent (Houston).
Here is a closer look at the total permits and leading counties for new swimming pool construction in Dallas, Houston, Austin and San Antonio during Q1-2021:
Dallas
In the first quarter of this year, Dallas ranked #1 for new swimming pool construction, having experienced a 73 percent year-over-year increase in pool construction, resulting in 1,646 new permits on record with HBW for the three-month period. Out of the six counties reviewed in the Dallas area, the greatest concentration of new pool construction activity could be found in Collin County where there were more than 545 pool starts that resulted from a 100+ percent year-over-year increase in new swimming pool construction.
Houston
The Houston area demonstrated the greatest year-over-year increase in new swimming pool construction (+75%) which resulted in nearly 1,115 new permits on record with HBW in Q1-2021. Out of the five counties reviewed in the Houston area, the greatest volume of new swimming pool construction could be found in Harris County where there was a 63 percent year-over-year increase resulting in approximately 670 new swimming pool construction permits on record for the three-month period.
Austin
In the first quarter of this year, new swimming pool construction in the Austin area was ahead of last year’s figures by 18 percent, resulting in more than 350 new pool permits on record with HBW. Out of the four counties reviewed, well more than half of all pool starts took place in Travis County where there were 215 new permits on record for the three-month period.
San Antonio
As previously noted, San Antonio was the only metro area that appears to be off to a slow start so far this year. From January through March there have been approximately 160 new swimming pool construction permits that have originated from San Antonio, reflecting a 12 percent decline in comparison to the same time last year. Out of the three counties reviewed, just over half of all new pool construction activity took place in Bexar County where there were 83 new swimming pool construction permits in the first quarter of this year.
To gain more information on the builders, homeowners and permits for the construction activity above, check out HBW for your copy of the latest construction data reports. To gain access to the HBW database and receive custom and detailed reports on the latest residential and commercial building activity in Florida, Georgia, Texas, Alabama, and Oklahoma, please contact HBW for details.