New swimming pool construction across Florida demonstrated steady activity last month, with notable regional variations in both permit volume and project valuation. Drawing on HBW’s latest construction data, this report provides a comprehensive snapshot of new residential pool construction across the state’s five major regions: Southwest Florida, Tampa, Southeast Florida, Orlando, and Jacksonville. Metrics include total permits, total construction value, average project value, and the leading counties carrying the highest concentrations of new activity.
Southwest Florida: Statewide Leader in Permit Volume
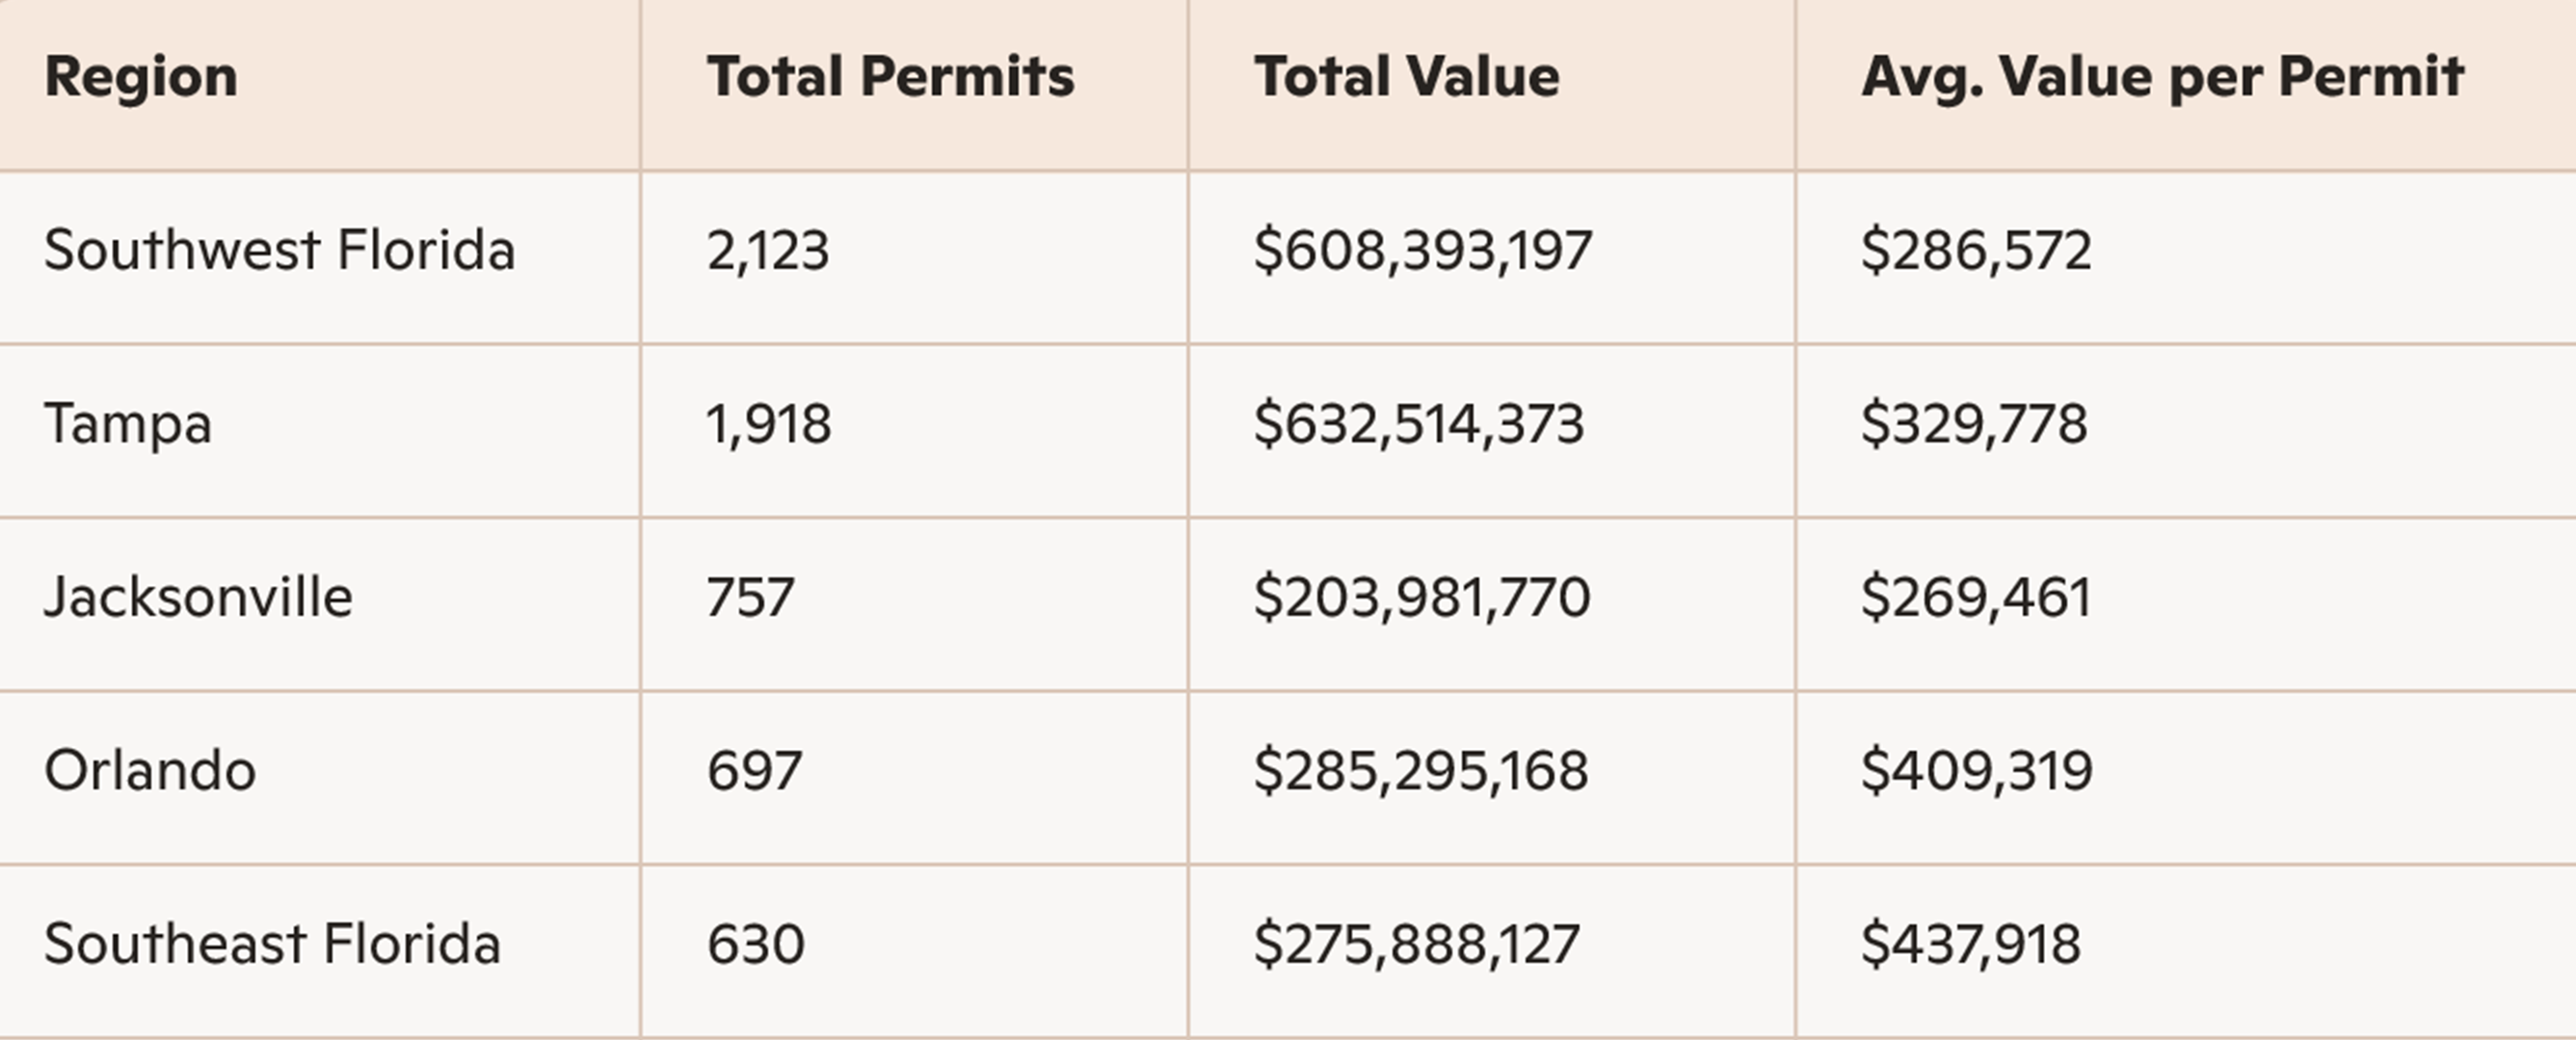
Southwest Florida once again led the state in new swimming pool construction, issuing 502 permits in November. The region reported a total construction value of $39.24 million and an average project value of $78,173.
County‑level activity was concentrated in three primary markets:
- Manatee County: 104 permits totaling $9,146,415
- Sarasota County: 105 permits totaling $8,386,320
- Lee County: 202 permits totaling $15,684,385
The southwestern region’s strong performance reflects ongoing residential development and continued demand for outdoor amenities.
Tampa Region: Higher Average Values
The Tampa area recorded 405 new pool permits with a total construction value of $34.86 million. The region posted one of the higher average project valuations (average value: $86,068) in comparison to other Florida regions reviewed.
Key counties that were driving activity included:
- Hillsborough County: 105 permits totaling $12,524,841
- Pinellas County: 104 permits totaling $8,954,512
The Tampa region continues to benefit from robust in‑migration, infill redevelopment, and a strong mid‑to‑upper‑tier residential market, all of which can be contributing factors to elevated project values.
Southeast Florida: High-Density Market with Moderate Valuations
Southeast Florida issued 404 permits, closely mirroring Tampa’s volume but at a lower total construction value of $29.53 million. The region’s average project value was $73,085.
Top counties for total new permits on record for the one-month period included:
- Palm Beach County: 132 permits totaling $10,558,512
- Miami-Dade County: 105 permits totaling $5,632,212
Orlando Region: Mid‑Range Activity with Balanced Valuations
The Orlando area reported 252 new pool permits, representing a mid‑tier level of activity among the five regions. Total construction value reached more than $18.87 million, with an average project value of $74,897.
Counties with higher concentrations of new permits on record included:
- Orange County: 69 permits totaling $6,256,116
- Brevard County: 53 permits totaling $3,792,721
Orlando’s pool construction market remains steady, supported by ongoing suburban expansion and continued residential development along the I‑4 corridor and coastal areas.
Jacksonville Region: Highest Average Project Value Statewide
Although Jacksonville recorded the lowest permit volume among the five regions with 164 permits, it posted the highest average project value in the state at $103,667. Total construction value reached more than $17 million, underscoring the region’s trend toward larger, higher‑end residential pool installations.
More than half of all new permits originated from the following two counties:
- Duval County: 44 permits totaling $5,487,650
- St. Johns County: 54 permits totaling $5,759,439
Statewide Summary
Across all five regions, Florida recorded:
- Total Permits: 1,727
- Total Construction Value: $139,502,543
The above listed figures reflect approximately a 9 percent month-over-month decrease in new permits, as well as an ongoing statewide demand for new swimming pool construction as homeowners continue to invest in outdoor living spaces.
Regions with the Highest and Lowest Permit Volume
Highest Permit Volume:
Southwest Florida – 502 permits
Representing approximately 29% of all new pool permits statewide.
Lowest Permit Volume:
Jacksonville – 164 permits
Accounting for roughly 9.5% of statewide activity.
Southwest Florida’s dominance in permit volume highlights its ongoing residential expansion, while Jacksonville’s lower volume but higher valuations reflect a more upscale, lower‑density market profile.
Based on the latest construction data, last month demonstrated a strong and diversified swimming pool construction market across Florida. While Southwest Florida led in sheer volume, Jacksonville distinguished itself with the highest average project values. Tampa and Southeast Florida remained competitive mid‑to‑high‑volume markets, each with distinct valuation characteristics, and Orlando maintained steady, balanced activity.
To gain more information on the builders, homeowners and permits for the construction activity above, check out HBW for your copy of the latest construction data reports. To gain access to the HBW database and receive custom and detailed reports on the latest residential and commercial building activity in Florida, Georgia, Texas, Alabama, and Oklahoma, please contact HBW for details.