Texas Residential Construction Permit Data – January 2024

Last month, there were approximately 5,850 new residential construction permits with a total value in excess of $1.75 billion added to the HBW database for the Lone Star State.  Out of the four major metro areas reviewed (Houston, Dallas, Austin, San Antonio), Houston carried the greatest volume of new residential construction (2,999 permits), while the highest average value of new home construction could be found in the Dallas area (average value: $354,456).

Here is a closer look at the permit data for new residential construction in Texas by metro area during the month of January:

Houston

As previously noted, there were approximately 3,000 new residential construction permits with a total value in excess of $848 million in the Houston area last month.  The average value of new home construction was $282,832, and the majority of new construction activity took place in the two counties of Harris (1,205 permits) and Montgomery (872 permits).

Dallas

In Dallas, there were approximately 1,715 new residential construction permits with a total value of $607.5 million on record last month.  As previously noted, the average value of new home construction was highest in Dallas (average value: $354,456) in comparison to other areas reviewed, and the county with the greatest concentration of new residential construction activity was Collin County with 749 new permits for the one-month period.

Austin

Last month, there were just over 600 new residential construction permits with a total value of $200 million added to the HBW database for the Austin area.  The average value of new home construction was $332,884, and more than half of all new permits originated from Travis County where there were 330 new permits on record for the one-month period.

San Antonio

In San Antonio, there were 535 new residential construction permits with a total value of nearly $110.5 million last month.  The average value of new home construction was lowest in San Antonio (average value: $206,435) in comparison to other Texas metro areas reviewed, and the bulk of new construction activity took place in Bexar County where there were 372 new permits on record for the one-month period.

To gain more information on the builders, homeowners and permits for the construction activity above, check out HBW for your copy of the latest construction data reports. To gain access to the HBW database and receive custom and detailed reports on the latest residential and commercial building activity in Florida, Georgia, Texas, Alabama, and Oklahoma, please contact HBW for details.

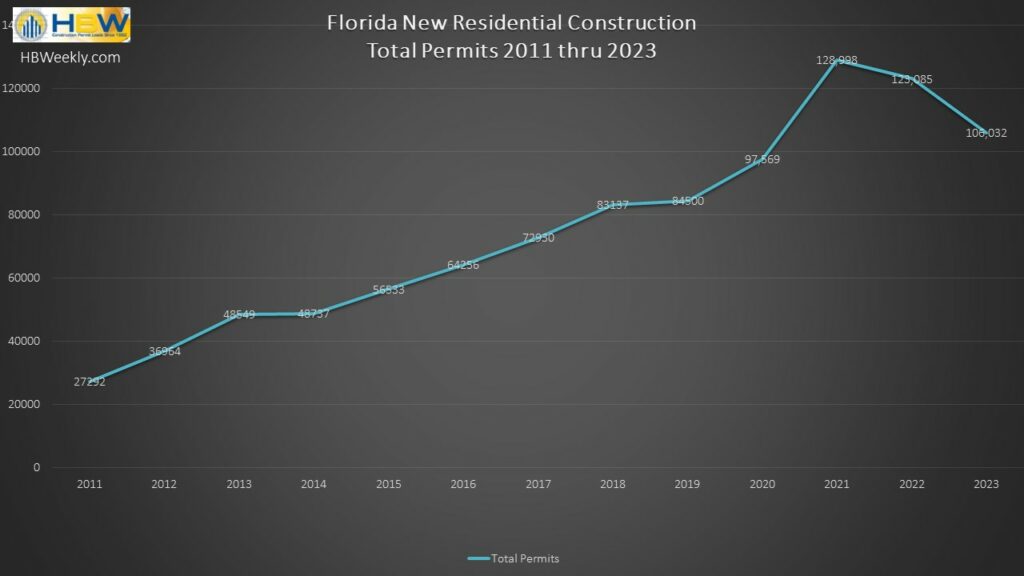
HBW Report: Florida Residential Construction 2023

The annual Building Activity Trend Reports for new residential construction in Florida have been released by HBW, and based on the figures published through the 4th quarter of 2023, there was a 15 percent year-over-year decrease in new home construction, resulting in more than 106,030 new permits on record with HBW.  The report was based on new residential construction permits from six major regions of Florida (Central, West, Southeast, Southwest, Northeast, Northwest), and all regions exhibited year-over-year decreases in new home construction ranging from -7 percent to -20 percent. 

Out of the six regions reviewed, the greatest concentration of housing starts could be found in West Florida, where there were 24,936 new residential construction permits on record, reflecting a 12 percent year-over-year decrease in new home construction.

Here is a closer look at the reports and a breakdown of the total permits, annual change in new construction activity, leading counties for new permits and the totals for higher value properties in the Sunshine State last year:

West Florida

Total Permits: 24,936

% Annual Change – YTD (2022 vs. 2023): -12%

Top County for New Construction: Pasco County (7,017 permits)

Total Permits for Higher Value Homes (>$500k): 1,890

Southwest Florida

Total Permits: 23,879

% Annual Change – YTD (2022 vs. 2023): -16%

Top County for New Construction: Lee County (8,104 permits)

Total Permits for Higher Value Homes (>$500k): 2,037

Northeast Florida

Total Permits: 19,427

% Annual Change – YTD (2022 vs. 2023): -17%

Top County for New Construction: St. Johns County (5,104 permits)

Total Permits for Higher Value Homes (>$500k): 1,034

Central Florida

Total Permits: 16,120

% Annual Change – YTD (2022 vs. 2023): -20%

Top County for New Construction: Orange County (4,358 permits)

Total Permits for Higher Value Homes (>$500k): 1,951

Northwest Florida

Total Permits: 12,202

% Annual Change – YTD (2022 vs. 2023): -7%

Top County for New Construction: Bay County (2,116 permits)

Total Permits for Higher Value Homes (>$500k): 1,123

Southeast Florida

Total Permits: 9,468

% Annual Change – YTD (2022 vs. 2023): -14%

Top County for New Construction: St. Lucie County (4,168 permits)

Total Permits for Higher Value Homes (>$500k): 1,297

To gain more information on the builders, homeowners and permits for the construction activity above, check out HBW for your copy of the latest construction data reports. To gain access to the HBW database and receive custom and detailed reports on the latest residential and commercial building activity in Florida, Georgia, Texas, Alabama, and Oklahoma, please contact HBW for details.
Florida Annual Report: Swimming Pool Construction 2023

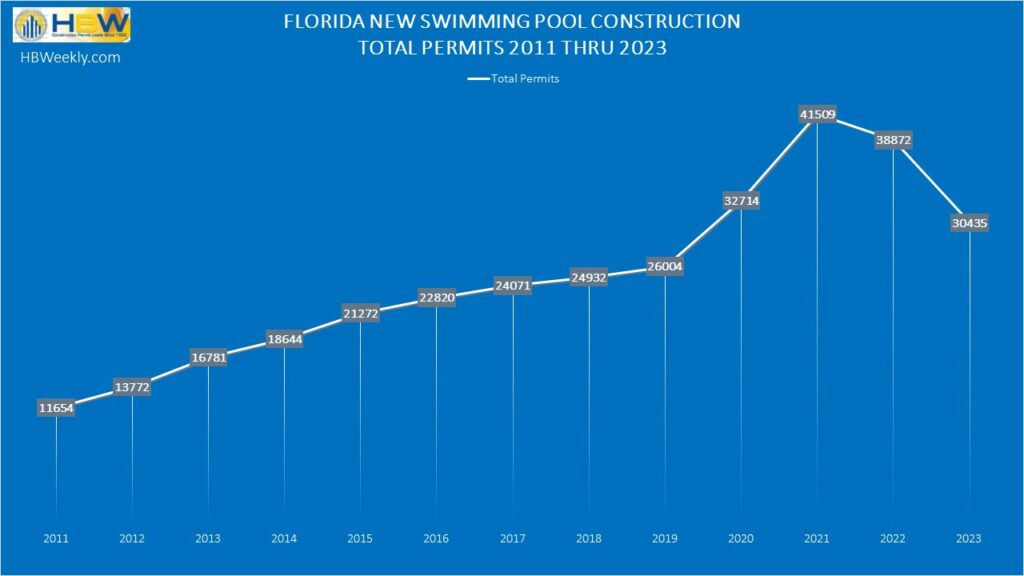
As noted in the graph above, new swimming pool construction was on a steady climb in Florida since 2011, and in 2022, the market slowed. Based on the latest Swimming Pool Construction Activity Trend Reports from HBW, it is clear that the decline in construction has continued through last year. From January through December of 2023, there have been 30,435 new swimming pool permits added to the HBW database, reflecting a 22 percent year-over-year decrease in new swimming pool construction activity in the Sunshine State.

In the six regions reviewed (Southwest, Southeast, Northwest, Northeast, Central, West) there were marked decreases in new pool construction ranging from -12 percent to -27 percent, with the highest concentration of new pool construction activity taking place in the southwestern region (8,683 permits) where there was a 25 percent year-over-year decrease in new pool permits.

Here is a closer look at the total number of new permits on record in each Florida region reviewed, as well as the leading counties and annual % change in permitting activity:

Southwest

As previously mentioned, the southwestern region of Florida experienced a 25 percent year-over-year decrease in new pool construction last year, resulting in 8,683 new permits added to the HBW database.  Out of the five counties that make up the southwest, Lee County (2,712 permits) held the greatest amount of new pool construction and exhibited a 24 percent annual decline in new pool construction.

Southeast

Last year, the southeastern region of Florida demonstrated a 27 percent year-over-year decrease in new pool construction activity that resulted in approximately 5,680 new permits on record with HBW.  Out of the seven counties that make up the southeast, Palm Beach (1,938 permits) had the highest concentration of new pool permits and reflected a 26 percent year-over-year decrease in construction.

West

Not far behind the southeast, the western region of Florida ranked #3 for new pool construction last year, having nearly 5,300 new permits which resulted from a 23 percent year-over-year decrease in new pool construction activity.  Out of the seven counties that make up the area, close to half of all new permits originated from Hillsborough County (1,707 permits) and Polk County (873 permits) where there were year-over-year decreases in pool construction of 16% and 35% respectively.

Central

Last year, Central Florida demonstrated an 18 percent year-over-year decrease in new swimming pool construction, resulting in 4,564 new permits on record with HBW.  Out of the six counties reviewed, more than half of all new permits originated from the counties of Orange (1,589 permits) and Brevard (924 permits) where there were year-over-year declines in new construction of 19% and 16% respectively.

Northeast

In the northeastern region of Florida, there were nearly 3,200 new pool permits added to the HBW last year, reflecting an 18 percent year-over-year decrease in new swimming pool construction.  Out of the eight counties that make up the northeast, more than half of all new construction took place in the counties of St. Johns (1,129 permits) and Duval (634 permits) where there were annual decreases in pool construction of 22% and 18% respectively.

Northwest

Last year, there were approximately 3,025 pool starts in the northwest as a result of a 12 percent year-over-year decrease in new swimming pool construction.  Out of the eighteen counties reviewed, the greatest concentration of new permits could be found in Walton County, where there was a 9 percent year-over-year decrease in new pool construction that resulted in approximately 580 new permits added to the HBW database.

To gain more information on the builders, homeowners and permits for the construction activity above, check out HBW for your copy of the latest construction data reports. To gain access to the HBW database and receive custom and detailed reports on the latest residential and commercial building activity in Florida, Georgia, Texas, Alabama, and Oklahoma, please contact HBW for details.
Annual Report – Texas Residential Construction 2023

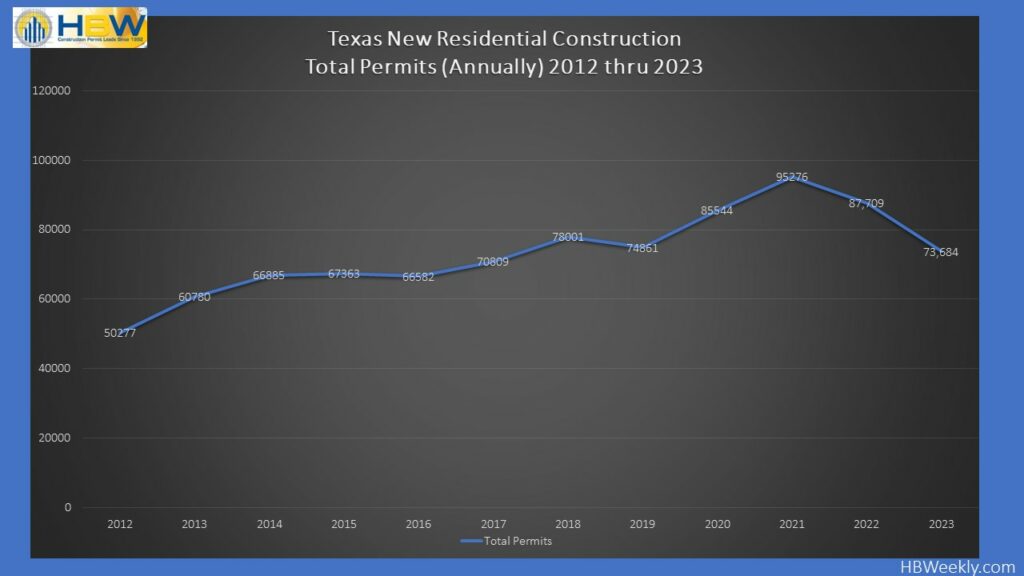
Based on the latest Building Activity Trend Reports for new residential construction in 2023, the Lone Star State has continued to reflect a year-over-year decline in construction.  From January through December 2023, there were approximately 73,685 new residential construction permits added to the HBW database for Texas, reflecting a 16 percent year-over-year decrease in new residential construction activity.  Out of the four major Metro areas reviewed (Dallas, Houston, Austin, San Antonio), both Houston and Dallas carried the highest volume of housing starts, with more than 80 percent of all new residential construction permits in Texas originating from those areas. 

Here is a closer look at the total permits, annual percentage of change and leading counties for new residential construction across Texas last year:

Houston

Last year, Houston carried the greatest volume of housing starts (34,301 permits) in comparison to other Texas metro areas reviewed, having experienced a 7 percent year-over-year decrease in new residential construction activity. Out of the five counties that make up the Houston area, nearly 50 percent of all new home construction took place in Harris County, where there was close to a 3 percent year-over-year increase in new home construction that resulted in 16,555 new permits on record with HBW.

Dallas

In Dallas, there were 25,741 new residential construction permits on record for 2023, reflecting a 15 percent year-over-year decrease in construction.  Out of the six counties that make up the Dallas area, the greatest concentration of new permits originated from the counties of Tarrant (7,549 permits) and Collin (7,202 permits) where there were year-over-year decreases in new home construction of 14 percent and 10 percent respectively.

Austin

Last year, there were approximately 6,995 new residential construction permits added to the HBW database for the Austin area, reflecting a 43 percent year-over-year decrease in new home construction.  Out of the four counties included in the Austin-area report, Travis County carried nearly half of all new residential construction activity, having 3,394 new permits on record with HBW for the one-year period.

San Antonio

Last year, there were approximately 6,650 new residential construction permits on record for the San Antonio area, reflecting a 22 percent year-over-year decrease in new permits.  Out of the three counties that make up the San Antonio area, the bulk of construction activity took place in Bexar County where there were nearly 4,200 new permits, reflecting a 14 percent year-over-year decrease in new home construction.

To gain more information on the builders, homeowners and permits for the construction activity above, check out HBW for your copy of the latest construction data reports. To gain access to the HBW database and receive custom and detailed reports on the latest residential and commercial building activity in Florida, Georgia, Texas, Alabama, and Oklahoma, please contact HBW for details.
Texas Annual Report: Swimming Pool Construction 2023

The Annual Construction Activity Trend Reports by HBW are now available and provide powerful data and insight into new construction activity. Today, we utilized the Trend Reports to review new swimming pool construction across Texas during 2023.

With a 31 percent year-over-year decrease in new pool construction permits last year, it appears that the previous growth pattern for new pool construction in Texas has ceased, and the market has taken a downward turn for the first time in over five years. From January through December, there were 9,137 new swimming pool permits from the combined metro areas of Dallas, Houston, Austin, and San Antonio, with each area exhibiting year-over-year declines in construction ranging from -21 percent to -33 percent.

Here is a closer look at the total permits and leading counties for new swimming pool construction in each of the four major metropolitan areas of Texas last year:

Dallas

Out of the four Texas regions reviewed, Dallas carried the highest volume of new pool construction activity last year, having 4,300 new permits on record for the period, reflecting a 31 percent year-over-year decrease in permits.  Out of the six counties that make up the Dallas area, nearly half of all new construction took place in the two counties of Dallas (1,069 permits) and Collin (1,038 permits) where there were year-over-year decreases in pool permits of 16 percent and 36 percent respectively.

Houston

In Houston, there approximately 2,540 new swimming pool construction permits added to the HBW database last year, reflecting a 33 percent year-over-year decrease in new pool construction.  Out of the five counties that make up the Houston area, the bulk of new permits originated from the County of Harris where there were 1,634 permits for the year, reflecting a 24 percent year-over-year decrease in new swimming pool construction.

Austin

Last year, there was a 32 percent year-over-year decrease in new swimming pool construction in the Austin area, resulting in approximately 1,375 new permits on record with HBW.  Out of the four counties that make up the Austin area, Travis County held the greatest concentration of new pool construction activity, having approximately 1,065 permits on record with HBW, reflecting a 31 percent year-over-year decrease in construction.

San Antonio

In San Antonio, there were approximately 925 new swimming pool construction permits added to the HBW database last year, reflecting a 21 percent year-over-year decrease in new construction activity.  Out of the three counties that make up the San Antonio area, Bexar County held the greatest concentration of new pool construction, having approximately 650 new permits on record, reflecting a 24 percent year-over-year decrease in construction.

To gain more information on the builders, homeowners and permits for the construction activity above, check out HBW for your copy of the latest construction data reports. To gain access to the HBW database and receive custom and detailed reports on the latest residential and commercial building activity in Florida, Georgia, Texas, Alabama, and Oklahoma, please contact HBW for details.

Florida Top Home Builders – December 2023

Based on the latest construction data reports from HBW, there were approximately 7,575 new residential construction permits with a total value of nearly $2.3 billion in Florida last month.  Out of the five major regions reviewed (Tampa, Southwest, Orlando, Southeast, Jacksonville), the greatest volume of new home construction took place in Tampa (2,375 permits), while the highest average value of construction could be found in the southeastern region of the state (average value: $381,361).

Here is a closer look at the total permits, average value of construction and leading counties throughout the Sunshine State during the month of December 2023:

Tampa

As previously noted, Tampa held the greatest amount of new residential construction activity last month having 2,375 new permits with a total value in excess of $661.2 million.  The average value of new home construction in the Tampa area was $278,421, and more than half of all new permits originated from the counties of Pasco (830 permits) and Sumter (526 permits).

Southwest

In the southwestern region of Florida, there were 2,066 new residential construction permits with a total value of $568 million.  The average value of new home construction was lowest in the southwest (average value: $274,939) in comparison to other regions reviewed, and more than half of all new permits originated from the counties of Lee (718 permits) and Manatee (444 permits).

Jacksonville

In Jacksonville, there were 1,193 new residential construction permits with a total value of $328.5 million added to the HBW database last month. The average value of new home construction landed on the lower end of the spectrum in Jacksonville (average value: $275,392) in comparison to other Florida regions reviewed, and the majority of all new residential construction took place in the counties of St. Johns (389 permits) and Duval (388 permits).

Orlando

Last month, there were 1,100 new residential construction permits with a total value of $397.4 million added to the HBW database for the Orlando area. The average value of new home construction landed on the higher end of the spectrum (average value: $361,276) in comparison to other Florida regions reviewed, and the counties with the highest concentration of new construction activity were Orange (333 permits) and Brevard (277 permits).

Southeast

Last month, there were approximately 840 new residential construction permits with a total value of $320 million in the southeastern region of Florida.  The average value of new home construction was highest in the southeast (average value: $381,361) in comparison to other regions reviewed, and the counties with the greatest concentration of new residential construction activity were St. Lucie (281 permits) and Palm Beach (226 permits).

To gain more information on the builders, homeowners and permits for the construction activity above, check out HBW for your copy of the latest construction data reports. To gain access to the HBW database and receive custom and detailed reports on the latest residential and commercial building activity in Florida, Georgia, Texas, Alabama, and Oklahoma, please contact HBW for details.
Florida Swimming Pool Construction Report – December 2023

In Florida, there were approximately 2,200 new swimming pool construction permits with a total value of nearly $166 million added to the HBW database during the month of December.  Out of the five major regions reviewed (Southwest, Tampa, Orlando, Southeast, Jacksonville), the greatest concentration of new swimming pool construction could be found in the southwestern region where there 856 new permits for the one-month period.  When looking for the highest average value of new swimming pool construction, Jacksonville was a standout having an average value of new swimming pool of nearly $93,200.

Here is a closer look at the total permits, construction values and leading counties for new swimming pool construction activity in Florida during the month of December 2023:

Southwest

As previously mentioned, the greatest concentration of new swimming pool construction permits originated from the southwestern region of Florida, where there were 856 new permits with a total construction value in excess of $65.1 million.  The average value of new pool construction landed mid-range in the southwest (average value: $76,084) in comparison to other Florida regions reviewed, and 60 percent of all new construction took place in the counties of Lee (332 permits) and Collier (222 permits).

Southeast

The southeastern region of Florida ranked #2 for new swimming pool construction last month, having just over 480 new permits with a total construction value of approximately $35 million on record with HBW.  The average value of new pool construction was $72,379, and more than half of all new permits originated from the counties of Palm Beach (173 permits) and Broward (87 permits).

Tampa

In Tampa, there were 332 new swimming pool construction permits with a total value of $27.3 million last month.  The average value of new pool construction landed on the higher end of the spectrum in Tampa (average value: $82,235) in comparison to other regions reviewed, and just over half of all new permits originated from the counties of Hillsborough (107 permits) and Pasco (62 permits).

Orlando

Last month, there were approximately 320 new swimming pool construction permits with a total value of nearly $19 million added to the HBW database for the Orlando area.  The average value of new pool construction was lowest in Orlando (average value: $59,470) in comparison to other regions reviewed, and just over half of all new construction activity took place in the two counties of Orange (84 permits) and Lake (82 permits).

Jacksonville

In the Jacksonville area, there were 210 new swimming pool construction permits with a total value of approximately $19.6 million during the month of December.  The average value of new swimming pool construction was highest in Jacksonville (average value: $93,193) in comparison to other Florida regions reviewed, and nearly half of all new permits originated from St. Johns County (98 permits).

To gain more information on the builders, homeowners and permits for the construction activity above, check out HBW for your copy of the latest construction data reports. To gain access to the HBW database and receive custom and detailed reports on the latest residential and commercial building activity in Florida, Georgia, Texas, Alabama, and Oklahoma, please contact HBW for details.

Annual Review – Metro Atlanta Swimming Pool Construction 2023

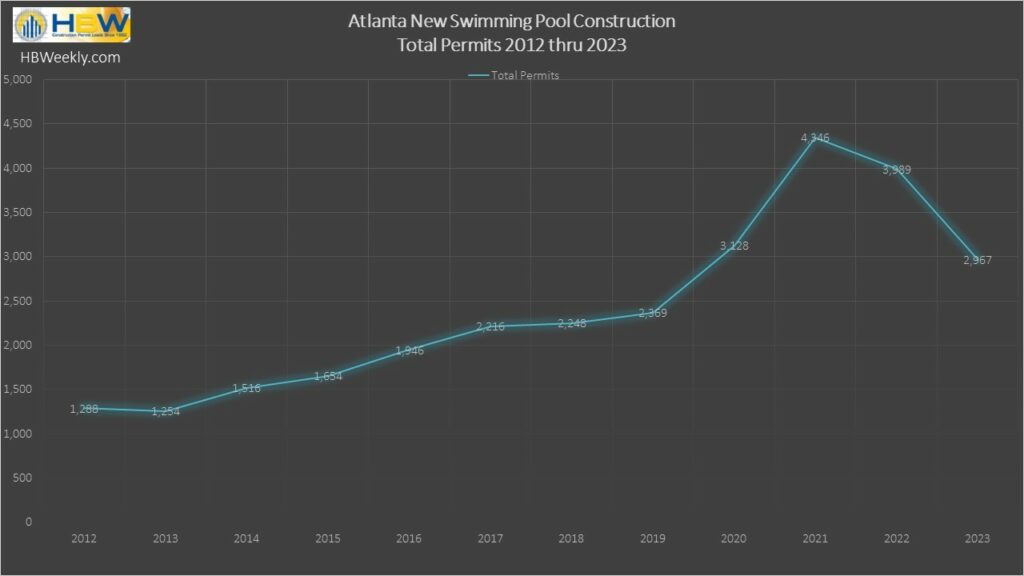
When it comes to new swimming pool construction in the Metro Atlanta area, a significant decline was evident in 2023. Last year, there was a 29 percent year-over-year decrease in new swimming pool construction, marking the steepest annual decline for the area in more than twelve years.

From the twenty-four counties that make up the Metro Atlanta area, there were approximately 2,970 new swimming pool construction permits added to the HBW database for the one-year period.  The bulk of new construction originated from six counties where nearly 60 percent of all new swimming pool construction took place last year; those counties are as follows:

Fulton County

Last year, Fulton County ranked #1 for new swimming pool construction, having nearly 540 new permits on record with HBW, reflecting a 30 percent year-over-year decrease in new construction.

Gwinnett County

The county that ranked #2 for new swimming pool construction was Gwinnett; last year, there were 265 new permits added to the HBW database for Gwinnett County, reflecting 27 percent year-over-year decrease in new pool construction.

Cobb County

Just slightly behind Gwinnett, Cobb County was third in line for new pool construction in 2023. In Cobb, there were 264 new permits resulting from a 33 percent year-over-year decrease in new swimming pool construction.

Forsyth County

In Forsyth County, there was a 25 percent year-over-year decrease in new swimming pool construction last year, resulting in 236 new permits on record with HBW.

Coweta County

Last year, there were 211 new swimming pool construction permits added to the HBW database for Coweta County, reflecting a 19 percent year-over-year decrease in new pool construction.

Cherokee County

In line with Coweta County, there were 211 new permits on record for Cherokee County in 2023, reflecting a 31 percent year-over-year decrease in swimming pool construction.

Information utilized for the above listed figures for Metro Atlanta swimming pool construction was directly derived from HBW construction data reports. To gain access to the HBW database and receive custom and detailed reports on the latest residential and commercial building activity in Florida, Georgia, Texas, Alabama, and Oklahoma, please contact HBW for details.
Atlanta Residential Construction Annual Report – 2023

As we say goodbye to 2023 and begin 2024, HBW is in the process of reviewing construction permit data over the last year to identify building trends and areas where there have been gains (and losses) in the market.  HBW construction data reports provide an in-depth and detailed overview of everything from leading contractors to the number of permits and construction values for any given area, and today we are looking at new residential construction activity in the Metro Atlanta area.

Last year, there were 21,600 new residential construction permits added to the HBW database for the Metro Atlanta area, reflecting a 15 percent year-over-year decrease in new residential construction.  Out of the twenty-four counties that make up the area, five counties carried nearly 50 percent of all new construction activity, and those counties were as follows:

Gwinnett County

Gwinnett County ranked #1 for new home construction last year, having 3,550 new permits on record with a steady market that was on par with the previous year.  This new stability is a good sign for the area considering 2022 had demonstrated a major year-over-year decrease (-21%) in new home construction.  

Cherokee County

Last year, there were approximately 1,895 new residential construction permits in Cherokee County, reflecting a 19 percent year-over-year decrease in new home construction.  Over the last five years, the area has demonstrated incremental increases in housing starts (with the exception of 2021), and the marked downward shift last year is both significant and not typical for the area.

Fulton County

In Fulton County, there were approximately 1,770 new residential construction permits last year, reflecting a 12 percent year-over-year decrease in new home construction. Although the year-over-year dip in new construction is not as significant as 2022, new permits have been steadily declining and new home construction has been slowing in the area over the last two years.

Cobb County

With a 2 percent year-over-year decrease in new residential construction permits, Cobb County had more than 1,510 housing starts on record in 2023.  Since 2019, Cobb County has exhibited an inconsistent market for residential construction, with some years faring better than others. Last year, there was minimal year-over-year change which may be indicative of some steadiness in the market ahead.

Paulding County

Last year, there were 1,315 new residential construction permits added to the HBW database for Paulding County, reflecting a steady market that was right in line with figures from the previous year. Over the last few years, new home construction has been rapidly on the rise in Paulding, and in 2023, it appears that those previous gains are holding and perhaps reaching a temporary plateau.

Information utilized for the above listed figures for Metro Atlanta residential construction was directly derived from HBW construction data reports. To gain access to the HBW database and receive custom and detailed reports on the latest residential and commercial building activity in Florida, Georgia, Texas, Alabama, and Oklahoma, please contact HBW for details.

Texas Top Home Builders – December 2023

Last week, we reviewed the latest construction permit data available from HBW to report on new residential construction in Texas; through the reports, we found there were approximately 6,110 new residential construction permits with a total value of $1.8 billion added to the HBW database for the Lone Star State last month. Today, we are taking a look at the same construction data reports to identify the leading contractors that held the highest volume of housing starts last month.  And while each Metro area of Texas has its own unique lineup of leading home builders, there have been two major players in the market month after month – From across the four major areas reviewed (Houston, Dallas, Austin, San Antonio), both Lennar Homes and D.R. Horton continue to carry the highest concentration of new residential construction activity, having approximately 706 and 565 permits on record respectively for the one-month period.

Here is a closer look at the top five builders for each Metro area in Texas based on the total number of permits on record with HBW during the month of December 2023:

Houston

BuilderTotal Permits Average Value
1-Lennar Homes521 $      223,004.00
2-D.R. Horton431 $      250,945.00
3-Meritage Homes158 $      278,902.00
4-Pulte Homes152 $      248,644.00
5-David Weekley Homes150 $      238,819.00

Dallas

BuilderTotal Permits Average Value
1-D.R. Horton107 $      337,066.00
2-First Texas Homes89 $      446,158.00
3-Bloomfield Homes65 $      373,639.00
4-Lennar Homes65 $      227,893.00
5-Highland Homes55 $      443,092.00

Austin

BuilderTotal Permits Average Value
1-Taylor Morrison Homes70 $      287,767.00
2-Perry Homes46 $      373,196.00
3-Pulte Homes40 $      364,920.00
4-GFO Homes35 $      258,420.00
5-Lennar Homes32 $      238,010.00

San Antonio

BuilderTotal Permits Average Value
1-Lennar Homes88 $      157,758.00
2-National Home Corp40 $      180,309.00
3-KB Homes37 $      225,059.00
4-Sitterle Homes23 $      168,290.00
5-Continental Homes of Texas21 $      200,140.00

To gain more information on the builders, homeowners and permits for the construction activity above, check out HBW for your copy of the latest construction data reports. To gain access to the HBW database and receive custom and detailed reports on the latest residential and commercial building activity in Florida, Georgia, Texas, Alabama, and Oklahoma, please contact HBW for details.