Texas Swimming Pool Construction Review – December 2021

An overview of permit data for new swimming pool construction in Texas during the month of December 2021

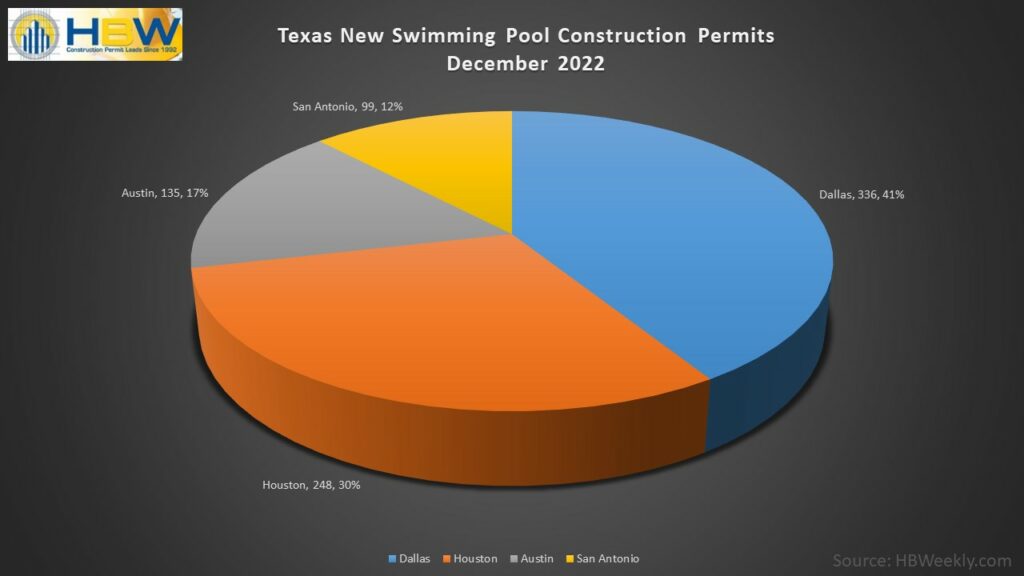
Based on HBW’s latest construction data reports, there were 915 new swimming pool permits with a total value in excess of $51.4 million in Texas last month.  Out of the four major metro areas included in the reports (Houston, Dallas, Austin, San Antonio), the greatest amount of new pool construction activity took place in Dallas (448 permits), while the highest average value of new pool construction projects could be found in Houston (average value: $73,698).

Here is a closer look at swimming pool construction permit data on record for the Lone Star State during the month of December:

Dallas

As previously noted, Dallas held the highest level of new pool construction activity out of the four metro areas reviewed, having 448 new permits with a total construction value of nearly $22 million last month.  The average value of new pool construction was $49,009, and the majority of all new permits originated from the two counties of Collin (149 permits) and Tarrant (114 permits).

Out of the nearly 175 pool builders with new construction activity on record in Dallas last month, the following ranked as the top three for total new permits during the one-month period:

Builder
1-Riverbend Pools
2-BMR Pools
3-Puryear Custom Pools

Houston

In Houston, there were more than 270 new swimming pool construction permits with a total value of nearly $20 million on record last month.  The average value of new construction was highest in Houston (average value: $73,698) in comparison to other Texas areas reviewed, and more than half of all new permits originated from Harris County (165 permits).

Out of the more than 130 pool builders with new permits on record in the Houston area last month, the following ranked as the top three for total new permits:

Builder
1-Platinum Pools
2-Anthony & Sylvan Pools
3-The Pool Man

Austin

Last month, there were approximately 135 new swimming pool permits with a total construction value of $7.5 million in the Austin area.  The average value of new pool construction was $55,641, and nearly all construction activity took place in Travis County where there were 111 new permits on record for the one-month period.

Out of the nearly 75 companies with new swimming pool construction on record in Austin last month, the following ranked as the top three for total new permits:

Builder
1-Cody Pools
2-Anthony & Sylvan Pools
3-Majestic Poolscape

San Antonio

Last month, San Antonio held the lowest level of new pool construction activity in comparison to other Texas areas reviewed, as well as the lowest average value of construction.  During December, there were 62 new swimming pool permits with a total value in excess of $2 million added to the HBW database for San Antonio.  The average value of construction was $32,853, and the majority of new permits originated from Bexar County (45 permits).

Out of more than 25 companies with new swimming pool permits on record in the area last month, the following ranked as the top three for total new permits:

Builder
1-Keith Zars Pools
2-Cody Pools
3-Blue Haven Pools

To gain more information on the builders, homeowners and permits for the construction activity above, check out HBW for your copy of the latest construction data reports. To gain access to the HBW database and receive custom and detailed reports on the latest residential and commercial building activity in Florida, Georgia, Texas, Alabama, and Oklahoma, please contact HBW for details.

HBW Report: Texas Residential Construction – December 2021

An overview of permit data for new home construction in Texas during the month of December 2021

Last month, there were more than 6,550 new residential construction permits with a total value in excess of $1.7 billion added to the HBW database for the Lone Star State.  Out of the four major metro areas included in the report (Dallas, Houston, Austin, San Antonio), the greatest concentration of new residential construction activity could be found in Houston (3,107 permits), while the highest average value of new home construction took place in Dallas (average value: $304,191).

In order to better understand new home construction activity by region, as well as where the greatest amount of new permitting activity is taking across the state, we used HBW construction data reports to identify the regions and counties with the greatest amount of new home construction last month, as well as the leading home builders driving those figures.

Here is an overview of new residential construction permit data in Texas for the month of December:

Total Permits

As previously mentioned, there were more than 6,550 new residential construction permits on record with HBW for Texas the month of December.  This figure represents the total number of permits on record with HBW from the four metro regions of Dallas, Houston, Austin, and San Antonio. As displayed in the chart below, more than 80 percent of all new home construction activity took place in Houston and Dallas:

Average Value

Last month, the average value of new home construction across Texas ranged from a low of $232,592 (Houston) to a high of $304,191 (Dallas):

Leading Counties

When reviewing reports from a county-by-county perspective, there were several counties that held significantly higher amounts of new home construction than others; the top five counties for new home construction (based on total permits) in Texas last month are as follows:

Top Home Builders

From the combined reports for each metro region, there were three home builders that were standouts as they were responsible for approximately 25 percent of all new home construction in Texas last month; those home builders are as follows:

  1. D.R. Horton (788 permits)
  2. Lennar Homes (575 permits)
  3. Pulte Homes (242 permits)


To gain more information on the builders, homeowners and permits for the construction activity above, check out HBW for your copy of the latest construction data reports. To gain access to the HBW database and receive custom and detailed reports on the latest residential and commercial building activity in Florida, Georgia, Texas, Alabama, and Oklahoma, please contact HBW for details.
Atlanta Residential Construction Annual Review – 2021

A report on permit data for new residential construction in the Atlanta area from January through December 2021

The stats are in, and HBW Building Activity Trend Reports have been finalized for new home construction in the Atlanta area.  According to the most recent report, there were 28,300 new residential construction permits added to the HBW database for the Metro Atlanta area last year, reflecting an impressive 33 percent year-over-year increase in new home construction. 

Since 2018, new residential construction in the Metro Atlanta area has been steadily and slowly declining, with the total number of permits on record slightly decreasing year after year. Upon review of the latest figures from 2021, it looks like the area is rebounding, resulting in Atlanta’s first year-over-year increase in new home construction since 2018.

When reviewing the reports from a county-by-county perspective, there are a few counties where new residential construction appeared to increase significantly last year… For example, in Fulton County there were nearly 2,600 housing starts last year, reflecting a 53 percent year-over-year increase in new home construction.  Additionally, Fayette County climbed out of its three-year decline, having a hefty 67 percent year-over-year increase in housing starts last year which resulted in approximately 715 new residential construction permits on record.  Another county that previously demonstrated a declining market (since 2019) and came out strong last year is Dawson County; in Dawson there was a 72 percent year-over-year increase in new home construction, resulting in more than 470 new permits on record with HBW.

When reviewing permit data to identify counties carrying the highest concentration of new home construction, the three counties that topped the list include Gwinnett, Fulton and Forsyth; all three counties demonstrated year-over-year increases ranging from 16 percent to 53 percent and have a combined total of approximately 9,480 permits, which reflects about 34 percent of all new home construction in the Atlanta area last year.

Gwinnett County led the Metro Atlanta area by having the highest total number of new permits on record with HBW for the one-year period. Last year, there were more than 4,500 new residential construction permits added to the HBW database for the area, reflecting a 21 percent year-over-year increase in new home construction.

While Fulton County (2,598 permits), ranked second-highest for total new permits on record in 2021, it was #1 for higher value residential construction (value greater than $500k) as approximately 18 percent of all new permits held values greater than $500k.

Finally, Forsyth County appears to be gaining upward momentum from the declining market that was evident from 2017-2019.  In 2020, the market started looking up as there had been a 10 percent year-over-year increase in new home construction, and in 2021 the upward pattern continued with a 16 percent year-over-year increase, resulting in 2,376 new residential construction permits during the one-year period.

Information utilized for the above listed figures for Metro Atlanta residential construction was directly derived from HBW construction data reports. To gain access to the HBW database and receive custom and detailed reports on the latest residential and commercial building activity in Florida, Georgia, Texas, Alabama, and Oklahoma, please contact HBW for details.
Annual Report: Atlanta Swimming Pool Construction- 2021

A review of new swimming pool construction activity in 2021 based on permit data from HBW

Happy New Year! Quite a bit has changed (and continues to change) over the last year; from safety and health protocols to supply shortages, the construction industry has experienced its fair share of hurdles. Despite the challenges, new construction and permitting activity has been plentiful, providing new and refreshed data in the HBW database.

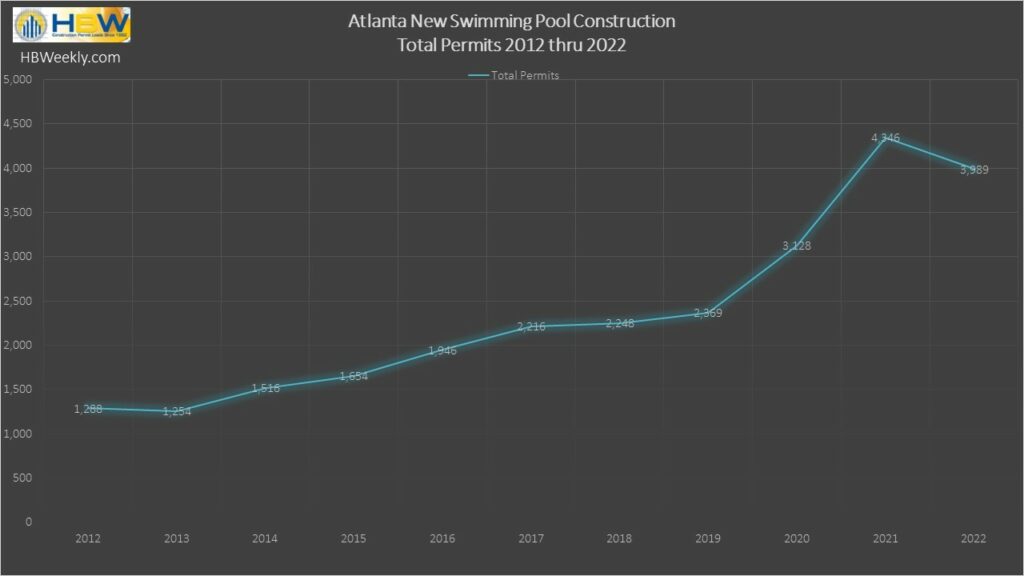
When it comes to new swimming pool construction in the Atlanta area, 2021 proved to be a year of gains. With more people homebound than ever before, a demand for home improvements such as new swimming pools have been on a steep rise. In 2021 alone, there was a 55 percent year-over-year increase in new swimming pool construction in the Atlanta area, resulting in 4,346 new permits on record with HBW.

Out of the twenty-four counties that make up the Metro Atlanta area, there were five counties from where approximately 60 percent of all new swimming pool construction took place last year; those counties are as follows:

Fulton County

Last year, Fulton County ranked #1 for new swimming pools, having exhibited a 75 percent year-over-year increase in new pool construction, resulting in 830 new permits on record with HBW for the one-year period.

Cobb County

Cobb County ranked #2 for new pool construction in 2021, as there were 549 new permits, reflecting a 38 percent year-over-year increase in new swimming pool construction.

Gwinnett County

The county with the third-highest level of new swimming pool construction was Gwinnett; last year, there were 416 new swimming pool permits added to the HBW database for Gwinnett County, reflecting 19 percent year-over-year increase in new pool construction.

Cherokee County

Last year, there were nearly 400 new swimming pool construction permits added to the HBW database for Cherokee County, reflecting an 8 percent year-over-year increase in new pool construction.

Forsyth County

Similar to Cherokee County, Forsyth County also had nearly 400 new swimming pool construction permits on record for 2021; this reflects a 78 percent year-over-year increase in new pool construction activity for the area.

To gain more information on the builders, homeowners and permits for the construction activity above, check out HBW for your copy of the latest construction data reports. To gain access to the HBW database and receive custom and detailed reports on the latest residential and commercial building activity in Florida, Georgia, Texas, Alabama, and Oklahoma, please contact HBW for details.

Mark Your Calendars: Construction Industry Expos 2022

A list of industry conventions and expos that are coming up in early 2022

For the last couple of years, we have put a lot on hold, including in-person industry events and expos.  And while pandemic news seems to fluctuate, along with restrictions and requirements, many industry expos are still carrying on and working to connect and expand the networks of industry professionals across the nation.

With the new year here and our sights set on 2022, we gathered a few industry events that you may want to consider in the coming months.  Here are five upcoming industry conventions and trade shows that are on the calendar for early 2022:

  • FWCCA Trade Show and Convention

Date: January 26-27, 2022

Location: Gaylord Palms Resort & Convention Center – Orlando, Florida

Details: The Florida Wall & Ceiling Contractors Association is the voice of the Florida wall and ceiling industry. Made up of contractors and industry allies, FWCCA represents the needs and concerns of wall and ceiling contractors. 

Website: http://www.fwcca.com

  • NAHB International Builders Show (IBS) – National Association of Home Builders 2022

Date: February 8-10, 2022

Location: Orange County Convention Center – Orlando, Florida

Details: The NAHB International Builders’ Show® (IBS) is the premier, annual event that connects, educates, and improves the residential construction industry; it offers new product launches, construction demos, industry thought leader sessions, workshops, panel discussions, and more.

Website: www.buildersshow.com

  • 2022 IIBEC International Convention and Trade Show

Date: March 17-22, 2022

Location: Rosen Shingle Creek – Orlando, Florida

Details: International Institute of Building Enclosure Consultants – IIBEC’s premier annual event features over 17 hours of live, in-person educational seminars, a two-day trade show, and live product demonstrations.

Website: https://iibec.org/2022-iibec-international-convention-and-trade-show/

  • Dallas Build Expo

Date: March 16-17, 2022

Location: Kay Bailey Hutchinson Convention Center, Dallas, Texas

Details: The Build Expo is an annual event that occurs in several locations throughout the U.S., displaying thousands of industry products and offering networking and educational opportunities with 20+ expert and accredited classes. 

Website: http://buildexpousa.com/dallas-build-expo/

  • Tampa Build Expo

Date: May 10-11, 2022

Location: Tampa Convention Center – Tampa, Florida

Details: The Build Expo Tampa 2022 is an important trade show and exhibition that connect buyers, suppliers, manufacturers, and service providers for developing new connections, learning about new techniques and technology, and gaining valuable industry knowledge.

Website: http://buildexpousa.com/tampa-build-expo/


For more information on construction business and marketing tips, stay connected with the HBW Blog.  To get ahead of construction activity and gain access to the latest permitting data in Florida, Texas, Georgia, Alabama and Oklahoma, contact HBW for more information on construction data reports and industry leads.

How to Use HBW Construction Data Reports – Part II

A continued list of tips for using HBW permit data and leads to benefit your business in 2022

Last week, we took a little time to review some of the easiest ways to use HBW construction data reports to benefit your business.  Today, we are continuing the list and adding three more ways to utilize your leads and permit data generated from HBW. 

Moving on from the basics in Part I, here are a few more steps you can take to map out the right path for applying HBW’s reports to your marketing strategy and efforts in the coming year:

  • Follow the Values – Do you know where higher value construction projects are taking place?  Do you know which communities have a higher saturation of new construction and/or remodels?  This information can easily be gathered by using the permit data provided in HBW reports.  By tracking project values and identifying where industry money is going in your state, region or county, you can tighten or expand your market focus to where interest and expenses for your services are on the rise.
  • Move Away from Declines– While every region will have its fair share of ebb and flow when it comes to residential and commercial construction, a marked and consistent decline in new construction and renovations may be a signal to shift your marketing efforts to a more favorable region.  By using construction data reports from the archives, you can analyze construction patterns in different regions over a period of time to move away from declining projects and hone in on the counties and regions where your services will be in greatest demand.
  • Let History be Your Guide – In addition to providing insight on patterns in various markets, historical data can also be your guide for predicting where and which properties will need renovations.  From aging roofs and flooring to swimming pool upgrades and property maintenance, you can strategically use permit data to cater to property owners’ current and future needs.


For more information on utilizing construction data reports and to gain access to construction business marketing tips, stay connected with the HBW Blog.  To get ahead of construction activity and access the latest permitting data in Florida, Texas, Georgia, Alabama and Oklahoma, contact HBW for more information.

How to Use HBW Construction Data Reports – Part I

A guide for using your HBW permit data and leads (Part I)

With the holidays upon us and the new year just around the corner, now is the perfect time for a little inspiration and focus for marketing efforts in the new year.  Today (and in future posts), we are going to explore some of the best ways to utilize your leads and permit data generated from HBW. 

If you are already an HBW subscriber, then you are probably well aware of the options you have for reports.  From building trends, quarterly and annual market overviews to regional and builder-specific reports, there are countless ways to work with the data to best suit your needs.

For this reason, we are starting with the basics in Part I to get you started in building your plan and map for using HBW’s reports in the coming year:

  1. Build a Database – While this one may seem obvious, it is important that when you build a database, you design it for long-term success. Your database is only as good as the information entered, and how well that information is managed and updated.  Whether you choose to use a popular CRM (Customer Relationship Management) System, or you build your own database internally, it should allow for live updates from your sales team, include a key and codes for status updates, and have the capacity to expand and grow with your team as you make progress.
  2. Stay Updated – Storing contacts is one thing, but keeping those contacts updated and accurate is an entirely different ballgame. From new information received in HBW reports to feedback and actions taken by your team members, tracking activity and changes with your contacts is crucial for success. Whether there are changes to ownership and property status or service areas and customer relationships, all progress should be clearly tracked, updated and easy to identify and filter.
  3. Understand Your Market – If we have learned anything from the last year or two, it is that things change, and sometimes those changes can be rather unexpected. For this reason, it is important to have your finger on the pulse of the market in which you are focused. By using historical data from HBW’s archives and reviewing current permit data, you can begin to understand and even predict patterns in the market.  Through this practice you can identify where the demand is and will be for your services, the average value of construction in specific regions, leading competitors within any given area, fluctuations in the value of property and construction projects, and more.

While the above listed actions are just a few of the many ways to utilize HBW’s construction data and building trend reports, they play an important role in understanding your target audience and market.

For more information on utilizing construction data reports and to gain access to construction business marketing tips, stay connected with the HBW Blog.  To get ahead of construction activity and access the latest permitting data in Florida, Texas, Georgia, Alabama and Oklahoma, contact HBW for more information.

Florida Top Home Builders – November 2021

A review of the leading home builders throughout Florida during the month of November 2021

As noted in our previous post (Florida’s Top Three Counties for New Home Construction – November 2021), there were nearly 8,000 new residential construction permits in Florida last month, reflecting approximately a 5 percent month-over-month decrease in new home construction.

Today, we are taking a deeper dive into HBW construction data reports to review permit data and identify contractors that carried the greatest amount of new residential construction activity during the month of November.  While many home builders have a regional focus, there are two industry leaders that continue to stand out by having high levels of new construction activity in all regions across the Sunshine State – Both D.R. Horton and Lennar Homes were responsible for more than 20 percent of new home construction in Florida last month, having 1,118 and 895 new permits on record with HBW respectively.

Here is a closer look at the top five home builders in each of the five regions of Florida (Southwest, Tampa, Orlando, Southeast, Jacksonville) based on total number of permits on record for the month of November 2021:

Tampa

Builder Total Permits  Average Value
1-D.R. Horton 342  $      224,588.00
2-Lennar Homes 210  $      296,341.00
3-The Villages of Lake Sumter 175  $      303,800.00
4-Pulte Homes 94  $      280,737.00
5-M/I Homes 91  $      475,075.00

Southwest

Builder Total Permits  Average Value
1-D.R. Horton 261  $      232,977.00
2-Lennar Homes 201  $      144,523.00
3-Pulte Homes 182  $      223,524.00
4-Neal Communities of SW FL 78  $      203,425.00
5-Taylor Morrison 47  $      189,512.00

Orlando

Builder Total Permits  Average Value
1-D.R. Horton 267  $      274,492.00
2-Lennar Homes 234  $      272,650.00
3-Pulte Homes 95  $      322,899.00
4-Taylor Morrison 70  $      304,515.00
5-Minto Communities 59  $      281,655.00

Jacksonville

Builder Total Permits  Average Value
1-D.R. Horton 183  $      164,677.00
2-Dream Finders Construction 157  $      268,334.00
3-Lennar Homes 123  $      243,379.00
4-KB Homes 99  $      127,273.00
5-Richmond American Homes 88  $      288,102.00

Southeast

Builder Total Permits  Average Value
1-Thompson Thrift Construction 134  $      114,652.00
2-Lennar Homes 127  $      204,483.00
3-Gl Building Corporation 90  $      391,021.00
4-Pulte Homes 76  $      331,007.00
5-D.R. Horton 65  $      269,070.00

To gain more information on the builders, homeowners and permits for the construction activity above, check out HBW for your copy of the latest construction data reports. To gain access to the HBW database and receive custom and detailed reports on the latest residential and commercial building activity in Florida, Georgia, Texas, Alabama, and Oklahoma, please contact HBW for details.

Florida’s Top Three Counties for New Home Construction – November 2021

An HBW review of Florida counties and regions with the highest concentration of new residential construction activity during the month of November 2021

Based on HBW’s latest construction data reports for new residential construction in Florida, there were nearly 8,000 housing starts throughout the Sunshine State during the month of November.   Out of the five major regions reviewed (Tampa, Orlando, Jacksonville, Southeast, Southwest), Tampa ranked #1 for total new permits (2,061 permits), while Orlando carried the highest average value of new home construction (average value: $304,640). 

When taking a look at residential construction from a county-by-county perspective, activity was somewhat spread across the state with the most permits originating from the central and southwestern regions.  Upon closer review, it is evident that nearly 30 percent of all new home construction in Florida originated from three counties last month.

Here is a closer look at the three leading counties for new residential construction during the month of November 2021:

Lee County

As Florida’s eighth-most populous county (population estimates – 2019: 770,577), Lee County carried the highest concentration of new home construction out of all counties in Florida last month.  There were nearly 1,035 housing starts with a total construction value of approximately $230 million in Lee County during the month of November; that is more than half of all new residential construction in the southwestern region of Florida for the one-month period.

Pasco County

Pasco County ranked second-highest last month for new residential construction activity.  While Pasco is not the largest county in the Tampa area (population estimates – 2019: 561,891), the county has exhibited higher levels of new home construction.  Last month, there were 616 housing starts with a total construction value of approximately $195 million.

Polk County

Also in the Tampa area, Polk County ranked #3 for new residential construction last month.  By land, Polk County is equal in size to Delaware; the total area of the county is approximately 2,010 square miles, which makes it the fourth largest county in Florida (source: Orlando Sentinel). As for population, Polk is ranked ninth with 2019 population estimates reflecting a population of 724,777.  Last month, there were approximately 579 housing starts in Polk County with a total construction value in excess of $134 million.

Other counties in Florida that held higher concentrations of new home construction last month were St. Lucie (Southeast) with 553 new permits and Duval County (Jacksonville) with 449 new permits.


To gain more information on the builders, homeowners and permits for the construction activity above, check out HBW for your copy of the latest construction data reports. To gain access to the HBW database and receive custom and detailed reports on the latest residential and commercial building activity in Florida, Georgia, Texas, Alabama, and Oklahoma, please contact HBW for details.

Florida Swimming Pool Construction Report – November 2021

A review of permit data for swimming pool construction in Florida during the month of November 2021

Swimming pool construction in Florida has remained steady and consistent over the last couple of months; similar to October, last month there were nearly 2,700 new swimming pool construction permits with a total value of approximately $156 million added to the HBW database.  Out of the five regions reviewed (Southwest, Southeast, Tampa, Orlando, Jacksonville), the greatest concentration of new pool construction took place in the southwestern region of the state (953 permits), while the highest average value of new pool construction projects remained in the Jacksonville area (average value: $70,880).

Here is a closer look at permit data pulled from the HBW database for new swimming pool construction in Florida during the month of November:

Southwest

As noted above, the southwestern region of Florida carried the highest volume of new pool construction activity last month, having 953 new permits with a total value of approximately $52 million.  The average value of new pool construction landed on the lower end of the spectrum (average value: $54,502) in comparison to other Florida regions reviewed, and more than 60 percent of all new permits originated from the counties of Lee (355 permits) and Collier (224 permits).

Out of the more than 175 contractors with new pool construction activity on record in the southwestern region of Florida last month, the following ranked as the top five for total new permits:

Builder Total Permits
1-Aragon Pools & Spas 111
2-Pinnacle USA 89
3-Coast to Coast Pools 37
4-Fountain Pools & Water Features 32
5-Casa Pools 30

Southeast

The southeastern region of Florida ranked #2 for new pool construction, having just over 600 new permits with a total value of nearly $31 million.  The average value of construction was lowest in the southeast (average value: $51,323) in comparison to other regions reviewed, and the bulk of permits originated from the two counties of Palm Beach (281 permits) and Miami-Dade (163 permits).

Out of the nearly 220 contractors with new swimming pool construction on record for the southeastern region last month, the following ranked as the top five for total new permits:

Builder Total Permits
1-Fountain Blue Pool Service 24
2-Champion Pools & Spas 20
3-Van Kirk Construction 19
4-AAA Custom Pools 18
5-Swimming Pool Contractors 16

Tampa

In Tampa, there were nearly 535 new swimming pool construction permits with a total value in excess of $34 million added to the HBW database last month.  The average value of new pool construction landed on the higher end of the spectrum (average value: $64,465) in comparison to other regions reviewed, and more than half of all construction activity took place in the two counties of Hillsborough (169 permits) and Pasco (135 permits).

Out of the 140 contractors with new pool construction on record in the Tampa area last month, the following ranked as the top five for total new permits:

Builder Total Permits
1-Challenger Pools 50
2-Tropical Escapes Pool & Spa Construction 26
3-American Pools & Spas 24
4-Holland Pools 23
5-T&D Pool & Spa Construction 17

Orlando

Last month, there were approximately 380 new swimming pool construction permits with a total value of nearly $22 million on record for the Orlando area.  The average value of new pool construction was $57,410, and nearly 65 percent of all permits originated from the counties of Orange (149 permits) and Brevard (88 permits).

Out of the 100 contractors with new swimming pool construction on record in the Orlando area last month, the following ranked as the top five for total new permits:

Builder Total Permits
1-American Pools & Spas 28
2-Dreamscapes Pools & Spas 26
3-All Seasons 18
4-Holland Pools 17
5-Intercoastal Pool & Spa Builders 17

Jacksonville

In Jacksonville, there were more than 225 new pool permits with a total value of approximately $16 million on record for the month of November.  As previously noted, the average value of construction was highest in the Jacksonville area (average value: $70,880) in comparison to other regions reviewed, and the counties with the greatest amount of new pool construction included St. Johns (85 permits) and Duval (60 permits).

Out of the more than 70 pool builders with new construction activity on record last month, the following ranked as the top five for total new permits:

Builder Total Permits
1-Pools by John Clarkson 20
2-Blue Haven Pools 15
3-Pools & Spas of Central FL 11
4-Superior Design Pools 8
5-Backyard Designs 8


For more information on the builders, homeowners and permits for the construction activity above, check out HBW for your copy of the latest construction data reports. To gain access to the HBW database and receive custom and detailed reports on the latest residential and commercial building activity in Florida, Georgia, Texas, Alabama, and Oklahoma, please contact HBW for details.