Texas Swimming Pool Construction Review – January 2022

An overview of permit data for new swimming pool construction in Texas during the month of January 2022

Since the start of this year, new swimming pool construction has been off to a solid start in the Lone Star State.  Last month, there were more than 1,215 new permits with a total construction value in excess of $67 million on record with HBW, reflecting a 32 percent month-over-month increase in new pool construction.

Out of the four metro areas (Dallas, Houston, Austin, San Antonio) included in the reports, Dallas (510 permits) held the greatest amount of new pool construction activity, while the highest average value of new pool construction could be found in Houston (average value: $69,846).

Here is closer look at the total permits, average value of construction and leading counties and contractors for new pool construction in the four major metro areas of Texas during the month of January:

Dallas

As previously noted, the Dallas area carried the highest level of new pool construction in comparison to other Texas regions reviewed.  Last month, there were 510 new permits with a total construction value of nearly $26.4 million added to the HBW database for the area.  The average value of construction was $51,706, and more than 60 percent of all new permits originated from the two counties of Collin (168 permits) and Dallas (143 permits).

Out of the approximately 180 pool builders with new construction activity on record in the Dallas area last month, the following ranked as the top three for total new permits:

Builder Total Permits
1-Riverbend Pools 31
2-Gold Medal Pools 27
3-Foley Custom Pools 22

Houston

In Houston, there were approximately 390 new swimming pool construction permits with a total value of nearly $27.2 million added to the HBW database last month.  The average value of pool construction was highest in Houston (average value: $69,846) in comparison to other Texas regions reviewed, and more than half of all new construction activity took place in Harris County (209 permits).

Out of the approximately 175 pool builders with new construction activity on record in the Houston area last month, the following ranked as the top three for total new permits:

Builder Total Permits
1-Platinum Pools 26
2-McKinney Custom Pools 18
3-Premier Pools 17

Austin

Last month, there were nearly 200 new swimming pool construction permits with a total value of more than $9.4 million on record with HBW for the Austin area.  The average value of new pool construction was $47,854, and the bulk of new construction activity took place in Travis County (147 permits).

Out of nearly 90 pool builders with new construction activity on record in Austin last month, the following ranked as the top three for total new permits:

Builder Total Permits
1-Cody Pools 23
2-Denali Pools 11
3-Anthony & Sylvan Pools 7

San Antonio

In San Antonio, there were more than 120 new swimming pool construction permits with a total value of approximately $4.2 million on record last month.  The average value of construction was lowest in San Antonio (average value: $34,415) in comparison to other Texas areas reviewed, and more than half of all new permits originated from Bexar County where there were 73 permits on record for the one-month period.

Out of more than 40 pool builders with new swimming pool construction activity on record in San Antonio last month, the following ranked as the top three for total new permits:

Builder Total Permits
1-Keith Zars Pools 23
2-Cody Pools 12
3-Blue Haven Pools 9

To gain more information on the builders, homeowners and permits for the construction activity above, check out HBW for your copy of the latest construction data reports. To gain access to the HBW database and receive custom and detailed reports on the latest residential and commercial building activity in Florida, Georgia, Texas, Alabama, and Oklahoma, please contact HBW for details.

Florida Swimming Pool Construction Report – 2021

An overview of permit data for new swimming pool construction in Florida during 2021

Florida has experienced its best year yet when it comes to new swimming pool construction.  While swimming pools usually come to mind when thinking of Florida, the rate of new construction last year was a step above the usual.  Based on the latest HBW Swimming Pool Construction Activity Trend Reports for Florida, last year there was approximately a 30 percent year-over-year increase in new pool construction, resulting in more than 41,500 new permits on record with HBW.

Out of the six regions included in the report (Southeast, Southwest, Northeast, Northwest, Central and West), the highest concentration of new permits could be found in Southwest Florida (13,678 permits); in comparison to other Florida regions reviewed, the Southwest also reflected the greatest annual rate of growth with a 55 percent year-over-year increase in new permits.

Here is a breakdown of the total permits, year-over-year growth rates and leading counties for new swimming pool construction throughout the Sunshine State last year:

Southwest

Total Permits in 2021: 13,678

Annual Growth Rate (YOY): 55 percent

Leading Counties for new permits: Lee County (4,564 permits, +56% YOY); Collier County (2,666 permits, +76% YOY)

Southeast

Total Permits in 2021: 8,189

Annual Growth Rate (YOY): 46 percent

Leading Counties for new permits: Palm Beach County (3,077 permits, +34% YOY); Miami-Dade County (2,307 permits, +28% YOY)

West

Total Permits in 2021: 7,033

Annual Growth Rate (YOY): 14 percent

Leading Counties for new permits: Pasco County (1,893 permits, +29% YOY); Hillsborough County (1,562 permits, -14% YOY)

Central

Total Permits in 2021: 5,410

Annual Growth Rate (YOY): 16 percent

Leading Counties for new permits: Orange County (2,253 permits, +22% YOY); Brevard County (1,069 permits, +4% YOY)

Northeast

Total Permits in 2021: 3,894

Annual Growth Rate (YOY): 15 percent

Leading Counties for new permits: St. Johns County (1,497 permits, +16% YOY); Duval County (751 permits, -6% YOY)

Northwest

Total Permits in 2021: 3,305

Annual Growth Rate (YOY): 7 percent

Leading Counties for new permits: Santa Rosa County (643 permits, +6% YOY); Walton County (435 permits, +2% YOY)

To gain more information on the builders, homeowners and permits for the construction activity above, check out HBW for your copy of the latest construction data reports. To gain access to the HBW database and receive custom and detailed reports on the latest residential and commercial building activity in Florida, Georgia, Texas, Alabama, and Oklahoma, please contact HBW for details.
Florida Residential Construction Up 34% in 2021

A review of permit data for new residential construction in Florida during 2021

Since 2011, Florida has been experiencing a steady and healthy climb in new residential construction year after year.  In 2021, the upward momentum continued as the Sunshine State demonstrated an impressive 34 percent year-over-year increase in new home construction, resulting in approximately 129,000 new permits being added to the HBW database.

From the six major Florida regions reviewed (Southeast, Southwest, West, Central, Northeast, Northwest), year-over-year increases ranged from a low of 7 percent (Northwest) to a high of 62 percent (Southwest).  The regions that exhibited the greatest spikes in new home construction last year include Southwest (29,559 permits) and Northeast (24,274 permits) Florida with year-over-year increases of 62 percent and 38 percent respectively.

When reviewing HBW’s Building Activity Trend Reports to identify regions with the greatest amount of new residential construction last year, both the West and Southwest took the lead, having 29,336 and 29,559 permits on record respectively for the year; this accounts for more than 45 percent of all new home construction activity throughout the Sunshine State for the one-year period.

Here is a closer look at permit totals and leading counties for new home construction in Florida last year:

Total Permits by Region

Top Five Counties for Total Permits

To gain more information on the builders, homeowners and permits for the construction activity above, check out HBW for your copy of the latest construction data reports. To gain access to the HBW database and receive custom and detailed reports on the latest residential and commercial building activity in Florida, Georgia, Texas, Alabama, and Oklahoma, please contact HBW for details.

Texas Residential Construction Annual Review – 2021

A review of permit data for new home construction in Texas during 2021

Based on HBW’s latest Building Activity Trend Report for new residential construction in Texas last year, new home construction has been climbing across the Lone Star State.  In 2021, there were more than 95,275 new residential construction permits gathered from the combined metro areas of Dallas, Houston, San Antonio, and Austin, reflecting an 11 percent year-over-year increase in residential construction.  From the four regions reviewed, annual increases in new home construction ranged from a low of 2 percent (Austin) to a high of 19 percent (San Antonio).

Here is a closer look at total permits and leading counties for residential construction in each of four metro areas of Texas:

Houston – Last year, the Houston area carried the greatest total number of new permits in comparison to other metro areas reviewed, having 41,368 new permits added to the HBW database; this reflects a 12 percent year-over-year increase in new home construction.  Out of the five counties that make up the Houston area, Harris and Montgomery held approximately 75 percent of all construction activity, having 20,340 and 10,653 permits on record respectively. 

Dallas – The Dallas area ranked second for new home construction, having 31,848 new permits on record with HBW last year; this reflects a 13 percent year-over-year increase.  Out of the six counties that were included in the Dallas report, just about 63 percent of all new home construction took place in Collin (10,758) and Tarrant (9,175 permits).

Austin –In Austin, there were 13,025 new residential construction permits on record last year, reflecting a 2 percent year-over-year increase in new home construction. Out of the four counties included in the report, nearly all (~87%) permits originated from the two counties of Travis (5,948 permits) and Williamson (5,419 permits).

San Antonio – As previously noted, last year San Antonio demonstrated the greatest annual growth in new home construction out of the four Texas areas reviewed.  With a 19 percent year-over-year increase, there were 9,035 new residential construction permits added to the HBW database for the San Antonio area. Out of the three counties included in the report, more than half of all new home construction activity took place in Bexar County where there were 4,580 new permits on record for the one-year period. 


To gain more information on the builders, homeowners and permits for the construction activity above, check out HBW for your copy of the latest construction data reports. To gain access to the HBW database and receive custom and detailed reports on the latest residential and commercial building activity in Florida, Georgia, Texas, Alabama, and Oklahoma, please contact HBW for details.

Annual Review: Texas Swimming Pool Construction – 2021

A review of new swimming pool construction permit activity on record with HBW for Texas during 2021

Last year, Texas experienced its best year on record in more than five years for new swimming pool construction.  Based on permit data recorded in the HBW database, swimming pool construction in the Lone Star State has been on the rise over the last several years, and 2021 proved that the upward growth pattern has continued.  From the combined metro areas of Dallas, Houston, San Antonio and Austin, Texas experienced a 15 percent year-over-year increase in new swimming pool construction, resulting in 13,089 new permits on record.  Every major metro area exhibited annual increases in new pool construction activity ranging from 1 percent (Austin) to 20 percent (Houston).

Here is a closer look at permit data by region…

With a 15 percent year-over-year increase in permits, the Dallas area had more than 6,260 new swimming pool construction permits on record last year – ranking it #1 for new pool construction.  Next in line, Houston ranked #2 for new pool construction; with the highest year-over-year increase (+20%) of any Texas metro area, the Houston area had 4,471 new swimming pool construction permits on record with HBW for 2021.

While swimming pool construction managed to remain somewhat steady in the Austin area last year, there was still minimal growth at the rate of 1 percent (YoY), resulting in 1,374 new permits on record for the one-year period. Finally, San Antonio and its surrounding areas experienced an annual boost of 12 percent in new pool construction, resulting in more than 980 new permits on record with HBW.

When reviewing permit activity from a county-by-county perspective, Harris County (Houston) ranked #1 for total new permits on record last year; with a 22 percent year-over-year increase in pool starts, there were approximately 2,640 new swimming pool construction permits added to the HBW database for Harris County last year.  Other counties where swimming pool construction was on a high over the last year include Collin County (2,031 permits) and Tarrant County (1,639 permits) in the Dallas area. Counties that demonstrated the greatest annual growth in new pool construction include Fort Bend (+49%) in the Houston area, and Collin (+26%) and Denton (+30%) in the Dallas area.


To gain more information on the builders, homeowners and permits for the construction activity above, check out HBW for your copy of the latest construction data reports. To gain access to the HBW database and receive custom and detailed reports on the latest residential and commercial building activity in Florida, Georgia, Texas, Alabama, and Oklahoma, please contact HBW for details.
Florida Residential Construction Review – December 2021

A review of permit data for new home construction in Florida during the month of December 2021

Based on the latest HBW construction data reports, there were nearly 7,200 new residential construction permits with a total value in excess of $2 billion in Florida last month; this reflects a 10 percent month-over-month decrease in new home construction.

When it comes to home builders, both D.R. Horton and Lennar Homes have a stronghold on the market; with a combined total of nearly 1,800 new permits last month, the mega-builders were responsible for approximately 25 percent of all new home construction permits in Florida.

Out of the five regions reviewed (Southwest, Tampa, Orlando, Southeast, Jacksonville), the greatest amount of new permits originated from the southwestern region of the state (2,025 permits), while the highest average value of new construction projects could be found in the southeast (average value: $350,626).

Here is a closer look at the permit data for new home construction in Florida by region during the month of December:

Southwest

As previously noted, the southwestern region ranked #1 for new home construction, having 2,025 new permits with a total value of approximately $529 million.  The average value of new home construction landed on the lower end of the spectrum (average value: $261,083) in comparison to other regions reviewed, and more than half of all new permits originated from the two counties of Lee (654 permits) and Charlotte (397 permits).

Out of the 350 home builders with new permits on record in the area last month, the following ranked as the top three for total new permits:

Builder Total Permits
1-D.R. Horton 281
2-Pulte Homes 199
3-Lennar Homes 183

Tampa

Not far behind the southwest, Tampa had 1,929 new residential construction permits with a total value of nearly $550 million on record with HBW last month.  The average value of new home construction was $284,943, and the bulk of new permits originated from the two counties of Polk (660 permits) and Pasco (468 permits).

Out of the 225 home builders with new permits on record in the area last month, the following ranked as the top three for total new permits:

Builder Total Permits
1-Lennar Homes 238
2-D.R. Horton 231
3-The Villages of Lake Sumter 158

Jacksonville

In Jacksonville, there were nearly 1,365 new residential construction permits with a total value of approximately $330 million on record with HBW last month.  The average value of new home construction was lowest in Jacksonville (average value: $242,084) in comparison to other Florida regions reviewed, and the majority of permits originated from the counties of Duval (489 permits) and St. Johns (440 permits).

Out of the more than 145 home builders with new permits on record in the area last month, the following ranked as the top three for total new permits:

Builder Total Permits
1-D.R. Horton 364
2-Lennar Homes 144
3-Dream Finders Construction 87

Orlando

Last month, there were approximately 1,085 new residential construction permits with a total value of $348.5 million on record for the Orlando area.  The average value of new home construction landed on the higher end of the spectrum (average value: $321,805) in comparison to other Florida regions reviewed, and more than half of all new permits originated from the counties of Brevard (296 permits) and Orange (267 permits).

Out of the more than 140 home builders with new permits on record in the area last month, the following ranked as the top three for total new permits:

Builder Total Permits
1-D.R. Horton 151
2-Lennar Homes 124
3-Pulte Homes 111

Southeast

While the southeastern region of Florida held the lowest amount of new home construction last month (795 permits), the area held the highest average value of new residential construction projects (average value: $350,626), and just about 67 percent of all new construction took place in the two counties of St. Lucie (382 permits) and Palm Beach (148 permits).

Out of the nearly 155 home builders with new permits on record in the southeastern region last month, the following ranked as the top three for total new permits:

Builder Total Permits
1-GL Building Corporation 99
2-Lennar Homes 59
3-Pulte Homes 52


To gain more information on the builders, homeowners and permits for the construction activity above, check out HBW for your copy of the latest construction data reports. To gain access to the HBW database and receive custom and detailed reports on the latest residential and commercial building activity in Florida, Georgia, Texas, Alabama, and Oklahoma, please contact HBW for details.
Florida Swimming Pool Construction Report – December 2021

A review of permit data for new swimming pool construction in Florida during the month of December 2021

Last month, there were approximately 2,723 new swimming pool construction permits with a total value in excess of $160.5 million added to the HBW database for the Sunshine State.  Out of the five regions reviewed (Tampa, Southwest, Orlando, Southeast, Jacksonville), the greatest amount of new pool construction activity took place in the southwestern region of the state (998 permits), while the highest average value of new permits could be found in Jacksonville (average value: $74,360).

Here is a breakdown of the latest permit data for new swimming pool construction in each of the five Florida regions during the month of December 2021:

Southwest

Total Permits: 998

Average Value of Construction: $54,577

Top Counties: Lee County (302 permits); Manatee County (231 permits)

Top 3 Pool Builders (based on total permits):

Builder Total Permits
1-Aragon Pools & Spas 84
2-Coast to Coast Pools 66
3-Pinnacle USA 60

Southeast

Total Permits: 646

Average Value of Construction: $53,338

Top Counties: Palm Beach County (293 permits); Miami-Dade (131 permits)

Top 3 Pool Builders (based on total permits):

Builder Total Permits
1-Crystal Pools 26
2-Swimming Pool Contractors 25
3-A&G Concrete Pools 24

Tampa

Total Permits: 486

Average Value of Construction: $65,932

Top Counties: Hillsborough County (189 permits); Polk County (104 permits)

Top 3 Pool Builders (based on total permits):

Builder Total Permits
1-Challenger Pools 31
2-Tampa Bay Pools 19
3-T&D Pool & Spa Construction 19

Orlando

Total Permits: 329

Average Value of Construction: $60,767

Top Counties: Orange County (128 permits); Brevard County (72 permits)

Top 3 Pool Builders (based on total permits):

Builder Total Permits
1-American Pools & Spas 33
2-Dreamscapes Pools & Spas 21
3-Dixie Pools & Spas 15

Jacksonville

Total Permits: 264

Average Value of Construction: $74,360

Top Counties: St. Johns County (129 permits); Duval County (52 permits)

Top 3 Pool Builders (based on total permits):

Builder Total Permits
1-Pools by John Clarkson 17
2-Epic Pools & Hardscape Constr. 12
3-Blue Haven Pools 11


For more information on the builders, homeowners and permits for the construction activity above, check out HBW for your copy of the latest construction data reports. To gain access to the HBW database and receive custom and detailed reports on the latest residential and commercial building activity in Florida, Georgia, Texas, Alabama, and Oklahoma, please contact HBW for details.
Texas Swimming Pool Construction Review – December 2021

An overview of permit data for new swimming pool construction in Texas during the month of December 2021

Based on HBW’s latest construction data reports, there were 915 new swimming pool permits with a total value in excess of $51.4 million in Texas last month.  Out of the four major metro areas included in the reports (Houston, Dallas, Austin, San Antonio), the greatest amount of new pool construction activity took place in Dallas (448 permits), while the highest average value of new pool construction projects could be found in Houston (average value: $73,698).

Here is a closer look at swimming pool construction permit data on record for the Lone Star State during the month of December:

Dallas

As previously noted, Dallas held the highest level of new pool construction activity out of the four metro areas reviewed, having 448 new permits with a total construction value of nearly $22 million last month.  The average value of new pool construction was $49,009, and the majority of all new permits originated from the two counties of Collin (149 permits) and Tarrant (114 permits).

Out of the nearly 175 pool builders with new construction activity on record in Dallas last month, the following ranked as the top three for total new permits during the one-month period:

Builder
1-Riverbend Pools
2-BMR Pools
3-Puryear Custom Pools

Houston

In Houston, there were more than 270 new swimming pool construction permits with a total value of nearly $20 million on record last month.  The average value of new construction was highest in Houston (average value: $73,698) in comparison to other Texas areas reviewed, and more than half of all new permits originated from Harris County (165 permits).

Out of the more than 130 pool builders with new permits on record in the Houston area last month, the following ranked as the top three for total new permits:

Builder
1-Platinum Pools
2-Anthony & Sylvan Pools
3-The Pool Man

Austin

Last month, there were approximately 135 new swimming pool permits with a total construction value of $7.5 million in the Austin area.  The average value of new pool construction was $55,641, and nearly all construction activity took place in Travis County where there were 111 new permits on record for the one-month period.

Out of the nearly 75 companies with new swimming pool construction on record in Austin last month, the following ranked as the top three for total new permits:

Builder
1-Cody Pools
2-Anthony & Sylvan Pools
3-Majestic Poolscape

San Antonio

Last month, San Antonio held the lowest level of new pool construction activity in comparison to other Texas areas reviewed, as well as the lowest average value of construction.  During December, there were 62 new swimming pool permits with a total value in excess of $2 million added to the HBW database for San Antonio.  The average value of construction was $32,853, and the majority of new permits originated from Bexar County (45 permits).

Out of more than 25 companies with new swimming pool permits on record in the area last month, the following ranked as the top three for total new permits:

Builder
1-Keith Zars Pools
2-Cody Pools
3-Blue Haven Pools

To gain more information on the builders, homeowners and permits for the construction activity above, check out HBW for your copy of the latest construction data reports. To gain access to the HBW database and receive custom and detailed reports on the latest residential and commercial building activity in Florida, Georgia, Texas, Alabama, and Oklahoma, please contact HBW for details.
HBW Report: Texas Residential Construction – December 2021

An overview of permit data for new home construction in Texas during the month of December 2021

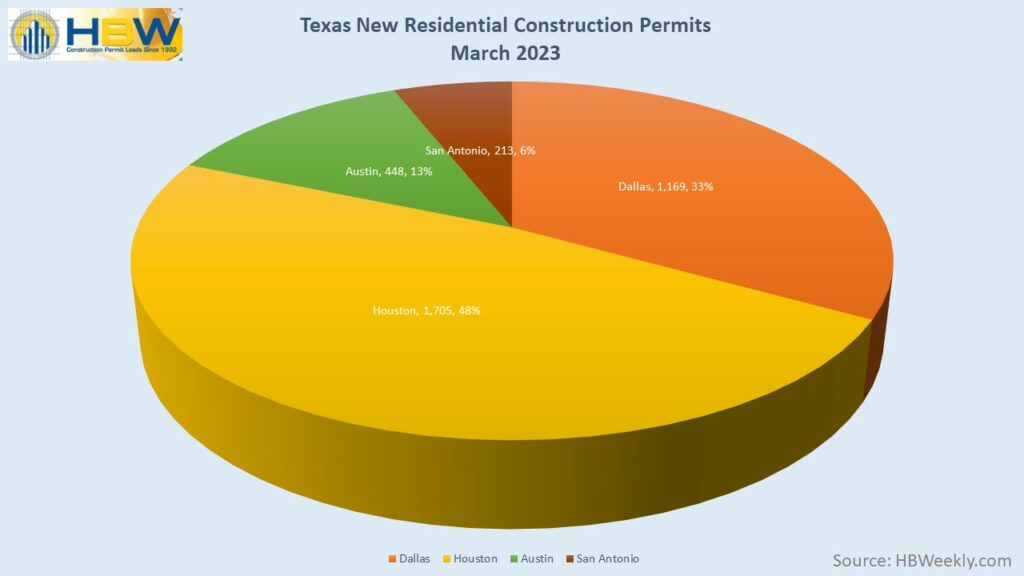
Last month, there were more than 6,550 new residential construction permits with a total value in excess of $1.7 billion added to the HBW database for the Lone Star State.  Out of the four major metro areas included in the report (Dallas, Houston, Austin, San Antonio), the greatest concentration of new residential construction activity could be found in Houston (3,107 permits), while the highest average value of new home construction took place in Dallas (average value: $304,191).

In order to better understand new home construction activity by region, as well as where the greatest amount of new permitting activity is taking across the state, we used HBW construction data reports to identify the regions and counties with the greatest amount of new home construction last month, as well as the leading home builders driving those figures.

Here is an overview of new residential construction permit data in Texas for the month of December:

Total Permits

As previously mentioned, there were more than 6,550 new residential construction permits on record with HBW for Texas the month of December.  This figure represents the total number of permits on record with HBW from the four metro regions of Dallas, Houston, Austin, and San Antonio. As displayed in the chart below, more than 80 percent of all new home construction activity took place in Houston and Dallas:

Average Value

Last month, the average value of new home construction across Texas ranged from a low of $232,592 (Houston) to a high of $304,191 (Dallas):

Leading Counties

When reviewing reports from a county-by-county perspective, there were several counties that held significantly higher amounts of new home construction than others; the top five counties for new home construction (based on total permits) in Texas last month are as follows:

Top Home Builders

From the combined reports for each metro region, there were three home builders that were standouts as they were responsible for approximately 25 percent of all new home construction in Texas last month; those home builders are as follows:

  1. D.R. Horton (788 permits)
  2. Lennar Homes (575 permits)
  3. Pulte Homes (242 permits)


To gain more information on the builders, homeowners and permits for the construction activity above, check out HBW for your copy of the latest construction data reports. To gain access to the HBW database and receive custom and detailed reports on the latest residential and commercial building activity in Florida, Georgia, Texas, Alabama, and Oklahoma, please contact HBW for details.
Atlanta Residential Construction Annual Review – 2021

A report on permit data for new residential construction in the Atlanta area from January through December 2021

The stats are in, and HBW Building Activity Trend Reports have been finalized for new home construction in the Atlanta area.  According to the most recent report, there were 28,300 new residential construction permits added to the HBW database for the Metro Atlanta area last year, reflecting an impressive 33 percent year-over-year increase in new home construction. 

Since 2018, new residential construction in the Metro Atlanta area has been steadily and slowly declining, with the total number of permits on record slightly decreasing year after year. Upon review of the latest figures from 2021, it looks like the area is rebounding, resulting in Atlanta’s first year-over-year increase in new home construction since 2018.

When reviewing the reports from a county-by-county perspective, there are a few counties where new residential construction appeared to increase significantly last year… For example, in Fulton County there were nearly 2,600 housing starts last year, reflecting a 53 percent year-over-year increase in new home construction.  Additionally, Fayette County climbed out of its three-year decline, having a hefty 67 percent year-over-year increase in housing starts last year which resulted in approximately 715 new residential construction permits on record.  Another county that previously demonstrated a declining market (since 2019) and came out strong last year is Dawson County; in Dawson there was a 72 percent year-over-year increase in new home construction, resulting in more than 470 new permits on record with HBW.

When reviewing permit data to identify counties carrying the highest concentration of new home construction, the three counties that topped the list include Gwinnett, Fulton and Forsyth; all three counties demonstrated year-over-year increases ranging from 16 percent to 53 percent and have a combined total of approximately 9,480 permits, which reflects about 34 percent of all new home construction in the Atlanta area last year.

Gwinnett County led the Metro Atlanta area by having the highest total number of new permits on record with HBW for the one-year period. Last year, there were more than 4,500 new residential construction permits added to the HBW database for the area, reflecting a 21 percent year-over-year increase in new home construction.

While Fulton County (2,598 permits), ranked second-highest for total new permits on record in 2021, it was #1 for higher value residential construction (value greater than $500k) as approximately 18 percent of all new permits held values greater than $500k.

Finally, Forsyth County appears to be gaining upward momentum from the declining market that was evident from 2017-2019.  In 2020, the market started looking up as there had been a 10 percent year-over-year increase in new home construction, and in 2021 the upward pattern continued with a 16 percent year-over-year increase, resulting in 2,376 new residential construction permits during the one-year period.

Information utilized for the above listed figures for Metro Atlanta residential construction was directly derived from HBW construction data reports. To gain access to the HBW database and receive custom and detailed reports on the latest residential and commercial building activity in Florida, Georgia, Texas, Alabama, and Oklahoma, please contact HBW for details.