Quarterly Report: In comparison to 2016, new residential construction in Florida is on the rise and already showing a year-over-year increase of 12% through the third quarter of 2017.

An average of approximately 1,000 people move to Florida every day – 1,000! This type of growth requires the construction industry to keep up with this ever-growing demand. Over the last five years, there have been annual increases anywhere from 14% to 31% in new residential construction in the Sunshine State. Every year, there are more and more housing starts on file with HBW, and in 2017, there are already more than 55,000 housing starts on file through the third quarter.
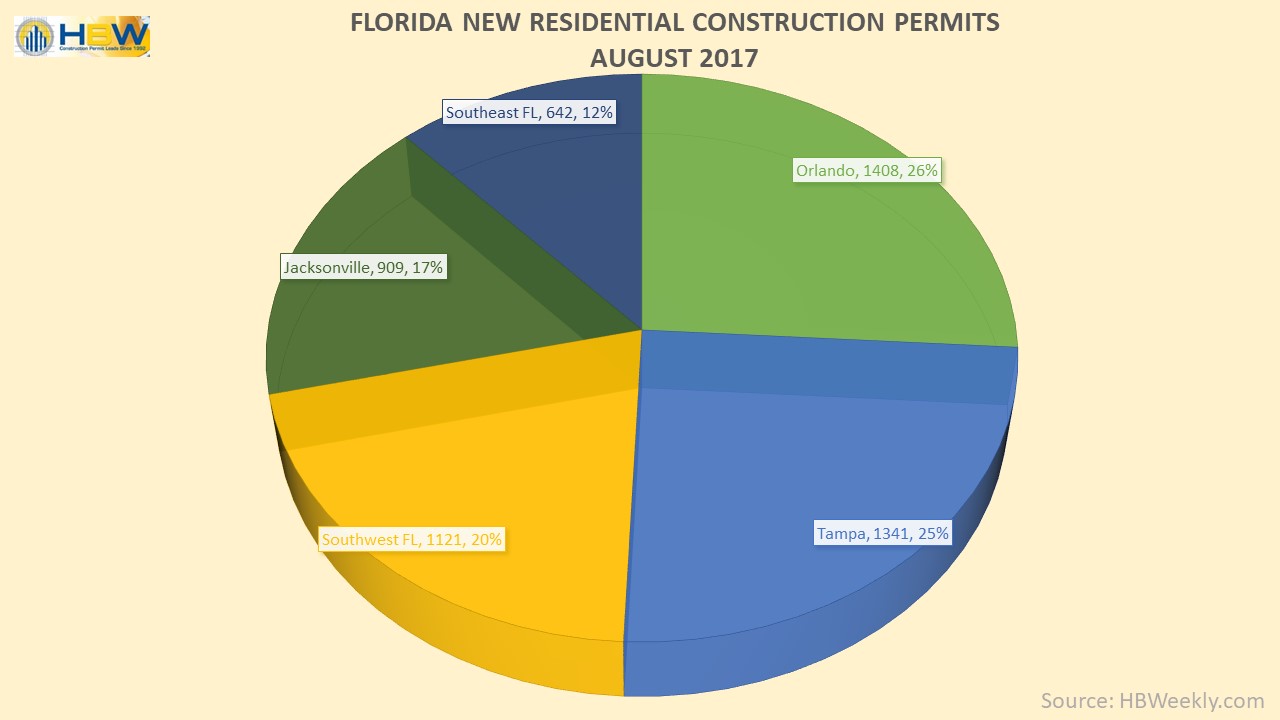
According to recent reports from The U.S. Census Bureau (source: Associated Press), the Tampa area had the nation’s fourth-highest gain from new residents moving there last year; just about 58,000 new residents moved there in the span of one year. South Florida also ranked high on the charts, having the nation’s seventh highest gain from migration, adding about 48,000 new residents last year. In the Central portion of the state, Orlando ranked eighth-highest having added nearly 47,000 new residents last year.
This year, patterns in new residential construction are equally as impressive. Out of the more than 55,000 housing starts through Q3 across Florida, the southeast region is experiencing the greatest year-over-year increase (+27%), and West Florida holds the greatest total number of housing starts (12,185 permits). Central Florida is also experiencing gains in new homes as there have been nearly 11,400 housing starts through Q3, reflecting a 9% increase over the same time last year.
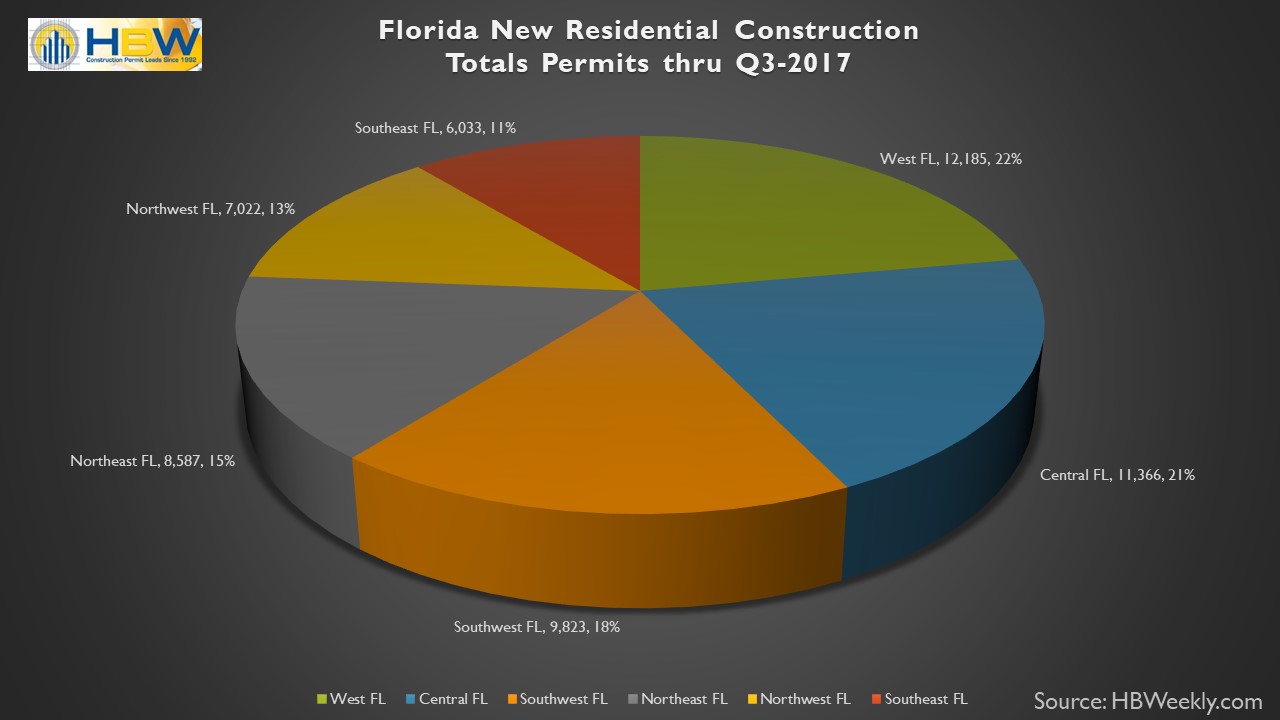
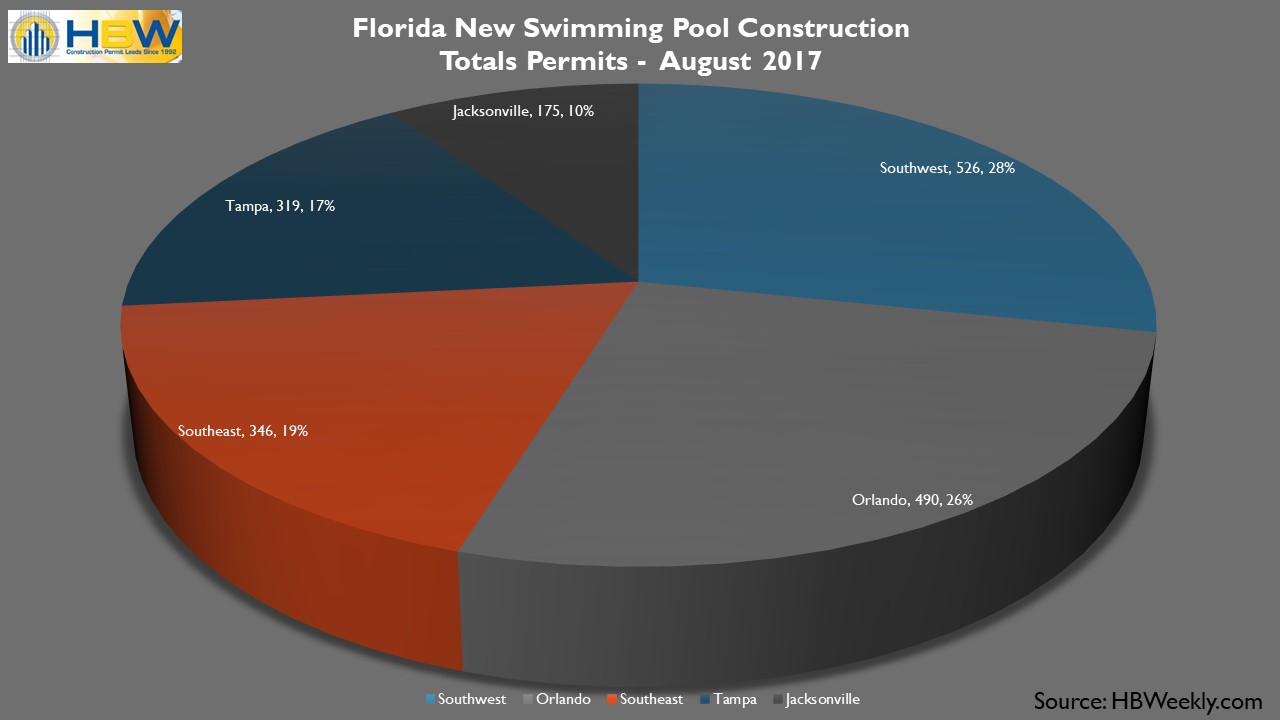
FL Resid. Permit Totals Q3-2017
While every major region is experiencing increases ranging from 4% to 27% in new residential construction this year, when looking at specific counties there are even more impressive gains identified. For example, Miami-Dade (SE) is ahead of last year’s figures by a whopping 90%, having 1,777 housing starts through Q3, and Sumter County (West) has already reflected a 60% year-over-year increase with more than 1,080 housing starts.
While Orange County (Central Florida) hasn’t experienced gains in new construction since 2016, it is the leader for total housing starts by far with 4,577 new permits on file through Q3. Hillsborough County (West) where Tampa is situated currently ranks second highest in the state for total housing starts as there are more than 3,750 new permits (+9%) on file for the given period. Coming in third, Polk County (West) has experienced a 20% year-over-year increase in new home construction, resulting in approximately 3,150 new permits added to the HBW database.
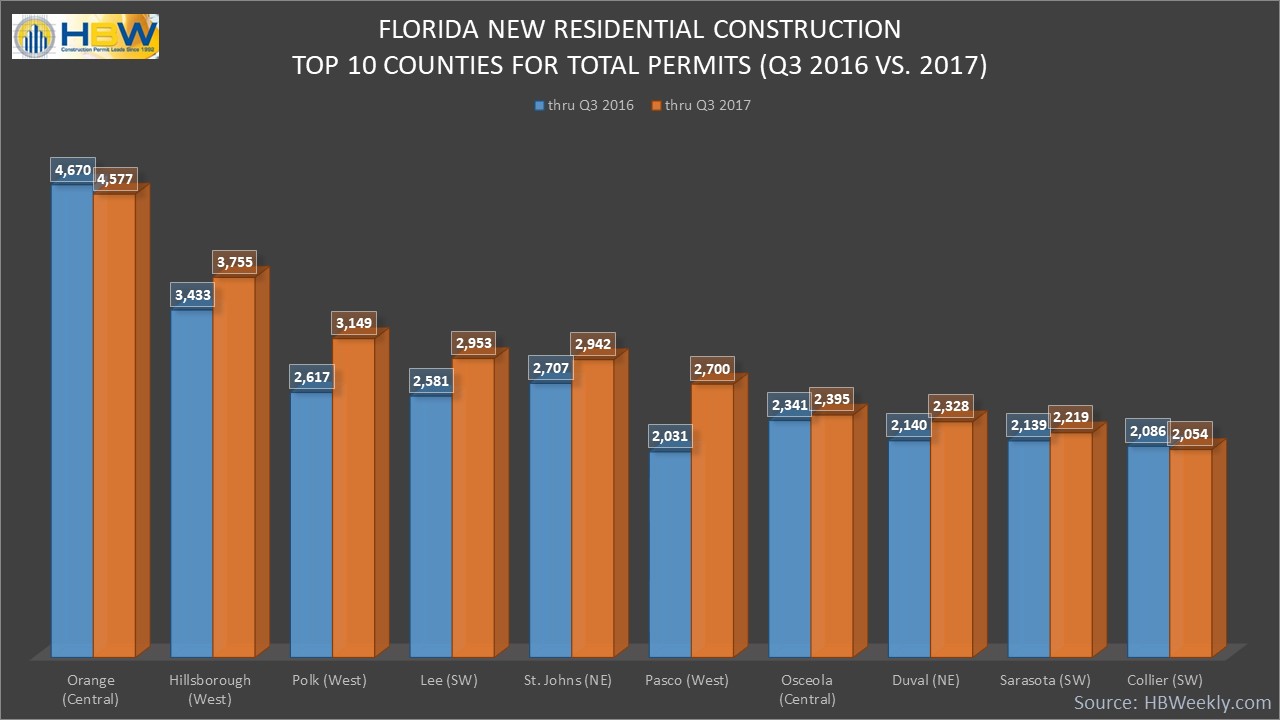
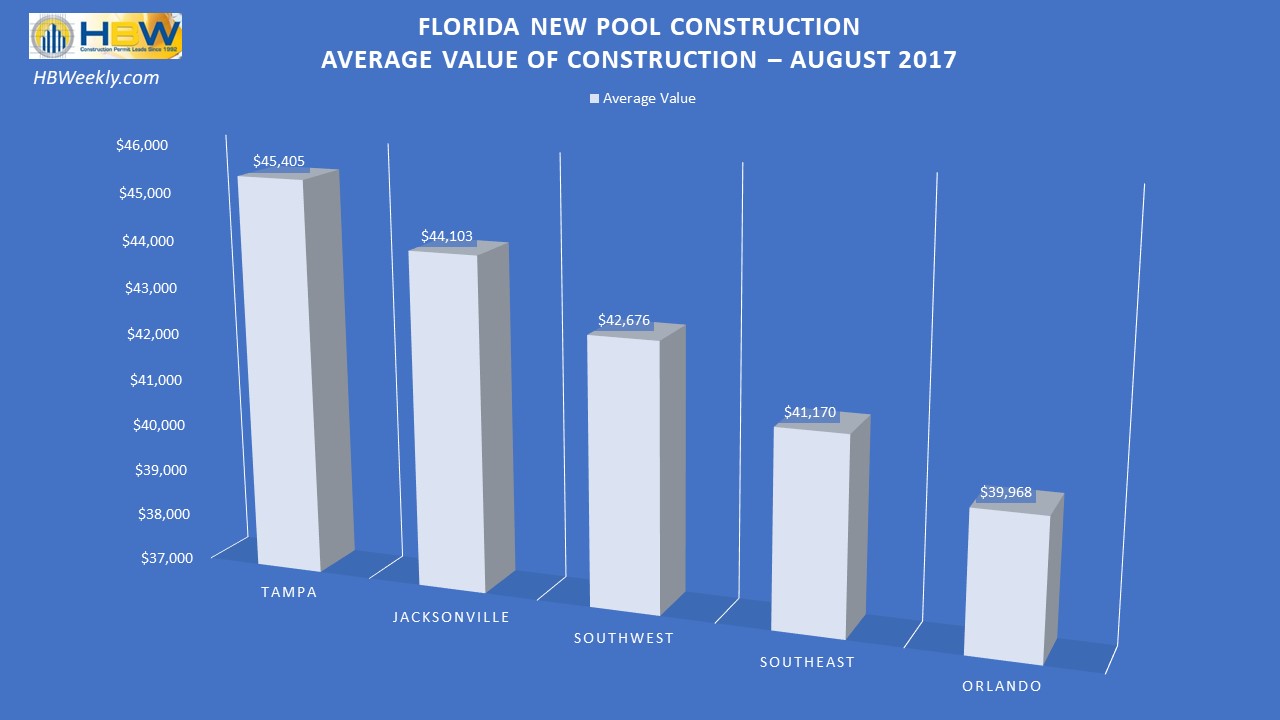
FL Top 10 Counties for Total New Residential Permits thru Q3-2017
Information utilized for the graphs and above listed figures for Florida residential construction was directly derived from HBW construction data reports. To gain access to the HBW database and receive custom and detailed reports on the latest residential and commercial building activity in Florida, Georgia, Texas, Alabama, and Oklahoma, please contact HBW for details.