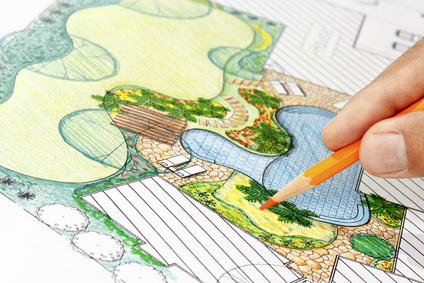
Recently, the American Society of Landscape Architects (ASLA) conducted the 2018 edition of the Residential Landscape Architecture Trends Survey, and the results were interesting, but not surprising. Landscape architects (808 participants) were surveyed from February 22, 2018 through March 8, 2018 and asked to rate the popularity of and demand for certain residential outdoor designs. A new addition to the survey included consideration of new types of outdoor features that are attractive to single-family and multifamily homeowners including the idea of flex space which has been growing in popularity.
Considering consumers’ ever-increasing dependency on technology and desire for more sustainable designs and lifestyles, it would make sense that low maintenance landscapes with yoga spaces and charging stations would top the list.
Based on the survey’s results, the following are the top ten landscape project types that are expected to be in greatest demand this year:
#1 – Native Plants (83.3%)
#2 – Native/adapted drought tolerant plants (83%)
#3 – Low-maintenance landscapes (80%)
#4 – Flexible use space (movie night areas, yoga space, etc. – 74.2%)
#5 – Permeable paving (74%)
#6 – Drip/water—efficient irrigation (72.4%)
#7 – Rain gardens (71.2%)
#8 – Reduced lawn area (70.8%)
#9 – Edible gardens (food, vegetables, orchards, vineyards – 70.5%)
#10 – Charging stations for tech and mobile devices (70%)
According to the report, the areas in demand have been consistent over the last year, with the exception of the new additions of flexible-use space and charging stations. The top five outdoor features and popular design elements include:
- Firepits and outdoor fireplaces (66%)
- Outdoor lighting (65.4%)
- Seating/dining areas (64%)
- Outdoor furniture (59.1%)
- Outdoor kitchens (58.8%)
When looking at recreation and related amenities, dog-related recreation areas topped the list at 68%. Not far behind, designated areas for other outdoor recreation ran a close second at 61.5%, and bocce courts ranked third at 42.5%.
As previously mentioned, ASLA made some revisions and additions to the survey which included questions addressing multi-family outdoor amenities. The top three trends for multi-family outdoor amenities included flexible use space for yoga, movie nights, etc. (74.2%), charging stations (70%) and bike storage (69.9%).
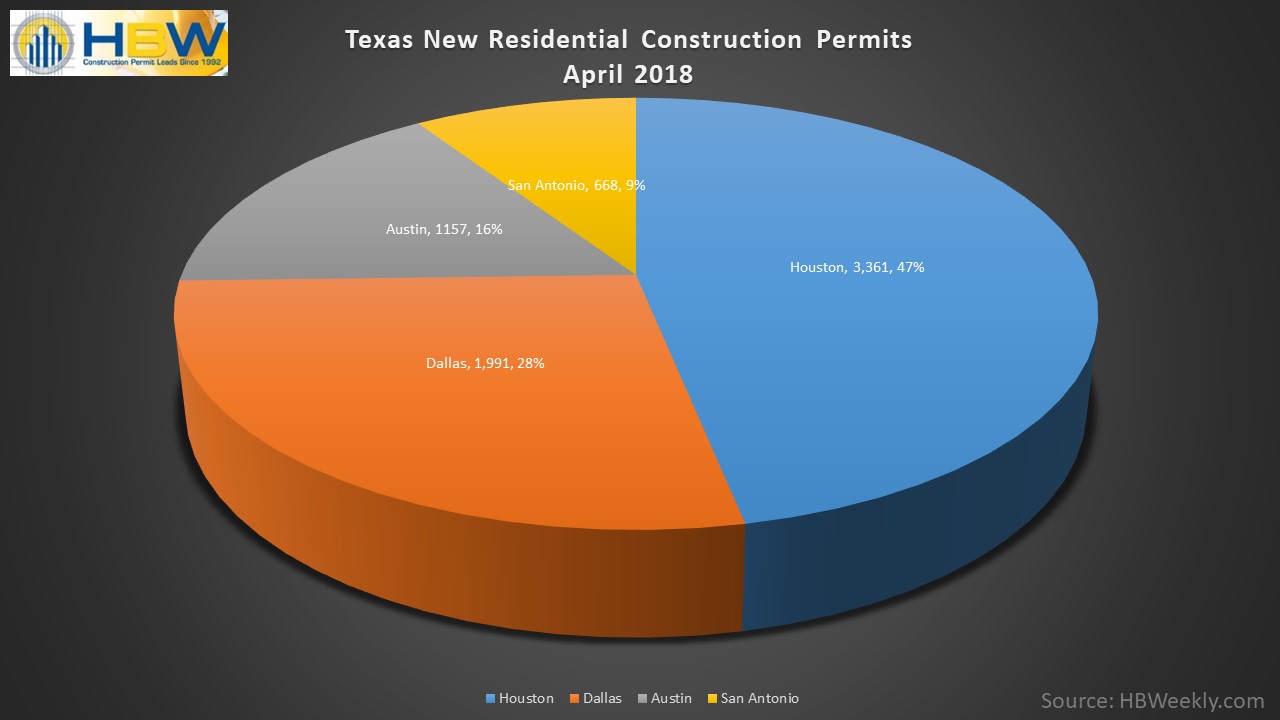
For more details and results on the survey, read more here. For more information on construction business and marketing tips, stay connected with the HBW Blog. To get ahead of construction activity and gain access to the latest permitting data in Florida, Texas, Georgia, Alabama and Oklahoma, contact HBW for more information on construction data reports and industry leads.