Texas Top Swimming Pool Builders – February 2022

A review of the leading pool builders in Texas based on total new permits on record with HBW during the month of February

Last week, we reviewed HBW’s latest construction data reports for new swimming pool construction in Texas, at which time we reported that there were more than 960 new swimming pool construction permits with a total value of approximately $54.4 million added to the HBW database during the month of February. Today, we are utilizing the same reports to identify the leading contractors driving new pool construction in each of the four metro areas of Texas (Dallas, Houston, Austin, San Antonio).

While leading contractors vary widely by area and most have a regional focus, there were a couple of companies that placed on the leaderboard in more than one metro area.  For example, Cody Pools ranked in the top three in both Austin and San Antonio, and Blue Haven Pools took top placement (top five) in San Antonio and Houston.

Based on the latest construction data reports from HBW, here is a look at the leading pool builders (by metro area) and the total permits on file for each of them during the month of February 2022:

Dallas

As reported in our previous post, Dallas held the highest concentration of new swimming pool permits last month in comparison to other Texas metro areas reviewed.  Out of the more than 180 active contractors with new construction activity on record for Dallas last month, the following ranked as the top three for total pool permits:

Builder Total Permits
1-Riverbend Pools 21
2-Gold Medal Pools 18
3-Puryear Custom Pools 18

Houston

In the Houston area, there were 110 active pool builders with new swimming pool construction activity on record with HBW last month, and the following ranked as the top three for total new permits for the one-month period:

Builder Total Permits
1-Platinum Pools 26
2-Cypress Custom Pools 16
3-Roxanne Plasencia 7

Austin

Last month, there were more than 80 pool contractors with new construction activity on record with HBW in the Austin area, and the following ranked as the top three for total new permits:

Builder Total Permits
1-Denali Pools 12
2-Cody Pools 11
3-Austin Pools 6

San Antonio

In San Antonio, there were 40 active contractors with new pool construction activity on record with HBW during the month of February, and the following ranked as the top three for total new permits for the one-month period:

Builder Total Permits
1-Keith Zars Pools 12
2-Cody Pools 6
3-Blue Haven Pools 5

To gain more information on the builders, homeowners and permits for the construction activity above, check out HBW for your copy of the latest construction data reports. To gain access to the HBW database and receive custom and detailed reports on the latest residential and commercial building activity in Florida, Georgia, Texas, Alabama, and Oklahoma, please contact HBW for details.

HBW Report: Texas Swimming Pool Construction – February 2022

A review of permit data for new swimming pool construction in Texas during the month of February 2022

Last month, there were more than 960 new swimming pool construction permits with a total value of approximately $54.4 million added to the HBW database for Texas. Out of the four major metro areas reviewed (Dallas, Austin, Houston, San Antonio), Dallas (466 permits) carried nearly half of all new construction activity for the one-month period, while Houston held the highest average value of new pool construction (average value: $73,359).

Here is a closer look at the total permits, leading counties, and average value of new swimming pool construction in each of the four major metro areas of Texas during the month of February:

Dallas

As noted above, Dallas ranked #1 for new swimming pool construction last month, having 466 new permits with a total construction value of more than $24 million added to the HBW database.  The average value of construction landed mid-range (average value: $52,098) in comparison to other Texas areas reviewed, and the counties with the highest concentration of new pool construction activity included Collin (120 permits) and Dallas (119 permits).

Houston

In Houston, there were more than 250 new swimming pool construction permits with a total value in excess of $18.4 million on record with HBW for the month of February.  As previously mentioned, the average value of construction was highest in Houston (average value: $73,359) in comparison to other metro areas reviewed, and more than 60 percent of all new construction took place in Harris County (158 permits).

Austin

In Austin, there were approximately 160 new pool permits with a total construction value of nearly $8.7 million last month. The average value of new pool construction projects was $54,833, and the majority of all new permits originated from Travis County where there were 120 new permits on record for the one-month period.

San Antonio

Last month, San Antonio had the lowest amount of new pool construction activity on record in comparison to other regions reviewed, having 86 new permits with a total construction value of approximately $3.1 million.  Additionally, the area carried the lowest average value of construction (average value: $35,573), and nearly all new pool permits originated from Bexar County (61 permits).

To gain more information on the builders, homeowners and permits for the construction activity above, check out HBW for your copy of the latest construction data reports. To gain access to the HBW database and receive custom and detailed reports on the latest residential and commercial building activity in Florida, Georgia, Texas, Alabama, and Oklahoma, please contact HBW for details.

Tips for Navigating Supply Chain Disruptions

No matter what role you play in the construction industry, you are certainly facing the woes of disruptions in the supply chain. Spurred by the pandemic, this ongoing challenge has many contractors frustrated and wondering “When will it end?”

From manufacturers and distributors to contractors and installers, everyone is riding this uncertain up and down (mostly down) ride in the supply chain. The lack of building products is a global issue, and the construction industry isn’t the only industry being impacted. In addition to delays and uncertain timelines for projects, the disruption is causing major pains to the wallet with increased costs for construction materials. In fact, according to the National Association of Home Builders, the recent rise in lumber prices amounted to more than an $18,500 increase on the average new single-family home, and $7,300 has been added to the market value of the typical new multi-family home.

To add fuel to the fire, a report from the U.S Chamber of Commerce claimed that 92% of contractors report difficulty finding workers, and of those, 42% have turned down work and projects due to a lack of skilled workers. For many contractors, lead time on materials is pushing jobs back up to eight to 12 months or more, and it can be a cause of both confusion and frustration for clients. For this reason, it is critical that contractors clearly communicate with clients about delays and effectively manage expectations, as well as adjust their operations and adapt to remain profitable. Here are a few things to keep in mind as you navigate the challenges posed by the supply shortage:

Plan Ahead – For existing clients, it is vital to inform them of the importance of planning ahead. With the rise in demand and cost of materials, delays in receiving materials are only getting lengthier; the longer they wait to make a decision, the greater the delay may be to begin and complete the job. By planning projects earlier than expected, they may be able to decrease the wait time.

Be Flexible – While supply chain issues are impacting the industry across the board, there are some aspects of business that may be more impacted than others. Although we are facing an inevitable domino effect, there may be some parts of your projects and operations that you can alter to make use of what is actually available. By being more flexible in your specifications and exploring options with multiple manufacturers, you can find new opportunities, as well as strengthen communications and relationships with trade partners.

Forecast Cash Flow – When conducting cash flow projections, it is wise to factor in multiple scenarios; under uncertain conditions like the industry faces today, it would be beneficial to run three or more scenarios to be prepared to pivot if needed. When forecasting cash flow, it is vital to base reports on real data, not guesses based on opinion or personal experience. To make informed decisions, start with information pulled from budgeting and risk management activities, as well as information provided by suppliers to determine optimal times to buy materials based on pricing.

Make it Temporary – Some clients may have a need for immediate repairs that can’t wait for all materials to be available. For this reason, it is important to offer a variety of temporary solutions until the project can commence. For example, if a client is in desperate need of a re-roof due to immediate damage, offer repairs and remedies that you can do now to keep their roof watertight for rainy season and protected until the full scope of services can be met.

Although contractors cannot control the supply chain, they can control how they manage client expectations, collaborate with suppliers, and manage operational expenses. While the last couple of years have forced contractors to evolve and make major changes to how they operate, those changes are part of a larger evolution in the industry that will strengthen businesses to better handle “the unexpected” in the future.


For more information on construction business tips, stay connected with the HBW Blog.  To get ahead of construction activity and gain access to the latest permitting data in Florida, Texas, Georgia, Alabama and Oklahoma, contact HBW for more information on construction data reports and industry leads.

Florida Top Home Builders – January 2022

A review of the leading home builders in Florida during the month of January 2022

Earlier this week, we reviewed residential construction permit data on record with HBW for Florida during the month January; in the report, we noted that there were 11,575 new residential construction permits with a total value of nearly $3.3 billion added to the HBW database for Florida. Today, we are using the same construction data reports to identify the leading home builders who are driving residential construction across the Sunshine State.

Out of the hundreds of contractors with new permit activity on record with HBW, the following ranked as the top three for total new residential construction permits statewide for the one-month period:

#1 – D.R. Horton – 1,893 permits

#2 – Lennar Homes – 1,267 permits

#3 – Pulte Homes – 855 permits

When looking at specific Florida regions, home builders driving the new residential construction figures varied by location. Out of the five regions reviewed (Southeast, Southwest, Tampa, Orlando, Jacksonville), D.R. Horton ranked #1 in four out five areas, while GL Building Corp took top placement in the remaining region (southeast) reviewed.

Here is closer look at the contractors with the greatest amount of new residential construction activity in Florida, by region, for the month of January 2022:

Southwest

In Southwest Florida, there were 485 active contractors with new home construction activity on record for the month, and the following ranked as the top five for total new permits:

Builder Total Permits  Average Value
1-D.R. Horton 445 $205,583.00
2-Lennar Homes 331 $135,206.00
3-Pulte Homes 316 $184,943.00
4-Neal Communities of SW FL 224 $228,221.00
5-Taylor Morrison 155 $207,126.00

Tampa

Out of the more than 300 home builders with new residential construction activity on record in Tampa last month, the following ranked as the top five for total permits on file with HBW:

Builder Total Permits  Average Value
1-D.R. Horton 414 $244,430.00
2-Lennar Homes 390 $307,467.00
3-The Villages of Lake Sumter 382 $261,673.00
4-Pulte Homes 194 $295,479.00
5-M/I Homes 118 $442,475.00

Orlando

In Orlando, there were nearly 230 home builders with new construction activity on record with HBW last month, and the following ranked as the top five for total new residential construction permits:

Builder Total Permits  Average Value
1-D.R. Horton 408 $282,552.00
2-Lennar Homes 257 $226,672.00
3-Pulte Homes 159 $307,749.00
4-Taylor Morrison 100 $257,408.00
5-Viera Builders 82 $540,855.00

Southeast

Out of the 180 home builders with new construction activity on record in the southeastern region of Florida last month, the following ranked as the top five for total new permits:

Builder Total Permits  Average Value
1-GL Building Corp 122 $351,647.00
2-D.R. Horton 117 $163,117.00
3-Lennar Homes 116 $299,290.00
4-Pulte Homes 87 $379,585.00
5-Kolter Signature Homes 84 $255,258.00

Jacksonville

Last month, there were more than 170 contractors with new residential construction activity on record in the Jacksonville area, and the following ranked as the top five for total new permits for the one-month period: 

Builder Total Permits  Average Value
1-D.R. Horton 509 $202,706.00
2-Dream Finders Construction 211 $261,281.00
3-Lennar Homes 173 $228,695.00
4-American Classic Homes 129 $85,000.00
5-Pulte Homes 99 $206,964.00

To gain more information on the builders, homeowners and permits for the construction activity above, check out HBW for your copy of the latest construction data reports. To gain access to the HBW database and receive custom and detailed reports on the latest residential and commercial building activity in Florida, Georgia, Texas, Alabama, and Oklahoma, please contact HBW for details.
HBW Report: Florida Residential Construction – January 2022

An overview of permit data for new home construction in Florida during the month of January 2022

Since the start of this year, new home construction has been off to a strong start in Florida – Last month, there were 11,575 new residential construction permits with a total value of nearly $3.3 billion added to the HBW database for Florida; this reflects more than a 60 percent month-over-month increase in new home construction. 

Out of the five major regions reviewed (Southwest, Southeast, Tampa, Orlando, Jacksonville), the southwestern region (3,208 permits) carried the highest concentration of new home construction activity for the month, while the southeastern region held the highest average value of new home construction (average value: $341,709)

Here is a closer look at total permits, construction values, and leading counties for new home construction in the Sunshine State during the month of January:

Southwest

The southwestern region of Florida ranked #1 for new home construction last month, having 3,208 new permits with a total value of approximately $867.2 million on record with HBW.  The average value of new home construction in the area (average value: $270,317) landed mid-range in comparison to other regions reviewed, and more than half of all new permits originated from the counties of Lee (1,076 permits) and Manatee (732 permits).

Tampa

Not far behind the Southwest, the Tampa area ranked #2 for new home construction last month, having 3,124 new permits with a total value of nearly $900 million on record.  The average value of new residential construction in the area was $287,993, and the counties with the highest concentration of new permits on record for the month were Pasco (939 permits) and Polk (852 permits).

Jacksonville

Last month, there were 2,095 new residential construction permits with a total value in excess of $495 million on record for Jacksonville. The average value of construction remained lowest in the Jacksonville area (average value: $236,310) in comparison to other Florida regions reviewed, and the bulk of all new residential construction activity originated from the two counties of Duval (772 permits) and St. Johns (644 permits).

Orlando

In Orlando, there were approximately 2,065 new residential construction permits with a total value of nearly $631 million last month. The average value of new home construction landed on the higher end of the spectrum (average value: $305,571) in comparison to other Florida regions reviewed, and the counties with the highest concentration of new permits included Brevard (532 permits) and Orange (453 permits).

Southeast

Last month, there were 1,084 new residential construction permits with a total value of nearly $370.5 million on record for the southeastern region of Florida. The average value of new home construction was highest in the southeast (average value: $341,709) in comparison to other Florida regions reviewed, and the counties with the greatest concentration of new home construction activity were St. Lucie (555 permits) and Palm Beach (256 permits).

To gain more information on the builders, homeowners and permits for the construction activity above, check out HBW for your copy of the latest construction data reports. To gain access to the HBW database and receive custom and detailed reports on the latest residential and commercial building activity in Florida, Georgia, Texas, Alabama, and Oklahoma, please contact HBW for details.
Florida Swimming Pool Construction Review – January 2022

An overview of new permits on record with HBW for swimming pool construction in Florida during the month of January 2022

Based on the HBW’s latest construction data reports, there were approximately 2,725 new swimming pool construction permits with a total value in excess of $160.5 million added to the HBW database for Florida last month.  Out of the five regions reviewed (Orlando, Southwest, Southeast, Tampa, Jacksonville), the greatest amount of new pool construction could be found in the Southwest (998 permits), while the highest average value of new construction projects could be found in Jacksonville (average value: $74,360).

From total permits and construction values to leading counties and contractors, here’s a breakdown of new swimming pool construction permit data throughout the Sunshine State last month:

Southwest

As previously noted, the southwestern region of Florida held the highest concentration of new pool construction last month, having nearly 1,000 new permits with a total construction value of approximately $54.5 million on record.  The average value of new construction was $54,577, and more than half of all new permits originated from the two counties of Lee (302 permits) and Manatee (231 permits).

Out of more than 155 contractors with new swimming pool construction on record in the area last month, the following ranked as the top three for total new permits:

Builder Total Permits
1-Aragon Pools & Spas 84
2-Coast to Coast Pools 66
3-Pinnacle USA 60

Southeast

Last month, there were 646 new swimming pool construction permits with a total value of nearly $34.5 million on record for the southeastern region of Florida.  The average value of new construction was lowest in the Southeast (average value: $53,338) in comparison to other regions reviewed, and more than 65 percent of all new pool construction activity originated from the two counties of Palm Beach (293 permits) and Miami-Dade (131 permits).

Out of the nearly 210 pool builders with new construction on record in the southeast last month, the following ranked as the top three for total new permits:

Builder Total Permits
1-Crystal Pools 26
2-Swimming Pool Contractors 25
3-A&G Concrete Pools 24

Tampa

In Tampa, there were 486 new swimming pool construction permits with a total value in excess of $32 million on record for the month of January.  The average value of new pool construction landed on the higher end of the spectrum (average value: $65,932) in comparison to other Florida regions reviewed, and the majority of all new construction took place in the two counties of Hillsborough (189 permits) and Polk (104 permits).

Out of the 135 contractors with new pool construction on record in the area last month, the following ranked as the top three for total new permits:

Builder Total Permits
1-Challenger Pools 31
2-Tampa Bay Pools 19
3-T&D Pool & Spa Construction 19

Orlando

Last month, there were approximately 330 new swimming pool construction permits with at total value of $20 million on record for the Orlando area.  The average value of new construction was $60,767, and more than half of all new permits originated from the two counties of Orange (128 permits) and Brevard (72 permits).

Out of the more than 90 contractors with new pool construction activity on record for Orlando last month, the following ranked as the top three for total new permits:

Builder Total Permits
1-American Pools & Spas 33
2-Dreamscapes Pools & Spas 21
3-Dixie Pools & Spas 15

Jacksonville

In the Jacksonville area, there were approximately 265 new swimming pool construction permits with a total value in excess of $19.6 million on record last month.  The average value of new pool construction was highest in Jacksonville (average value: $74,360) in comparison to other regions reviewed, and nearly half of all new permits originated from St. Johns County (129 permits).

Out of 80 pool builders with new construction activity on record in the area last month, the following ranked as the top three for total new permits:

Builder Total Permits
1-Pools by John Clarkson 17
2-Epic Pools & Hardscape Construction 12
3-Blue Haven Pools 11


To gain more information on the builders, homeowners and permits for the construction activity above, check out HBW for your copy of the latest construction data reports. To gain access to the HBW database and receive custom and detailed reports on the latest residential and commercial building activity in Florida, Georgia, Texas, Alabama, and Oklahoma, please contact HBW for details.

Top Texas Home Builders – January 2022

A review of leading home builders in Texas based on new permit data on record with HBW during the month of January

Last week, we reviewed the latest permit data available from HBW for new residential construction in Texas and found that there were approximately 9,420 new residential construction permits with a total value of nearly $2.6 billion added to the HBW database during the month of January. Today, we are taking a look at the same construction data reports to identify the leading contractors who carried the highest volume of new permits last month.  And while each metropolitan area of Texas has its own unique lineup of leading home builders, there have been and continue to be two major players in the market month after month – From across the four major metro areas reviewed (Houston, Dallas, Austin, San Antonio), both D.R. Horton and Lennar Homes continue to carry the highest concentration of new residential construction activity, having 1,216 and 766 permits on record respectively; this figure reflects more than 20 percent of all new home construction on record for the Lone Star State last month.

Here is a closer look at the top five builders in each major metro area in Texas based on the total number of permits on record with HBW during the month of January 2022:

Houston

Builder Total Permits   Average Value 
1-Lennar Homes 351  $      194,810.00
2-D.R. Horton 315  $      149,377.00
3-Pulte Homes 214  $      268,967.00
4-Meritage Homes 201  $      249,286.00
5-K Hovnanian Homes 162  $      166,067.00

Dallas

Builder Total Permits  Average Value
1-D.R. Horton 620 $228,787.00
2-Lennar Homes 240 $249,504.00
3-Bloomfield Homes 158 $323,459.00
4-First Texas Homes 124 $408,513.00
5-Pulte Homes 118 $248,989.00

Austin

Builder Total Permits  Average Value
1-D.R. Horton 202 $231,862.00
2-Brookfield Resid. Texas Homes 140 $335,371.00
3-Meritage Homes 140 $267,665.00
4-KB Homes 119 $238,734.00
5-Taylor Morrison Homes 98 $401,783.00

San Antonio

Builder Total Permits  Average Value
1-Lennar Homes 134 $164,980.00
2-D.R. Horton 79 $203,650.00
3-KB Homes 58 $220,913.00
4-LGI Homes 56 $177,276.00
5-Continental Homes of Texas 54 $250,000.00


To gain more information on the builders, homeowners and permits for the construction activity above, check out HBW for your copy of the latest construction data reports. To gain access to the HBW database and receive custom and detailed reports on the latest residential and commercial building activity in Florida, Georgia, Texas, Alabama, and Oklahoma, please contact HBW for details.
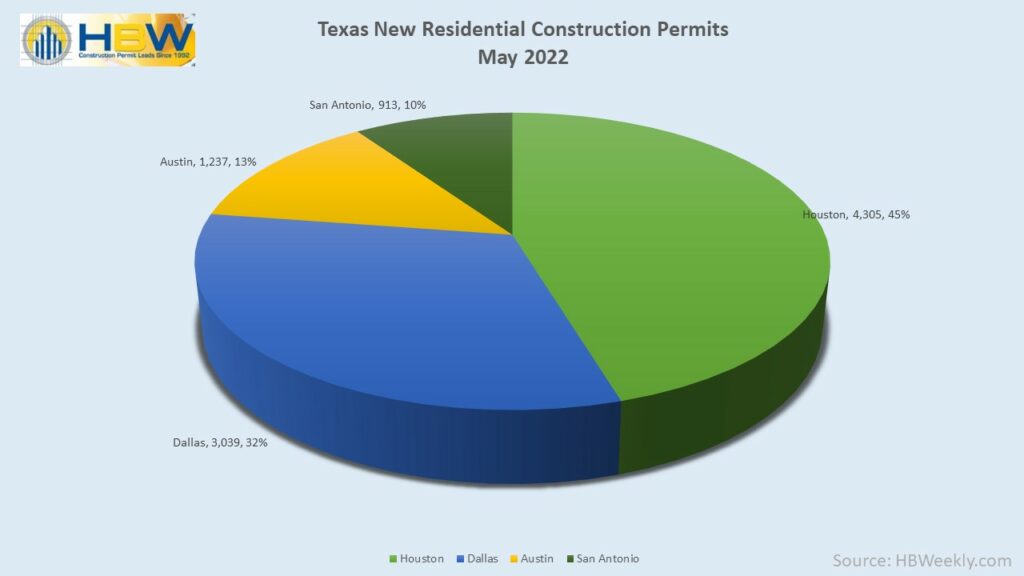
Texas Residential Construction Review – January 2022

A quick view of permit data for new home construction in Texas during the month of January 2022

New home construction in the Lone Star State is off to an impressive and strong start this year. In January, there have already been approximately 9,420 new residential construction permits with a total value of nearly $2.6 billion added to the HBW database for Texas; this figure reflects a remarkable month-over-month increase of ~44 percent in new home construction.

Out of the four major metro areas reviewed (Dallas, Houston, Austin, San Antonio), Houston (3,793 permits) held the highest concentration of new permits last month, while Austin came out on top for value by having the highest average value of new home construction on record for the month (average value: $321,203).

Here is a closer look at the total permits, average values, and leading counties for new residential construction in Texas during the month of January 2022:

Houston

As noted above, Houston led Texas for new home construction last month, having 3,793 new permits with a total construction value of approximately $897 million on record.  The average value of new residential construction in Houston landed on the lower end of the spectrum (average value: $236,383), and approximately 74 percent all new permits originated from the two counties of Harris County (1,849 permits) and Montgomery (950 permits).

Dallas

Not far behind Houston, the Dallas area ranked second for new home construction having 3,224 new permits with a total value of nearly $991 million last month.  The average value of construction was $307,264, and more than half of all new permits originated from the two counties of Tarrant and Collin where there were 1,001 and 732 new permits on record respectively.

Austin

In Austin, there were 1,512 new residential construction permits with a total value of nearly $486 million last month.  The average value of construction was highest in Austin (average value: $321,203) in comparison to other metro areas reviewed, and more than half of all new permits originated from Travis County (872 permits).

San Antonio

In the San Antonio area, there were approximately 890 new residential construction permits with a total value in excess of $197 million last month. The average value of construction was lowest in San Antonio (average value: $221,825) in comparison to other Texas areas reviewed, and the majority of all new home construction activity took place in Bexar County where there were more than 530 new permits on record with HBW for the one-month period.


To gain more information on the builders, homeowners and permits for the construction activity above, check out HBW for your copy of the latest construction data reports. To gain access to the HBW database and receive custom and detailed reports on the latest residential and commercial building activity in Florida, Georgia, Texas, Alabama, and Oklahoma, please contact HBW for details.
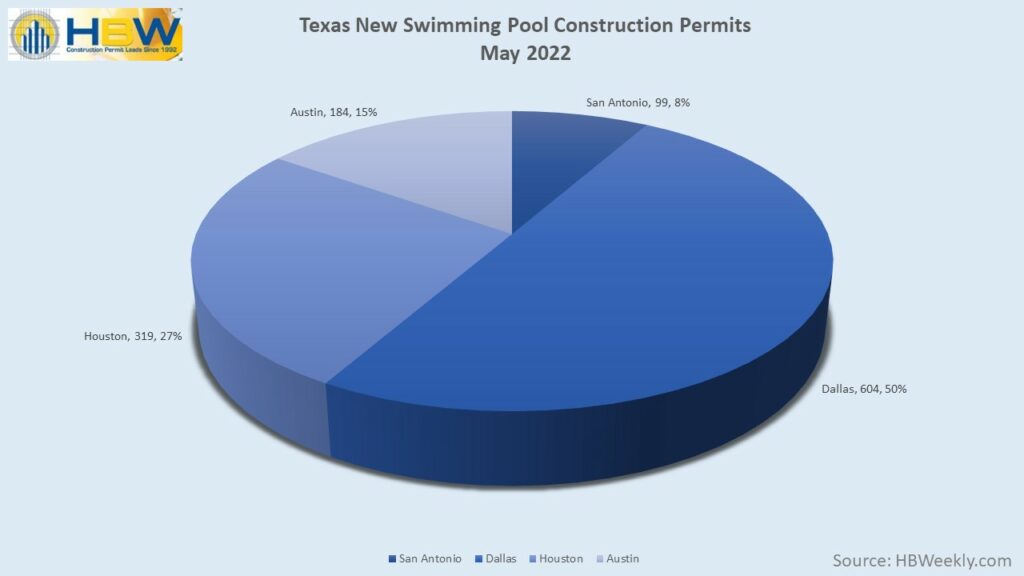
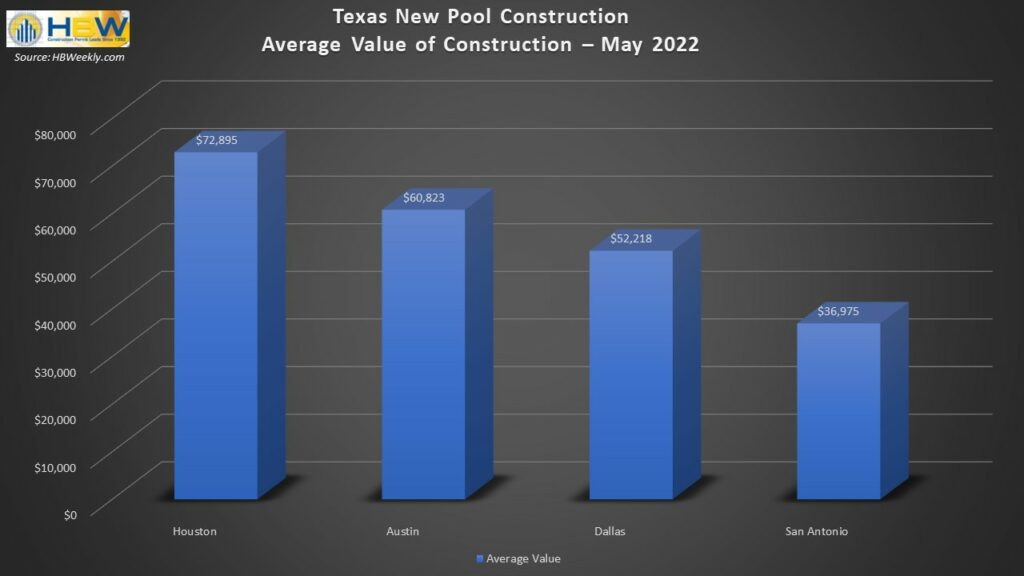
Texas Swimming Pool Construction Review – January 2022

An overview of permit data for new swimming pool construction in Texas during the month of January 2022

Since the start of this year, new swimming pool construction has been off to a solid start in the Lone Star State.  Last month, there were more than 1,215 new permits with a total construction value in excess of $67 million on record with HBW, reflecting a 32 percent month-over-month increase in new pool construction.

Out of the four metro areas (Dallas, Houston, Austin, San Antonio) included in the reports, Dallas (510 permits) held the greatest amount of new pool construction activity, while the highest average value of new pool construction could be found in Houston (average value: $69,846).

Here is closer look at the total permits, average value of construction and leading counties and contractors for new pool construction in the four major metro areas of Texas during the month of January:

Dallas

As previously noted, the Dallas area carried the highest level of new pool construction in comparison to other Texas regions reviewed.  Last month, there were 510 new permits with a total construction value of nearly $26.4 million added to the HBW database for the area.  The average value of construction was $51,706, and more than 60 percent of all new permits originated from the two counties of Collin (168 permits) and Dallas (143 permits).

Out of the approximately 180 pool builders with new construction activity on record in the Dallas area last month, the following ranked as the top three for total new permits:

Builder Total Permits
1-Riverbend Pools 31
2-Gold Medal Pools 27
3-Foley Custom Pools 22

Houston

In Houston, there were approximately 390 new swimming pool construction permits with a total value of nearly $27.2 million added to the HBW database last month.  The average value of pool construction was highest in Houston (average value: $69,846) in comparison to other Texas regions reviewed, and more than half of all new construction activity took place in Harris County (209 permits).

Out of the approximately 175 pool builders with new construction activity on record in the Houston area last month, the following ranked as the top three for total new permits:

Builder Total Permits
1-Platinum Pools 26
2-McKinney Custom Pools 18
3-Premier Pools 17

Austin

Last month, there were nearly 200 new swimming pool construction permits with a total value of more than $9.4 million on record with HBW for the Austin area.  The average value of new pool construction was $47,854, and the bulk of new construction activity took place in Travis County (147 permits).

Out of nearly 90 pool builders with new construction activity on record in Austin last month, the following ranked as the top three for total new permits:

Builder Total Permits
1-Cody Pools 23
2-Denali Pools 11
3-Anthony & Sylvan Pools 7

San Antonio

In San Antonio, there were more than 120 new swimming pool construction permits with a total value of approximately $4.2 million on record last month.  The average value of construction was lowest in San Antonio (average value: $34,415) in comparison to other Texas areas reviewed, and more than half of all new permits originated from Bexar County where there were 73 permits on record for the one-month period.

Out of more than 40 pool builders with new swimming pool construction activity on record in San Antonio last month, the following ranked as the top three for total new permits:

Builder Total Permits
1-Keith Zars Pools 23
2-Cody Pools 12
3-Blue Haven Pools 9

To gain more information on the builders, homeowners and permits for the construction activity above, check out HBW for your copy of the latest construction data reports. To gain access to the HBW database and receive custom and detailed reports on the latest residential and commercial building activity in Florida, Georgia, Texas, Alabama, and Oklahoma, please contact HBW for details.

Florida Swimming Pool Construction Report – 2021

An overview of permit data for new swimming pool construction in Florida during 2021

Florida has experienced its best year yet when it comes to new swimming pool construction.  While swimming pools usually come to mind when thinking of Florida, the rate of new construction last year was a step above the usual.  Based on the latest HBW Swimming Pool Construction Activity Trend Reports for Florida, last year there was approximately a 30 percent year-over-year increase in new pool construction, resulting in more than 41,500 new permits on record with HBW.

Out of the six regions included in the report (Southeast, Southwest, Northeast, Northwest, Central and West), the highest concentration of new permits could be found in Southwest Florida (13,678 permits); in comparison to other Florida regions reviewed, the Southwest also reflected the greatest annual rate of growth with a 55 percent year-over-year increase in new permits.

Here is a breakdown of the total permits, year-over-year growth rates and leading counties for new swimming pool construction throughout the Sunshine State last year:

Southwest

Total Permits in 2021: 13,678

Annual Growth Rate (YOY): 55 percent

Leading Counties for new permits: Lee County (4,564 permits, +56% YOY); Collier County (2,666 permits, +76% YOY)

Southeast

Total Permits in 2021: 8,189

Annual Growth Rate (YOY): 46 percent

Leading Counties for new permits: Palm Beach County (3,077 permits, +34% YOY); Miami-Dade County (2,307 permits, +28% YOY)

West

Total Permits in 2021: 7,033

Annual Growth Rate (YOY): 14 percent

Leading Counties for new permits: Pasco County (1,893 permits, +29% YOY); Hillsborough County (1,562 permits, -14% YOY)

Central

Total Permits in 2021: 5,410

Annual Growth Rate (YOY): 16 percent

Leading Counties for new permits: Orange County (2,253 permits, +22% YOY); Brevard County (1,069 permits, +4% YOY)

Northeast

Total Permits in 2021: 3,894

Annual Growth Rate (YOY): 15 percent

Leading Counties for new permits: St. Johns County (1,497 permits, +16% YOY); Duval County (751 permits, -6% YOY)

Northwest

Total Permits in 2021: 3,305

Annual Growth Rate (YOY): 7 percent

Leading Counties for new permits: Santa Rosa County (643 permits, +6% YOY); Walton County (435 permits, +2% YOY)

To gain more information on the builders, homeowners and permits for the construction activity above, check out HBW for your copy of the latest construction data reports. To gain access to the HBW database and receive custom and detailed reports on the latest residential and commercial building activity in Florida, Georgia, Texas, Alabama, and Oklahoma, please contact HBW for details.