HBW Quarterly – Texas Swimming Pool Construction Q3-2021

A review of permit data for swimming pool construction in Texas from January through September 2021

Since 2018, new swimming pool construction has been on the rise in Texas, with annual increases ranging from 3 percent (2019) to 29 percent (2020); so far this year (thru Q3-2021), the upward trend appears to be holding as there has been a 21 percent year-over-year increase in new swimming pool construction activity, resulting in more than 10,000 new permits on record with HBW.

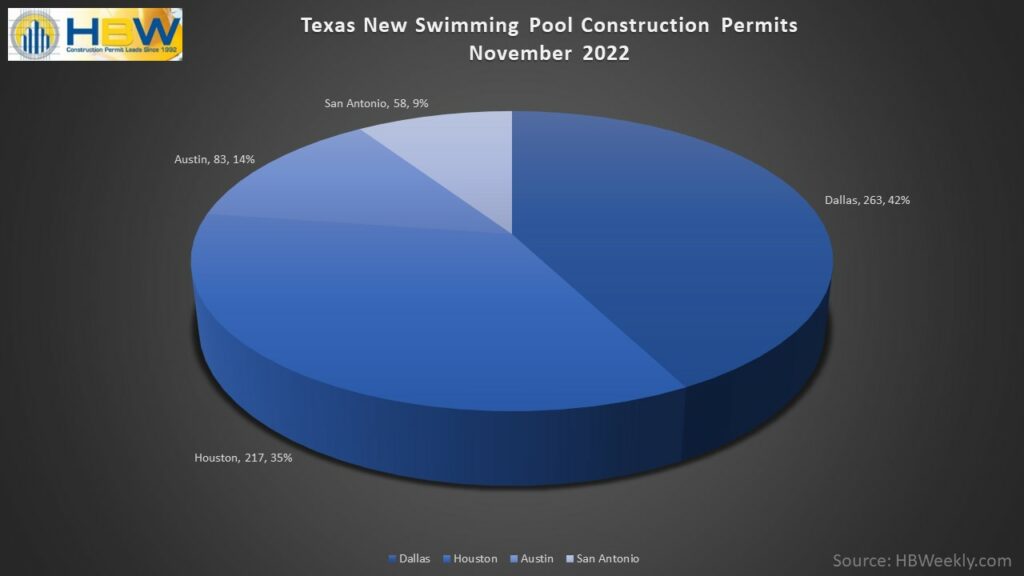
Out of the four major metro areas reviewed (Houston, Dallas, Austin, San Antonio), Houston has experienced the greatest boost in new swimming pool construction, having a 28 percent year-over-year increase and approximately 3,570 new permits on record through Q3-2021.  As far as the highest concentration of permits is concerned, Dallas ranked #1 as there were approximately 4,775 new permits on record through Q3, reflecting a 23 percent increase in swimming pool construction in comparison to the same time last year.

Another area worth noting is Austin.  Over the last four years, swimming pool construction has been on the rise in the Austin area, and as of the latest Q3 reports, that pattern appears to be holding; from the start of this year through September, Austin has demonstrated a 2 percent year-over-year increase in new pool construction, resulting in more than 1,000 new permits on record with HBW.

While San Antonio had the lowest total number of swimming pool starts on file through the third quarter of this year, the area reflects gains in new pool construction.  Since the start of this year (through September), there has been a 6 percent year-over-year increase in new pool construction, resulting in approximately 690 new permits added to the HBW database. 

When looking at construction patterns from a county-by-county perspective, there were four counties that held 60 percent of all new permitting activity:

Harris County (Houston area) was a standout, as there were approximately 2,075 new permits resulting from a 26 percent year-over-year increase in new pool construction.  In the Dallas area, the bulk of new construction permits originated from the counties of Collin (1,576 permits), Tarrant (1,292 permits), and Denton (1,111 permits) where there have been year-over-increases in swimming pool construction ranging from 25 percent (Tarrant) to 67 percent (Denton).


To gain more information on the builders, homeowners and permits for the construction activity above, check out HBW for your copy of the latest construction data reports. To gain access to the HBW database and receive custom and detailed reports on the latest residential and commercial building activity in Florida, Georgia, Texas, Alabama, and Oklahoma, please contact HBW for details.

Florida Residential Construction Review – September 2021

A review of permit data for new home construction in Florida during the month of September 2021

Based on HBW’s latest construction data reports, there were 8,421 new residential construction permits with a total value in excess of $2.4 billion added to the HBW database for the Sunshine State last month; this reflects about a 21 percent month-over-month decrease in new home construction.

Out of the five regions covered in the reports (Southwest, Tampa, Orlando, Southeast, Jacksonville), the greatest concentration of new home construction activity took place in the Southwest (2,516 permits), while the highest average value of new residential construction permits could be found in the Southeast (average value: $308,486).

Here is a closer look at the total permits, average value of construction, leading counties, and top home builders for each of the Florida regions reviewed:

Total Permits

As noted above, there were 8,421 new residential construction permits added to the HBW database for the month of September.  Out of the five regions reviewed, the southwestern region carried 30 percent of all new construction, while the southeastern region carried the fewest (10 percent) new permits on record.  Total permits by area for the one-month period are as follows:

Average Value

Across the Sunshine State, the average value of new home construction ranged from a high of $308,486 (Southeast) to a low of $241,970 (Jacksonville):

Top Counties

Out of the approximately 30 counties included in the construction data reports for Florida, there were five counties that carried nearly 40 percent of all new construction activity, and the total permits on record for each of those counties are as follows:

  • Lee County (Southwest) – 850 permits
  • Hillsborough County (Tampa) – 800 permits
  • Pasco County (Tampa) – 612 permits
  • Polk County (Tampa) – 504 permits
  • Sarasota County (Southwest) – 497 permits

Leading Home Builders

Although hundreds of contractors were actively pulling new residential construction permits last month, there were three home builders that carried the greatest share of new permits for the one-month period; those top three home builders are as follows:

#1 – D.R. Horton (1,229 permits)

#2 – Lennar Homes (1,082 permits)

#3 – Pulte Homes (640 permits)


To gain more information on the builders, homeowners and permits for the construction activity above, check out HBW for your copy of the latest construction data reports. To gain access to the HBW database and receive custom and detailed reports on the latest residential and commercial building activity in Florida, Georgia, Texas, Alabama, and Oklahoma, please contact HBW for details.
HBW Report: Florida Swimming Pool Construction – September 2021

A review of permit data for new swimming pool construction in Florida during the month of September 2021

Based on the latest construction data reports from HBW, last month there were nearly 2,870 new swimming pool construction permits with a total value in excess of $160 million added to the HBW database for Florida.  Out of five major regions reviewed (Tampa, Southwest, Orlando, Southeast, Jacksonville), the southwestern region (1,146 permits) carried the highest volume of new swimming pool construction, while Jacksonville (average value: $69,141) carried the highest average value of construction.

Here is a breakdown of new pool construction activity, by region, across the Sunshine State during the month of September 2021:

Southwest

As previously noted, the southwestern region of Florida ranked #1 for new pool construction, having 1,146 new permits with a total construction value of nearly $59.7 million on record for the month of September.  The average value of construction landed on the lower end of the spectrum (average value: $52,071) in comparison to other Florida regions reviewed, and more than half of all new permits originated from the counties of Lee (379 permits) and Collier (300 permits).

Out of the 180 contractors with new pool construction activity on record in the area last month, the following ranked as the top three for total new permits:

Builder Total Permits
1-Aragon Pools & Spas 187
2-Coast to Coast Pools 97
3-Pinnacle USA 69

Southeast

Last month, there were more than 600 new swimming pool construction permits with a total value of $30.7 million on record for the southeastern region of Florida.  The average value of new pool construction was $51,101, which was lowest in comparison to other Florida regions reviewed, and more than half of all new permits originated from the two counties of Miami-Dade (186 permits) and Palm Beach (182 permits).

Out of the 210 pool builders with new construction activity on record in the area last month, the following ranked as the top three for total new permits:

Builder Total Permits
1-A&G Concrete Pools 26
2-Fountain Blue Pool Service 20
3-Apex Pavers & Pools 18

Tampa

In Tampa, there were more than 550 new swimming pool permits with a total value of nearly $36 million added to the HBW database last month.  The average value of new pool construction was $64,966, and more than half of all new construction activity took place in the counties of Hillsborough (185 permits) and Pasco (116 permits).

Out of approximately 145 contractors with new pool construction on record in the Tampa area last month, the following ranked as the top three for total new permits:

Builder Total Permits
1-Challenger Pools 33
2-T&D Pool Construction 30
3-Pointer Pools & Spas 21

Orlando

Last month, there were more than 315 new swimming pool construction permits with a total value of approximately $16.6 million on record for the Orlando area.  The average value of new pool construction was $52,452, and nearly half of all new permits originated from Orange County (145 permits).

Out of the more than 85 contractors with new swimming pool construction on record in the area last month, the following ranked as the top three for total permits:

Builder Total Permits
1-Dreamscapes Pools & Spas 21
2-Legacy Pools 16
3-Holland Pools 16

Jacksonville

In Jacksonville, there were more than 250 new pool permits with a total value in excess of $69 million last month.  The average value of new pool construction was highest in the Jacksonville area (average value: $69,141) in comparison to other Florida regions reviewed, and the bulk of new construction activity took place in St. Johns County and Duval County where there were 115 and 61 permits respectively.

Out of 75 pool builders with new construction activity on record in Jacksonville last month, the following ranked as the top three for total new permits:

Builder Total Permits
1-Pools by John Clarkson 22
2-Palace Pools 11
3-Kerry Martin Pools 9


For more information on the builders, homeowners and permits for the construction activity above, check out HBW for your copy of the latest construction data reports. To gain access to the HBW database and receive custom and detailed reports on the latest residential and commercial building activity in Florida, Georgia, Texas, Alabama, and Oklahoma, please contact HBW for details.
Texas New Home Construction by the Numbers – September 2021

An overview of permit data for new home construction in Texas during the month of September 2021

Based on HBW’s latest construction data reports, there were more than 6,360 new residential construction permits with a total construction value of nearly $1.7 billion in Texas last month.  Out of the four major metro regions reviewed (Houston, Dallas, Austin, San Antonio), the highest concentration of new permitting activity could be found in Houston, where there were 2,831 new permits for the one-month period, while the highest average value of new home construction could be found in Dallas (average value: $326,192).

Here is a closer look and visual breakdown of the new permitting activity, average value of construction projects, as well as leading counties and contractors for new home construction in Texas last month:

New Permits

As previously noted, just over 6,360 new residential construction permits were added to the HBW database for Texas last month.  The total permits recorded for each metro area are as follows:

Average Value of Construction

Last month, the average value of new home construction in Texas ranged from a low of $196,979 (San Antonio) to a high of $326,192 (Dallas).  Here is a closer look at the average value of new residential construction permits in each of the four Texas metro areas based on total new permits on record for September:

Leading Counties

While each metro area has one or two counties where new residential construction is concentrated, when taking a statewide perspective, the top ten counties for new home construction in Texas (based on total permits) are as follows:

Top Ranked Home Builders

Every month, HBW reports provide valuable data on the contractors that are driving new residential construction figures, and month after month two major players continue to dominate the Lone Star State: D.R. Horton and Lennar Homes.  Based on total new permits on record for the month of September, the following Texas home builders ranked as the top three for the one-month period:

#1 – D.R. Horton: 721 permits

#2 – Lennar Homes: 461 permits

#3 – Pulte Homes: 218 permits


To gain more information on the builders, homeowners and permits for the construction activity above, check out HBW for your copy of the latest construction data reports. To gain access to the HBW database and receive custom and detailed reports on the latest residential and commercial building activity in Florida, Georgia, Texas, Alabama, and Oklahoma, please contact HBW for details.

Texas Swimming Pool Construction Report – September 2021

A review of the latest permit data for new swimming pool construction in the Lone Star State during the month of September 2021

Based on the latest HBW construction data reports, there were 850 new swimming pool permits with a total value in excess of $45.5 million added to the HBW for Texas last month; this reflects a 25 percent month-over-month decrease in new pool construction.

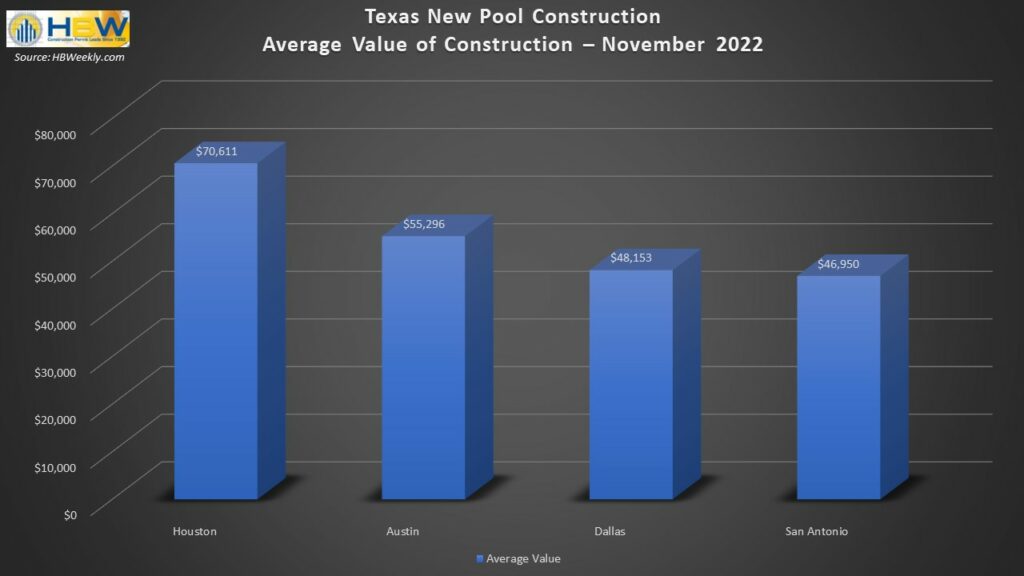
Out of the four major metro areas reviewed (Dallas, Houston, Austin, San Antonio), Dallas ranked #1 for new pool construction having nearly 390 new permits on record for the one-month period, and Houston carried the highest average value of new pool construction (average value: $66,099).

Here is a closer look at new pool construction activity in Dallas, Houston, Austin and San Antonio last month:

Dallas

Out of the four major metro areas reviewed, Dallas held the highest concentration of new pool construction last month, having nearly 390 new permits for the one-month period.  The average value of new pool construction was $44,876, and the majority of all permits originated from the counties of Collin (148 permits) and Tarrant (102 permits).

Out of the 160 contractors with new swimming pool construction activity on record for the Dallas area last month, the following ranked as the top three for total new permits:

Builder Total Permits
1-Prestige Pool 20
2-Riverbend Pools 20
3-Foley Custom Pools 20

Houston

During the month of September, there were approximately 295 new swimming pool construction permits added to the HBW database for Houston.  The average value of new pool construction was highest in Houston (average value: $66,099) in comparison to other Texas regions reviewed, and nearly half of all new construction took place in Harris County (132 permits).

Out of the more than 120 pool builders with new construction activity on record in the Houston area last month, the following ranked as the top three for total new permits:

Builder Total Permits
1-Anthony & Sylvan Pools 30
2-Platinum Pools 22
3-Premier Pools 18

Austin

Austin ranked #3 for new pool construction last month, having 93 new permits added to the HBW database.  The average value of new pool construction landed on the higher end of the spectrum (average value: $65,876), and nearly all permits originated from the two counties of Travis County (49 permits) and Williamson (39 permits).

Out of the approximately 50 contractors with new pool construction on record in the Austin area last month, the following rank as the top three for total new permits:

Builder Total Permits
1-Denali Pools 14
2-Texas Pools & Patios 8
3-Premier Pools & Spas of Austin 6

San Antonio

San Antonio held both the lowest amount of new pool construction activity and the lowest average value of construction, having 76 new permits and an average value of approximately $35,130 on record with HBW last month.  Nearly all new pool construction took place in Bexar County where there were 64 new permits on record for the one-month period.

Out of the 30 contractors with new swimming pool construction activity on record in the San Antonio area last month, the following ranked as the top three for total new permits:

Builder Total Permits
1-Cody Pools 13
2-Keith Zars Pools 12
3-Alamo Pool Builders 8


To gain more information on the builders, homeowners and permits for the construction activity above, check out HBW for your copy of the latest construction data reports. To gain access to the HBW database and receive custom and detailed reports on the latest residential and commercial building activity in Florida, Georgia, Texas, Alabama, and Oklahoma, please contact HBW for details.

HBW Quarterly Report: Metro Atlanta Residential Construction (Q3-2021)

A review of new residential construction permit data for the Metro Atlanta area from January through September 2021

Things are looking up in the Atlanta area, and by “up” I mean the residential construction market.  After three years of a slow decline in activity, new home construction appears to be climbing again in Atlanta.  From January through September of this year, there have already been approximately 22,430 new permits added to the HBW database for the Metro Atlanta area, reflecting a 42 percent increase in new home construction in comparison to the same time last year.

The counties with the highest concentration of new residential construction activity for the nine-month period include:

  • Gwinnett County – Last year, Gwinnett County climbed out of a two-year decline in new home construction by having a 17 percent year-over-year increase in new permits during 2020.  This year, the upward pattern appears to be holding as there have been 3,515 new residential construction permits through Q3-2021, reflecting a 39 percent increase in new home construction in comparison to the same time last year.  
  • Forsyth County – Forsyth County had been experiencing a decrease in housing starts year after year since 2016 until last year when the market took a turn for the better; in 2020, Forsyth exhibited a 10 percent year-over-year increase in new home construction, and through the third quarter of this year the upward trend has continued. As of Q3-2021, there have been nearly 1,975 new permits added to the HBW database for Forsyth County, reflecting a 38 percent year-over-year increase in new home construction.
  • Fulton County – Since the start of this year (thru Q3), Fulton County has experienced a 95 percent year-over-year uptick in new home construction, resulting in 1,895 new permits on record with HBW. The area appears to be recovering from a two-year (2019 and 2020) decline in the market, and it also ranks #1 for higher value housing starts, having 328 new permits with construction values in excess of $500k.
  • Cherokee County – Not far behind Fulton County, there have been 1,827 new residential construction permits added to the HBW database for Cherokee County through Q3, reflecting a 14 percent increase in comparison to the same time last year.
  • Henry County – Henry County ranked #5 for new home construction through Q3-2021, having 1,546 new permits on record for the nine-month period; this reflects a 50 percent year-over-year increase in new home construction.


Information utilized for the above listed figures for Metro Atlanta residential construction was directly derived from HBW construction data reports. To gain access to the HBW database and receive custom and detailed reports on the latest residential and commercial building activity in Florida, Georgia, Texas, Alabama, and Oklahoma, please contact HBW for details.
Atlanta Quarterly Report: Swimming Pool Construction – Q3-2021

A review of permit data for new swimming pool construction in the Metro Atlanta area from January through September 2021

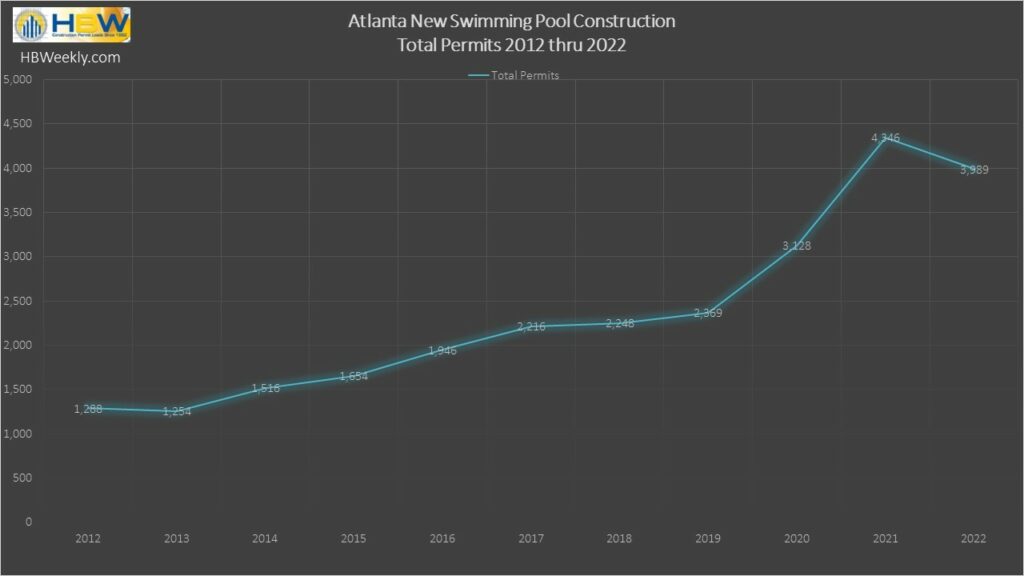
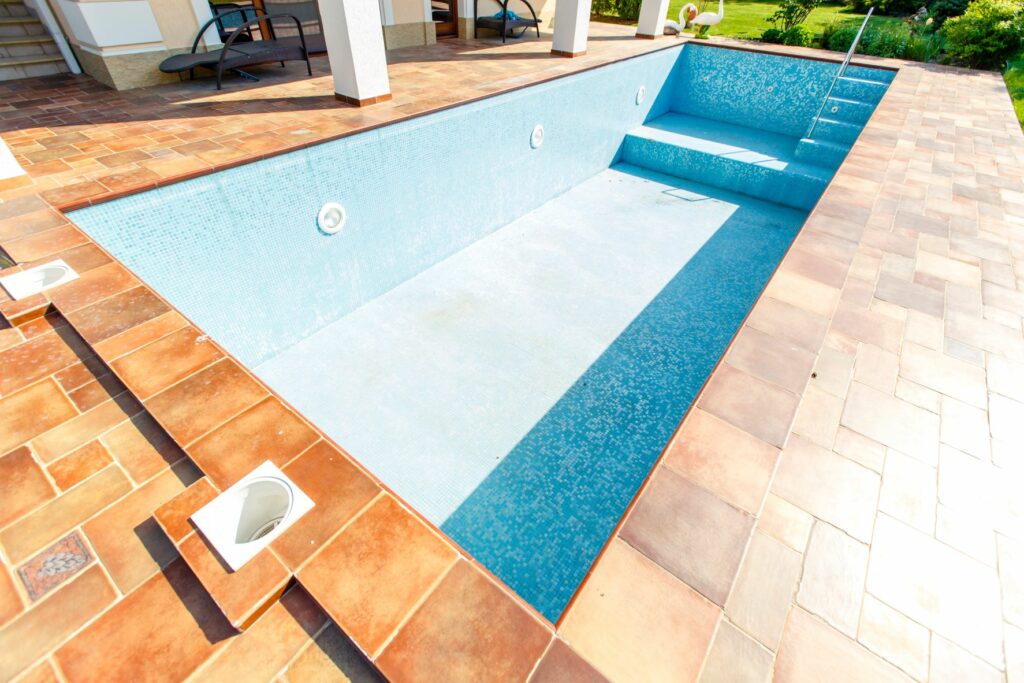
Over the last seven years, new swimming pool construction has been on the rise in the Metro Atlanta area, and through the third quarter of this year, the upward pattern appears to be dramatically increasing. From January 2021 through September 2021, there have been 3,480 new swimming pool permits added to the HBW database for Atlanta; this figure reflects a massive 68 percent increase in new swimming pool construction in comparison to the same time last year.

Out of the 24 counties reviewed, Fulton County ranked #1 for new swimming pool construction, having approximately 665 new permits on record with HBW through Q3-2021; this reflects a 129 percent year-over-year increase in new pool construction so far this year.  Since 2015, Fulton County has experienced annual growth in swimming pool construction activity ranging from a low of 5 percent to a high of 23 percent, and with just one more quarter remaining this year, it looks like 2021 could be the strongest year yet for the local market.

Just behind Fulton County, Cobb County ranked second for total new swimming pool construction permits through the third quarter of this year. Having 453 new permits on record so far this year, Cobb County has demonstrated a 43 percent increase in new pool construction through Q3.

Next in line, we have the counties of Gwinnett and Cherokee – Both areas had approximately 320 new swimming pool permits added to the HBW database since the start of this year (thru Q3), reflecting year-over-year increases of 24 percent and 10 percent respectively. 

Other Metro Atlanta areas that are seeing higher levels of new swimming pool construction activity include: Forsyth County (305 permits); Fayette County (202 permits); and Coweta County (197 permits).


To gain more information on the builders, homeowners and permits for the construction activity above, check out HBW for your copy of the latest construction data reports. To gain access to the HBW database and receive custom and detailed reports on the latest residential and commercial building activity in Florida, Georgia, Texas, Alabama, and Oklahoma, please contact HBW for details.
Lessons Learned from #SocialMediaDown

If you were anywhere on the planet this week, then you know that on Monday at around 11:30 a.m. (EDT) Facebook and its other social platforms (Instagram, WhatsApp) went down for just about six hours.  While this came as a shock to most people, so much so that they were refreshing their apps until their fingers were sore, the truth is that technology has its limits.  Just as with everything in life, things happen, and survival is more about adapting to those changes then avoiding them. 

When it comes to your marketing efforts, there is much to be learned from this brief moment in time when it appeared that every social influencer was holding their breath and Twitter became the golden child.  The overall lesson is that you cannot rely on social media alone to reach your audience, just like you can’t and shouldn’t rely on any single touchpoint to engage your customers.  In order to truly engage your customers and attract prospects, you must diversify your marketing efforts to meet and communicate in a way that reaches everyone. Even prior to this halt in traffic on the mega-platforms, the construction industry has been well aware of many commercial and residential clients who simply are not active on social media at all.  Proposals are often still emailed, printed or even presented in-person (yes, really).  There is a generation of customers who are more comfortable with phone, mail and face-to-face interaction than social media chatter, and while this population appears to be shrinking, it is important to provide a variety of methods for reaching your audience, and have multiple methods for them to reach you. 

So, what are a few key takeaways we can reap from Monday’s social scare?  Here are three things to keep in mind as you move forward in your marketing efforts, on and offline: 

  1. Diversify Your Platforms:  If you are on social media, then you are already creating content that can be shared on more than one platform, so don’t limit yourself.  If you are posting on Facebook, be sure to also have active profiles on Twitter, Instagram, LinkedIn, YouTube and wherever else your customers and prospects may be active.  Not to mention, more networks mean a greater presence online which can also help with SEO (Search Engine Optimization). 
  2. Diversify Your Communication: You simply cannot rely on your website or social media alone to drive customers to your business.  Some of the methods that may seem outdated are actually tried-and-true and will allow you to build a comprehensive marketing strategy.  From mailers and cold calls to local ads and email marketing, you can build a larger and stronger customer pool, as well as nurture your existing relationships. 
  3. Gain Direct Access: Having direct access to your customers is critical, and that’s not just when it comes to social media outages. You should be building your list of prospects from multiple (and reliable) sources. For HBW subscribers that means putting your monthly reports to good use by adding prospect data from the thousands of new permits to your current CRM (customer relationship management) software or database. You should also be actively collecting contact information from prospects through newsletter sign-ups, at conventions and more.

While Facebook’s apps are now up and running, and the six long hours endured on Monday will be reduced to just a few funny memes that may or may not be remembered, it is important to take this time to ensure that your company and brand continue to remain on your customers’ radar whether social media is up or down; by diversifying your communication methods and marketing strategies, you will be able to build better and stronger customer relationships that go far beyond your next post.

For more information on construction business marketing tips, stay connected with the HBW Blog.  To get ahead of construction activity and gain access to the latest permitting data in Florida, Texas, Georgia, Alabama and Oklahoma, contact HBW for more information on construction data reports and industry leads.

Top Florida Swimming Pool Builders – August 2021

A list of the leading pool builders in Florida based on the total number of new permits on record for the month of August 2021

As reported in HBW’s latest Florida Swimming Pool Construction Report, there were more than 3,475 new swimming pool construction permits with a total value of approximately $188.6 million on record for Florida last month, reflecting a 7 percent month-over-month increase in new pool permits.

When using HBW’s construction data reports to identify the leading swimming pool contractors statewide, we found that across the five major regions reviewed (Southwest, Tampa, Orlando, Southeast, Jacksonville) the list of top pool builders varied greatly from region to region; here is a list of the top five swimming pool builders in each Florida region based on total new permits on record with HBW for the month of August:

Southwest

Builder Total Permits  Average Value
1-Aragon Pools & Spas 126  $   33,849.00
2-Pinnacle USA 91  $   47,660.00
3-Coast to Coast Pools 76  $   42,708.00
4-Holiday Pools of West FL 60  $   41,099.00
5-Contemporary Pools 38  $   52,664.00

Tampa

Builder Total Permits  Average Value
1-Challenger Pools 48  $   77,256.00
2-T&D Pool Construction 30  $   50,963.00
3-Gulfstream Pools & Spas 28  $   64,378.00
4-Tropical Pools & Pavers 26  $   62,434.00
5-Staycation Pools & Spas 25  $   73,997.00

Orlando

Builder Total Permits  Average Value
1-American Pools & Spas 33  $   71,941.00
2-Dreamscapes Pools & Spas 33  $   47,997.00
3-Holland Pools 28  $   27,160.00
4-Intercoastal Pool & Spa Builders 21  $   26,562.00
5-Atlas Pools of Central Florida 20  $   89,916.00

Jacksonville

Builder Total Permits  Average Value
1-Blue Haven Pools 12  $   74,096.00
2-Builders Source 12  $   67,350.00
3-Kerry Martin Pools 11  $   73,727.00
4-Oak Wells Aquatics 10  $   61,080.00
5-Waldhauer & Son 10  $   53,130.00

Southeast

Builder Total Permits  Average Value
1-A&G Concrete Pools 30  $      62,214.00
2-Fountain Blue Pool Service 29  $      54,837.00
3-Van Kirk Construction 21  $      81,639.00
4-Swimming Pool Contractors 21  $      24,706.00
5-Endless Summer Pools of FL 19  $      41,333.00

For more information on the builders, homeowners and permits for the construction activity above, check out HBW for your copy of the latest construction data reports. To gain access to the HBW database and receive custom and detailed reports on the latest residential and commercial building activity in Florida, Georgia, Texas, Alabama, and Oklahoma, please contact HBW for details.

Florida Swimming Pool Construction Report – August 2021

An overview of new swimming pool construction permit data for Florida during the month of August

Based on HBW’s latest construction data reports, there were more than 3,475 new swimming pool construction permits with a total value of approximately $188.6 million on record for Florida last month; this reflects a 7 percent month-over-month increase in new swimming pool construction.  Out of the five major regions reviewed (Southwest, Tampa, Orlando, Southeast, Jacksonville), the greatest volume of new pool construction activity could be found in the Southwest (1,293 permits), while the lowest level of new construction activity could be found in the Jacksonville area (280 permits).

When reviewing the reports to identify counties with the highest levels of new swimming pool construction, there were five counties that carried approximately 44 percent of all new construction activity statewide last month; all of the counties were in the southern region and are as follows:

  1. Lee County (southwest): 470 permits
  2. Palm Beach County (southeast): 289 permits
  3. Manatee County (southwest): 268 permits
  4. Collier County (southwest): 248 permits
  5. Miami-Dade (southeast): 238 permits

As far as the average value of new pool construction permits is concerned, the average value of new construction ranged from a high of $62,698 (Tampa) to a low of $48,943 (Southwest).  Here is a closer look at the average value of new pool construction by region last month:

For more information on the builders, homeowners and permits for the construction activity above, check out HBW for your copy of the latest construction data reports. To gain access to the HBW database and receive custom and detailed reports on the latest residential and commercial building activity in Florida, Georgia, Texas, Alabama, and Oklahoma, please contact HBW for details.