Florida Quarterly Review: Swimming Pool Construction Q2-2022

A review of permit data for new swimming pool construction throughout Florida from January through June 2022

Based on HBW’s latest Swimming Pool Construction Activity Trend Report for Florida, new swimming pool construction appears to be holding steady with last year’s figures through the second quarter of this year. While new pool construction has been on the rise annually across the Sunshine State for the last several years, no major spikes in activity are on the radar yet for 2022.

From January through June of this year, there have been approximately 20,815 new swimming pool construction permits added to the HBW database from the six major regions of Florida (Southwest, Southeast, Central, Northwest, West, Northeast).  While the overall market statewide has not exhibited growth or decline at this point, West Florida is positioned slightly ahead of last year with a 5 percent year-over-year increase in new pool permits, while Northwest Florida is off to a slower start through the second quarter with an 8 percent year-over-year decrease in new pool construction.

Here is a closer look at the total permits, leading counties, and YTD % change in new swimming pool construction within each of the Florida regions reviewed:

Southwest

Out of all Florida regions reviewed, the greatest concentration of new swimming pool construction could be found in the southwestern region where there were 6,540 new permits on record with HBW through Q2.  New pool construction in the area appears to be holding steady, and figures are aligned with data on record from the same period last year.  Out of the five counties that make up the region, the bulk of new pool construction could be found in Lee County (2,001 permits), Sarasota County (1,305 permits), and Manatee County (1,260 permits).

Southeast

The southeastern region of Florida ranked #2 for new pool construction, having more than 4,050 new permits on record with HBW through the second quarter of this year; this figure reflects a level of construction activity that is steady and in line with figures from the same period last year.  Out of the seven counties that make up the southeastern region, the two counties of Palm Beach (1,413 permits) and Miami-Dade (1,026 permits) carried 60 percent of all new permitting activity.

West

As previously noted, West Florida is the only region that has exhibited a slight increase in new pool construction so far this year; since the start of this year (thru Q2), there have been 3,574 new permits added to the HBW database for the western region of the state, reflecting a 5 percent year-over-year increase in new pool construction.  Out of the seven counties included in the report, the majority of all new permits originated from Hillsborough County (1,122 permits) and Polk County (707 permits).

Central

Since the start of this year (thru Q2) there have been approximately 2,890 new swimming pool construction permits added to the HBW database for Central Florida, reflecting a 3 percent year-over-year decline in new pool construction activity.  Out of the six counties that make up the area, more than half of all new pool construction could be found in Orange County and Brevard County where there were 961 and 616 new permits on record respectively for the six-month period.

Northeast

Through the second quarter of this year, there have been nearly 2,100 new swimming pool construction permits added to the HBW database for the northeastern region of Florida; this figure reflects a minor 2 percent year-over-year decrease in new pool construction.  Out of the eight counties that make up the region, more than 70 percent of all new permits originated from the three counties of St. Johns (817 permits), Duval (392 permits), and Flagler (272 permits).

Northwest

In the northwestern region of Florida, there were more than 1,660 new swimming pool construction permits on record through Q2-2022, reflecting an 8 percent year-over-year decline in new pool construction activity. Out of the eighteen counties (16 Florida counties, 2 Alabama bordering counties) that were included in the report, nearly 70 percent of all new permits originated from the four counties of Baldwin (333 permits), Walton (324 permits), Santa Rosa (247 permits), and Bay (239 permits).

To gain more information on the builders, homeowners and permits for the construction activity above, check out HBW for your copy of the latest construction data reports. To gain access to the HBW database and receive custom and detailed reports on the latest residential and commercial building activity in Florida, Georgia, Texas, Alabama, and Oklahoma, please contact HBW for details.

HBW Report: Texas Swimming Pool Construction Q2-2022

An overview of new swimming pool construction permits in Texas from January through June 2022

Over the last several years, new swimming pool construction has been on the rise throughout Texas, and through the second quarter of this year the upward growth pattern has continued. From the four major metro areas of Texas (Dallas, Houston, Austin, San Antonio), there has been a four percent year-over-year increase in new swimming pool construction through Q2-2022, resulting in a combined total of 7,132 new permits on record with HBW. While the bulk of new permits originated from Dallas (3,470 permits) and Houston (1,973 permits), the greatest growth through the second quarter has taken place in San Antonio where there has been a 66 percent increase in new permits in comparison to the same period last year.

Here is a closer look at new swimming pool construction and permitting activity in each Texas Metro area:

Dallas

In Dallas, there has been a 3 percent year-over-year increase in new pool construction, resulting in 3,470 new permits on record with HBW.  Out of the six counties that make up the area, the greatest volume of new permitting activity could be found in the three counites of Collin (931 permits), Tarrant (793 permits), and Dallas (745 permits).

Houston

New swimming pool construction has been significantly increasing year after year in Houston since 2017, but the region is off to a slower start so far this year.  In the first half of 2022, Houston has experienced a 20 percent year-over-year decrease in new pool construction, resulting in 1,973 new permits for the six-month period.  More than half of all new pool construction has taken place in the larger county of Harris where there have been 1,105 new permits so far this year (thru June).

Austin

While Austin is positioned on the lower end of the spectrum for total pool starts, new pool construction has been picking up in the area over the last several years.  Since January (through June) of this year, the area has experienced a 59 percent year-over-year increase in new swimming pool construction, resulting in 1,066 new permits on record with HBW.  Nearly all new permits originated from Travis County (814 permits), where there has already been an impressive 106 percent year-over-year increase in new pool construction.

San Antonio

Although the San Antonio area had the fewest new swimming pool construction permits in comparison to other metro areas in the Lone Star State, pool construction is on the rise.  Since the start of this year, San Antonio has experienced a 66 percent year-over-year increase in new pool construction activity, resulting in approximately 625 new permits.  Most permitting activity originated from Bexar County (438 permits) which has also exhibited growth in swimming pool construction (+107% YOY).

To gain more information on the builders, homeowners and permits for the construction activity above, check out HBW for your copy of the latest construction data reports. To gain access to the HBW database and receive custom and detailed reports on the latest residential and commercial building activity in Florida, Georgia, Texas, Alabama, and Oklahoma, please contact HBW for details.
Quarterly Report: Atlanta Swimming Pool Construction Q2-2022

A review of permit data for new swimming pool construction in the Metro Atlanta area from January through June 2022

In Atlanta, new swimming pool construction permits have been on the rise year after year, until now.  Since 2015, HBW has identified marked growth in swimming pool construction ranging from annual increases as low as 1 percent to as high as 39 percent every year.  So far this year (thru Q2-2022), new swimming pool construction in the Metro Atlanta area appears to be off to a slower start as there has been an 11 percent year-over-year decrease in new pool construction activity, resulting in 2,112 new permits on record with HBW.

For the purpose of HBW reports, the Metro Atlanta area includes data from twenty-four counties.  Based on HBW’s latest Swimming Pool Construction Activity Trend Report for the second quarter of this year, and as noted in the above listed graph, the counties with the highest concentration of new swimming pool construction include: Fulton County (433 permits); Cobb County (219 permits); Cherokee County (181 permits); Gwinnett County (176 permits); Forsyth County (165 permits); and Coweta County (145 permits); all of the top listed counties are off to a slower start in new pool construction in comparison to the same time last year with the exception of Coweta County; new swimming pool construction activity has been on the rise in Coweta County since 2019, and through the second quarter of this year, the area has exhibited a 13 percent increase in comparison to the same time last year.

Although carrying lower levels of new construction activity, other Metro Atlanta area counties that are exhibiting healthy growth in new pool construction so far this year include Henry County (53% year-over-year increase) and Walton County (13% year-over-year increase).

Information utilized for the above listed figures for Metro Atlanta swimming pool construction was directly derived from HBW construction data reports. To gain access to the HBW database and receive custom and detailed reports on the latest residential and commercial building activity in Florida, Georgia, Texas, Alabama, and Oklahoma, please contact HBW for details.
HBW Report: Florida Residential Construction – June 2022

The latest permit data for new residential construction in Florida during the month of June 2022

Based on the latest construction data reports from HBW, there were 8,665 new residential construction permits with a total value in excess of $2.4 billion added to the HBW database for Florida last month. Out of the five Florida regions reviewed in the reports (Tampa, Southwest, Orlando, Southeast, Jacksonville), the greatest concentration of new home construction could be found in Tampa (2,424 permits), while the highest average value of new residential construction projects took place in the southeastern region (average value: $345,646).

Here is a detailed view of new residential construction permit data by region in the Sunshine State during the month of June 2022:

Tampa

In Tampa, there were 2,424 new residential construction permits with a total value of approximately $648 million added to the HBW database last month.  The average value of new home construction was $267,148, and from the six counties that make up the area, more than 54 percent of all new home construction activity took place in the two counties of Polk (723 permits) and Sumter (589 permits).

Southwest

The southwestern region ranked #2 in Florida for new home construction, as there were more than 2,300 new permits with a total construction value in excess of $609 million on record last month.  The average value of new home construction was $264,605 and more than half of all new permits originated from the counties of Lee (861 permits) and Manatee (503 permits).

Orlando

Last month, there were approximately 1,890 new residential construction permits with a total value of more than $585.2 million on record for the Orlando area.  The average value of new home construction landed mid-range (average value: $310,131) in relation to other Florida regions reviewed, and more than half of all new permits originated from the counties of Lake (604 permits) and Orange (385 permits).

Jacksonville

In Jacksonville, there were 1,264 new residential construction permits with a total value of nearly $323 million on record for the month of June. The average value of new home construction was lowest in the Jacksonville area (average value: $255,517) in comparison to other Florida regions reviewed, and out of the six counties that make up the area, approximately 72 percent of all new home construction took place in the two counties of St. Johns (478 permits) and Duval (433 permits).

Southeast

In the southeastern region of Florida, there were approximately 790 new residential construction permits with a total value of nearly $272.4 million on record with HBW last month.  As previously noted, the average value of new home construction was highest in the southeast (average value: $345,646) in comparison to other Florida regions reviewed, and the county with the highest concentration of new home construction activity was St. Lucie with 378 new permits on record for the one-month period.


To gain more information on the builders, homeowners and permits for the construction activity above, check out HBW for your copy of the latest construction data reports. To gain access to the HBW database and receive custom and detailed reports on the latest residential and commercial building activity in Florida, Georgia, Texas, Alabama, and Oklahoma, please contact HBW for details.
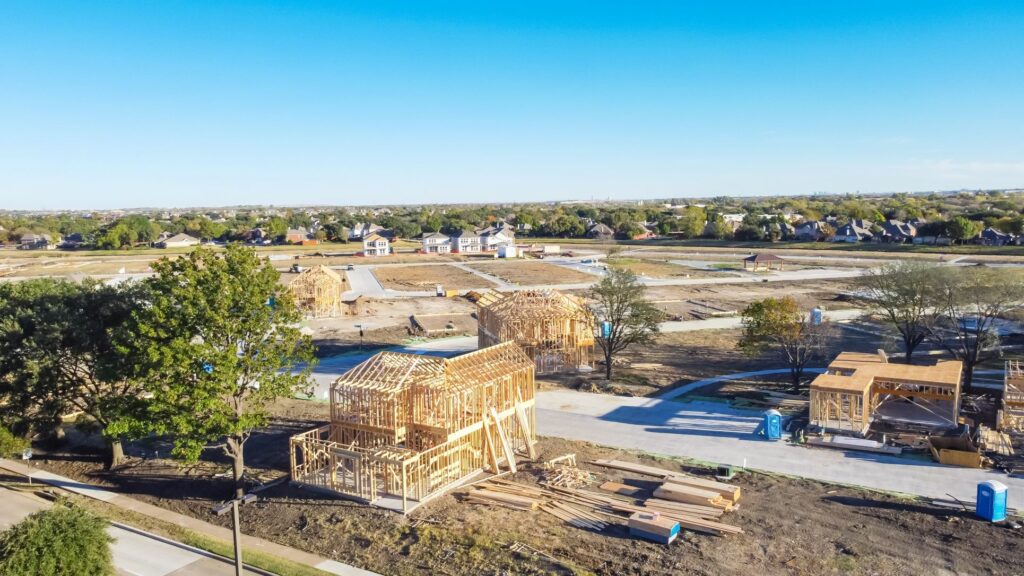
Florida Swimming Pool Construction Report – June 2022

A review of new swimming pool permit data added to the HBW database for Florida during the month of June

In Florida, there were 2,430 new swimming pool construction permits with a total construction value of nearly $161 million added to the HBW database last month.  Out of the five major regions reviewed (Southwest, Tampa, Orlando, Southeast, Jacksonville), the southwest ranked #1 for greatest volume of new pool construction activity (748 permits), while the highest average value of construction could be found in the Jacksonville area (average value: $81,033).

Here is a closer look at new swimming pool construction permits by area, along with average value of construction and leading counties during the month of June:

Southwest

In the Southwest, there were 748 new swimming pool construction permits with a total value of more than $48.2 million last month.  The average value of new pool construction was $64,452, and more than half of all new permits originated from the two counties of Lee (267 permits) and Collier (132 permits).

Southeast

Last month, the southeastern region of Florida ranked #2 for new pool construction, having 565 new permits with a total construction value in excess of $32.5 million on record with HBW.  The average value of new swimming pool construction was lowest in the southeast (average value: $57,551) in comparison to other Florida regions reviewed, and more than half of all new permits originated from the two counties of Palm Beach (187 permits) and Miami-Dade (144 permits).

Tampa

In Tampa, there were more than 485 new swimming pool construction permits with a total value of nearly $36.4 million during the month of June.  The average value of new pool construction landed on the higher end of the spectrum (average value: $74,889) in comparison to other regions reviewed, and the majority of new construction activity took place in the two counties of Hillsborough (152 permits) and Pasco (94 permits).

Orlando

Last month, there were more than 400 new swimming pool construction permits with a total value of nearly $25.2 million added to the HBW database for Orlando.  The average value of construction landed on the lower end of the spectrum (average value: $62,640) in comparison to other regions reviewed, and more than half of all new permits originated from the two counties of Orange (140 permits) and Brevard (87 permits).

Jacksonville

In Jacksonville, there were approximately 230 new swimming pool construction permits with a total value in excess of $18.5 million on record with HBW last month. As previously noted, the average value of construction was highest in Jacksonville (average value: $81,033) in comparison to other Florida regions reviewed, and the county with the greatest concentration of new pool construction activity for the month was St. Johns County (105 permits).

To gain more information on the builders, homeowners and permits for the construction activity above, check out HBW for your copy of the latest construction data reports. To gain access to the HBW database and receive custom and detailed reports on the latest residential and commercial building activity in Florida, Georgia, Texas, Alabama, and Oklahoma, please contact HBW for details.

Texas Quarterly Review: Residential Construction Q2-2022

A review of permit data for new home construction in Texas from January through June this year

Since the start of this year (through June 2022), new home construction appears to be on a slight rise in the Lone Star State.  Based on the latest data available from HBW’s Building Activity Trend Reports, there has been a two percent year-over-year increase in new residential construction from the combined metro areas of Dallas, Houston, Austin, and San Antonio, resulting in 51,690 new permits added to the HBW database for the 6-month period. While there has been an overall increase in new home construction statewide, not all areas are ahead of last year’s figures; while San Antonio and Houston have exhibited year-over-year increases of 45 percent and 2 percent respectively, Dallas (-2% decrease) and Austin (-9% decrease) are exhibiting slower markets so far this year.

Here is a closer look each metro area, total permits, and the leading counties for new home construction through Q2-2022:

Houston

If you have been following the HBW blog, then it shouldn’t be surprising to know that Houston continues to carry a higher volume of new home construction month after month.  Since the start of this year (through June), there have been more than 22,000 new permits added to the HBW database for the Houston area, reflecting a 2 percent year-over-year increase in new residential construction.  Out of the five counties that make up the area, Harris County (9,551 permits) carried the greatest concentration of new home construction activity, while the highest percentage of growth could be found in Brazoria County (1,932 permits) where there has been more than a 57 percent year-over-year increase in new permits.

Dallas

While Dallas and surrounding areas ranked #2 for new residential construction activity (17,573 permits) through the second quarter of this year, the area has exhibited a slower market in comparison to the same time last year as there has been a 2 percent year-over-year decrease in new permitting activity.  Out of the six counties that make up the Dallas area, more than half of all new residential construction activity took place in the counties of Tarrant (4,814 permits) and Collin (4,896 permits).

Austin

In Austin, there were 6,835 new residential construction permits on record with HBW through Q2-2022, reflecting a 9 percent year-over-year decrease in new home construction.  Out of the four counties reviewed, Travis County (3,440 permits) and Williamson County (2,757 permits) carried the majority of new home construction activity for the 6-month period.

San Antonio

Through the second quarter of this year, there have been 5,272 new residential construction permits added to the HBW database for the San Antonio area, reflecting an impressive 45 percent year-over-year increase in new home construction.  Out of the three counties reviewed, Bexar and Guadalupe both reflected year-over-year increases in new permits of 111 percent and 71 percent respectively, and the bulk of all new home construction in the San Antonio area took place in Bexar County (3,191 permits).

To gain more information on the builders, homeowners and permits for the construction activity above, check out HBW for your copy of the latest construction data reports. To gain access to the HBW database and receive custom and detailed reports on the latest residential and commercial building activity in Florida, Georgia, Texas, Alabama, and Oklahoma, please contact HBW for details.

HBW Report: Texas Residential Construction – June 2022

A review of permit data for new residential construction in the Lone Star State during the month of June

Earlier this week, we reviewed the latest HBW construction data reports to highlight swimming pool construction activity in Texas during the month of June; today, we have gathered new construction data reports for the purpose of reviewing residential construction activity in Texas.

Based on the latest HBW reports, there were approximately 7,220 new residential construction permits with a total value of nearly $2.1 billion in the Lone Star State last month.  Out of the four major metro areas that were included in the report (Houston, Dallas, San Antonio, Austin), Dallas ranked #1 for new home construction (3,049 permits), while the highest average value of new home construction could be found in Austin (average value: $335,436)

Here is a look at the new residential construction permit data on record with HBW for each of the four major metro areas in Texas during the month of June 2022:

Dallas

As noted above, Dallas ranked #1 for new home construction last month, having approximately 3,050 new permits with a total construction value in excess of $980.6 million. The average value of new home construction landed on the higher end of the spectrum (average value: $321,615) in relation to the other areas reviewed, and more than half of all new home construction activity took place in the two counties of Collin (941 permits) and Tarrant (672 permits).

Houston

Not far behind Dallas, the Houston area ranked #2 for new home construction last month, having 2,914 new permits with a total construction value in excess of $741.3 million. The average value of new residential construction projects was $254,406, and the bulk of all new permits originated from the two counties of Harris (1,283 permits) and Montgomery (737 permits).

Austin

In Austin, there were more than 690 new residential construction permits with a total value of approximately $232 million on record last month. The average value of new home construction was highest in the Austin area (average value: $335,436) in comparison to other Texas regions reviewed, and nearly all permits originated from the two counties of Travis (285 permits) and Williamson (268 permits).

San Antonio

Last month, there were approximately 565 new residential construction permits with a total value of nearly $134.2 million on record for San Antonio.  The average value of new home construction was lowest in San Antonio (average value: $238,301) in comparison to other Texas regions reviewed, and more than half of all new permits originated from the County of Bexar (354 permits).

To gain more information on the builders, homeowners and permits for the construction activity above, check out HBW for your copy of the latest construction data reports. To gain access to the HBW database and receive custom and detailed reports on the latest residential and commercial building activity in Florida, Georgia, Texas, Alabama, and Oklahoma, please contact HBW for details.
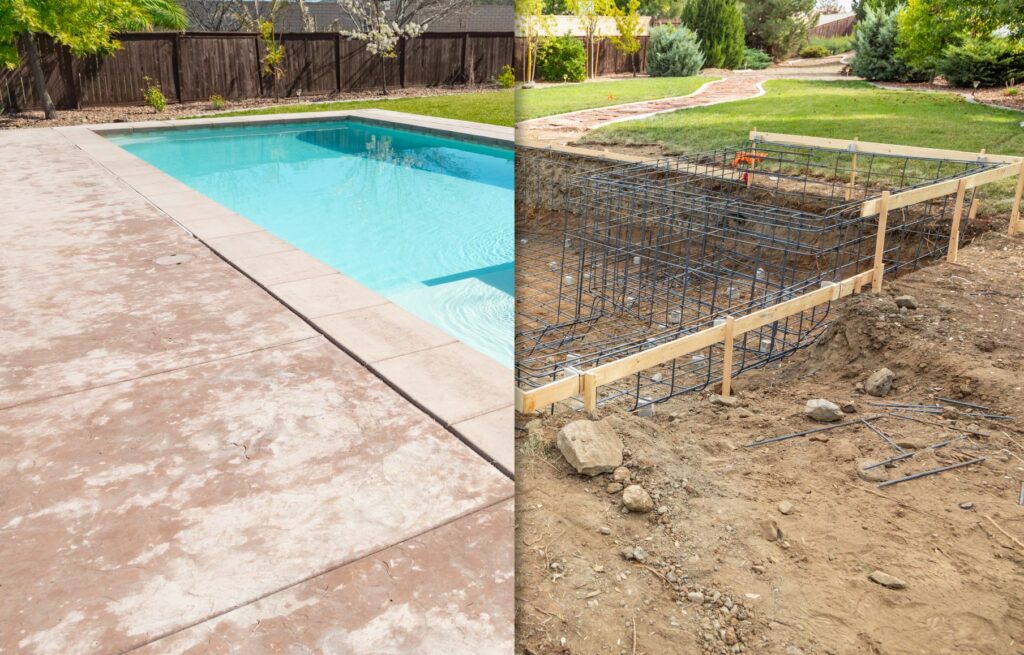
Texas Swimming Pool Construction Update – June 2022

An update on the latest permit data for new swimming pool construction in Texas during the month of June

Last month, there were 1,115 new swimming pool permits added to the HBW database from the combined Texas metro areas of Dallas, Houston, Austin, and San Antonio.  Out of the four areas reviewed, Dallas ranked #1 for total new permits (571 permits) on record, while Houston held the highest average value of new swimming pool construction (average value: $73,994).

Here is a closer look at the new swimming pool construction permit data in Texas, by metro area, for the month of June 2022:

Dallas

As previously mentioned, Dallas had the greatest amount of new pool construction activity last month; there were approximately 215 active pool builders on record that were responsible for more than 570 new permits with a total construction value of nearly $30.7 million.  The majority of new permits originated from the counties of Collin (172 permits) and Dallas (131 permits), and the average value of construction was lowest in Dallas (average value: $53,713) in comparison to other Texas metro areas reviewed.

Houston

The Houston area ranked second for swimming pool construction last month having 300 new permits with a total construction value of approximately $22.2 million.  There were 150 active pool builders with new permits on record from the Houston area during the one-month period. The average value of new pool construction was higher than any other region reviewed at $73,994, and more than half of all new construction took place in Harris County (177 permits). 

Austin

In Austin, there were approximately 85 active contractors on record last month that generated 150 new swimming pool construction permits with a total value of nearly $8.7 million. The majority of new construction took place in Travis County (107 permits), and the average value of construction was $57,652.

San Antonio

Last month, there were more than 40 active builders in the San Antonio area that generated 94 new swimming pool construction permits with a total value of approximately $5.2 million. Most of the new construction took place in Bexar County (72 permits), and the average value of construction was $55,368.

To gain more information on the builders, homeowners and permits for the construction activity above, check out HBW for your copy of the latest construction data reports. To gain access to the HBW database and receive custom and detailed reports on the latest residential and commercial building activity in Florida, Georgia, Texas, Alabama, and Oklahoma, please contact HBW for details.

Atlanta Residential Construction Quarterly Review: Q2-2022

A review of permit data for new residential construction in the Metro Atlanta area from January through June 2022

New residential construction in the Metro Atlanta area has continued to remain slower this year in comparison to last year.  Through the second quarter of 2022, there has been a 22 percent year-over-year decline in new home construction, resulting in more than 12,700 new permits being added to the HBW database. And while the Metro Atlanta area has experienced a decrease in new residential construction overall, there are a handful of counties that have exhibited growth through June of this year (vs. Q2-2021); those counties are as follows:

  • Cherokee County (1,536 permits; +16 percent)
  • Rockdale County (201 permits; +23 percent)
  • Fayette County (391 permits; +8 percent)
  • Clarke County (126 permits; +8 percent)
  • Carroll County (284 permits; +7 percent)

When using the data derived from the latest HBW Building Activity Trend Reports to identify areas with the highest levels of new residential construction, we found that there are four counties (out of 24 that make up the Metro Atlanta area) that carried approximately 41 percent of all new permits through the second quarter of this year; those counties are as follows:

  • Gwinnett County (1,722 permits)
  • Cherokee County (1,536 permits)
  • Fulton County (992 permits)
  • Cobb County (958 permits)

In addition to the leading counties listed above, there were several other notable Metro Atlanta counties that carried a higher volume of new residential construction activity through Q2-2022; those counties include but are not limited to: Henry County (838 permits); Forsyth County (822 permits); Hall County (685 permits).

Information utilized for the above listed figures for Metro Atlanta residential construction was directly derived from HBW construction data reports. To gain access to the HBW database and receive custom and detailed reports on the latest residential and commercial building activity in Florida, Georgia, Texas, Alabama, and Oklahoma, please contact HBW for details.

Safety Alert: Record-Breaking Heat

With summer temperatures continuing to rise, now is the time to put heat safety practices in place on the job

There is no denying that temperatures over the last month have been rising to dangerous levels. Record highs are challenging construction workers and contractors all over the country, and summer has just begun.  In June, San Antonio had 17 days of triple digit heat, and the norm is two days.  Additionally, multiple cities in Texas experienced an onslaught of 100-degree days in June amid extreme droughts.

While heat is expected during summer months, excessive heat puts workers and crews at high risk for heat stroke, exhaustion, and dehydration.  According to OSHA, thousands of workers become ill every year due to extreme heat conditions, and construction workers comprised 36% of all heat-related deaths on the job over a recent 25-year period (source: Safety & Health Magazine).  For this reason, it is critical for contractors to adopt safety precautions to protect workers, as well as review business owners’ responsibilities as they pertain to the safety and protection of their crews.

So, where do you get started on heat safety?  A good place to begin is OSHA’s webpage for their “Water. Rest. Shade.” campaign.  Through the campaign, OSHA aims to educate employers and their workers about the dangers of working in high heat conditions, as well as provide tools and resources to stay safe during the hot summer months. 

Want more? Here is a quick list of highlights and links to set in you in the safe and right direction:

OSHA-NIOSH Heat Safety Tool App – The OSHA-NIOSH Heat Safety Tool is useful for planning outdoor work activities based on how hot it feels throughout the day. It features a real-time heat index and hourly forecasts, specific to your location, as well as occupational safety and health recommendations from OSHA and NIOSH.

NIOSH Heat Stress PodcastProtect Yourself from Heat Stress. After you have downloaded the printable materials to post and share with your team, you can also listen to this useful podcast to learn how to identify the symptoms and protect yourself from heat stress.

OSHA Fact Sheet: Protecting Workers from the Effects of Heat – While this fact sheet has been published for some time now, it still serves as a great go-to for breaking down easy preventative measures you can take, as well as guidelines for strengthening your heat safety plan and procedures.

Education – From training guides to printable posters, OSHA has a variety of publications that are free to download and share with your team.  Training modules are available in English and Spanish.  Some examples of the most updated data sheets include the following:

  • Prevent Heat Illness at Work: OSHA Alert

(OSHA 3975 – 2021) (English: PDF)    (OSHA 4067 – 2021) (Spanish: PDF)

  • Heat Illness: Prevent Heat Illness at Work Pamphlet

(OSHA 4135 – 2021) (English: PDF)     (OSHA 4135 – 2021) (Spanish: PDF)

  • Heat Illness: Prevent Heat Illness at Work Poster

(OSHA 3431 – 2021) (English: PDF)     (OSHA 3432 – 2021) (Spanish: PDF)

Beyond protecting your own team, you can always join the safety movement to help others.  As an industry leader, you can use your power on social media to spread the word about safety and demonstrate your company’s commitment to protecting workers from the dangers associated with high heat conditions.  Consider using #WaterRestShade to be part of OSHA’s latest campaign tweets and empower others by sharing the actions your company takes to protect workers from heat illness.

For more information on construction industry trends and business tips, stay connected with the HBW Blog.  To get ahead of construction activity and gain access to the latest permitting data in Florida, Texas, Georgia, Alabama and Oklahoma, contact HBW for more information on construction data reports and industry leads.