Texas Top Home Builders – February 2016

D.R. Horton led new residential construction in Texas last month, with nearly 700 new permits added to the HBW database.

tx hbw reports

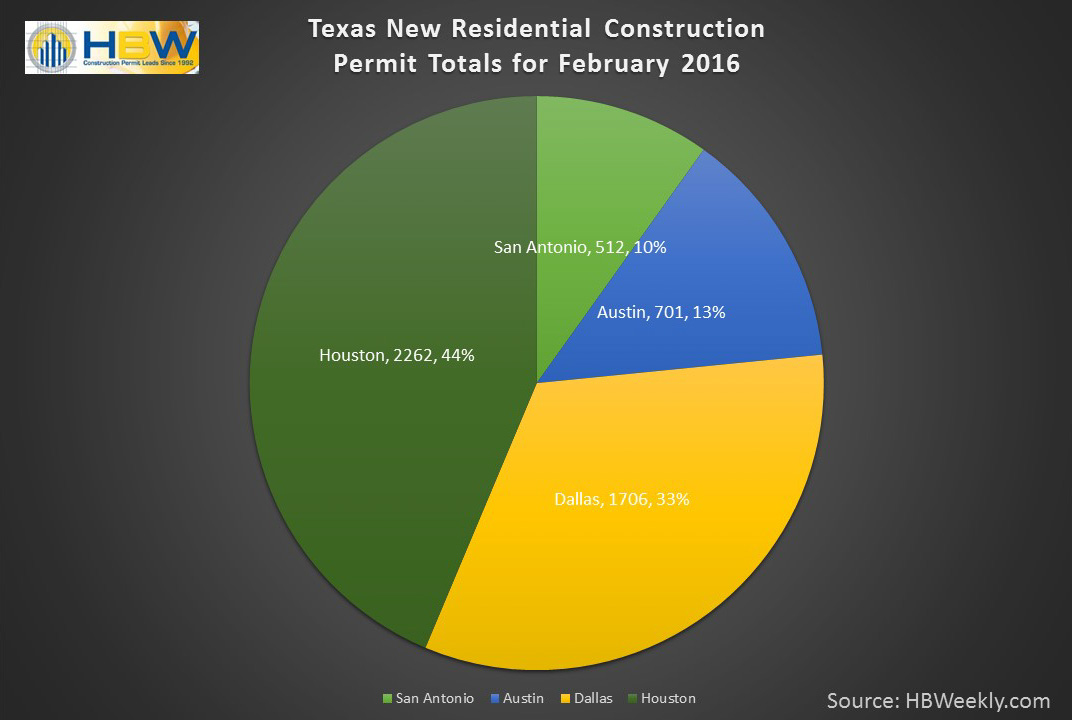
Earlier this month, we reviewed the top counties and areas in Texas that were booming in new residential construction last month.  With approximately 5,100 housing starts on file in Austin, Houston, Dallas and San Antonio combined, we took a deeper look to identify the leading companies that drove residential construction in each area.  Across the Lone Star State, and including the areas listed above, there were three companies that added the most new residential permits to the HBW database in February.  The top three companies for total housing starts are as follows:

#1. D.R. Horton

#2. Lennar Homes

#3. Pulte Homes

D.R. Horton was the leading company in three out of four of our focus areas, with 689 housing starts in February.  Lennar Homes followed in the second spot with 280 new permits for the month, while Pulte Homes was third highest with 204 housing starts throughout the state.

Although D.R. Horton took the top spot statewide for the month, there are a number of prominent builders in each major metropolitan area.  The top five builders in each area are as follow:

Dallas

As may be expected, D.R. Horton led Dallas in new residential construction last month.  Having 273 housing starts on file and a total construction value of nearly $62 million, the company took a major lead in the area.  In the second highest spot, Pulte Homes had 87 new residential construction permits for the month and a total value in excess of $17.5 million.  Not far behind, Darling Homes came in at #3 with 71 housing starts and a total construction value close to $28.6 million.

Dallas Top 5 Builders - Feb. 2016

Dallas Top 5 Home Builders – Feb. 2016

Austin

D.R. Horton also held a significant lead on housing starts in Austin.  With a total construction value of nearly $16.8 million, the company had 102 new residential construction permits on file for the month.  KB Homes was also active in Austin last month, with 60 housing starts and a total value of more than $9.7 million.  With the highest average value of the top three builders in the area, Pulte Homes held in at #3 with 42 starts and a total construction value of nearly $10 million.

Austin Top 5 Home Builders - Feb. 2016

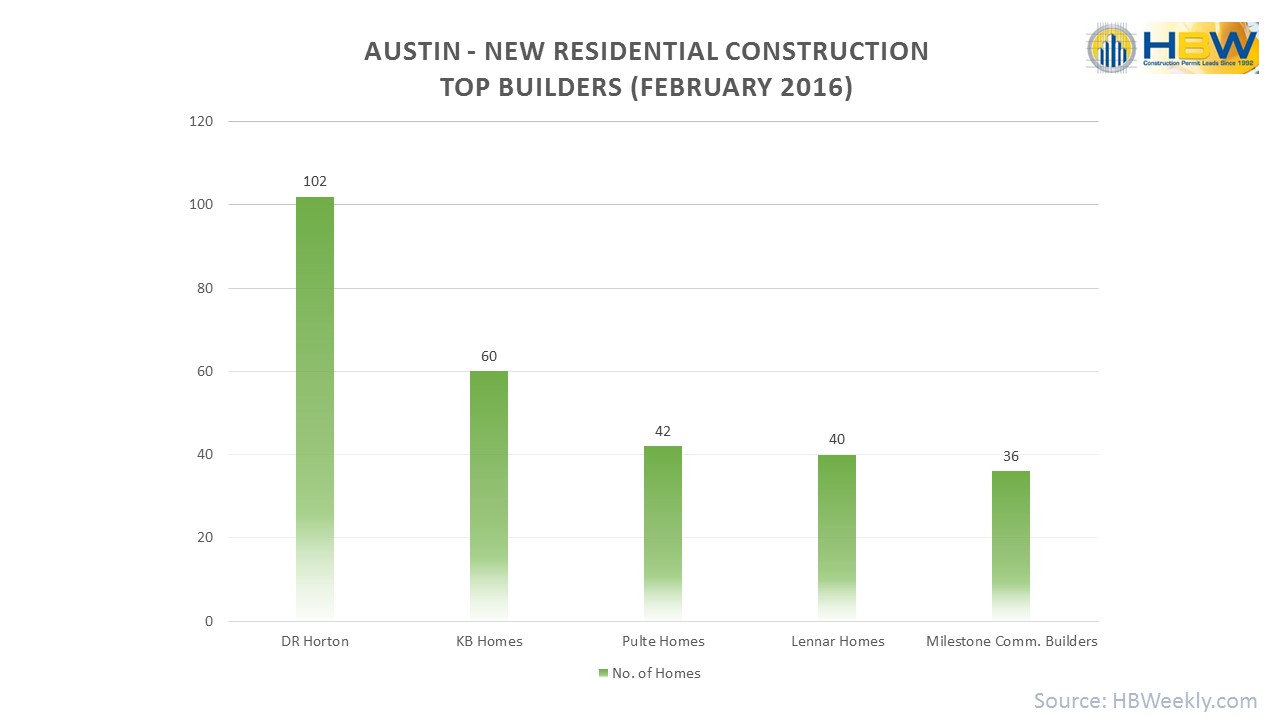
Austin Top 5 Home Builders – Feb. 2016

Houston

D.R. Horton flourished in Houston last month with 314 housing starts and a total construction value in excess of $43 million.  Lennar Homes was also active in the area with 148 housing starts for the month and a construction value of nearly $23.7 million.  Although in third, Perry Homes held the highest average residential construction value out of the top five in the area with 143 starts and close to $31 million in total value.

Houston Top 5 Home Builders - Feb. 2016

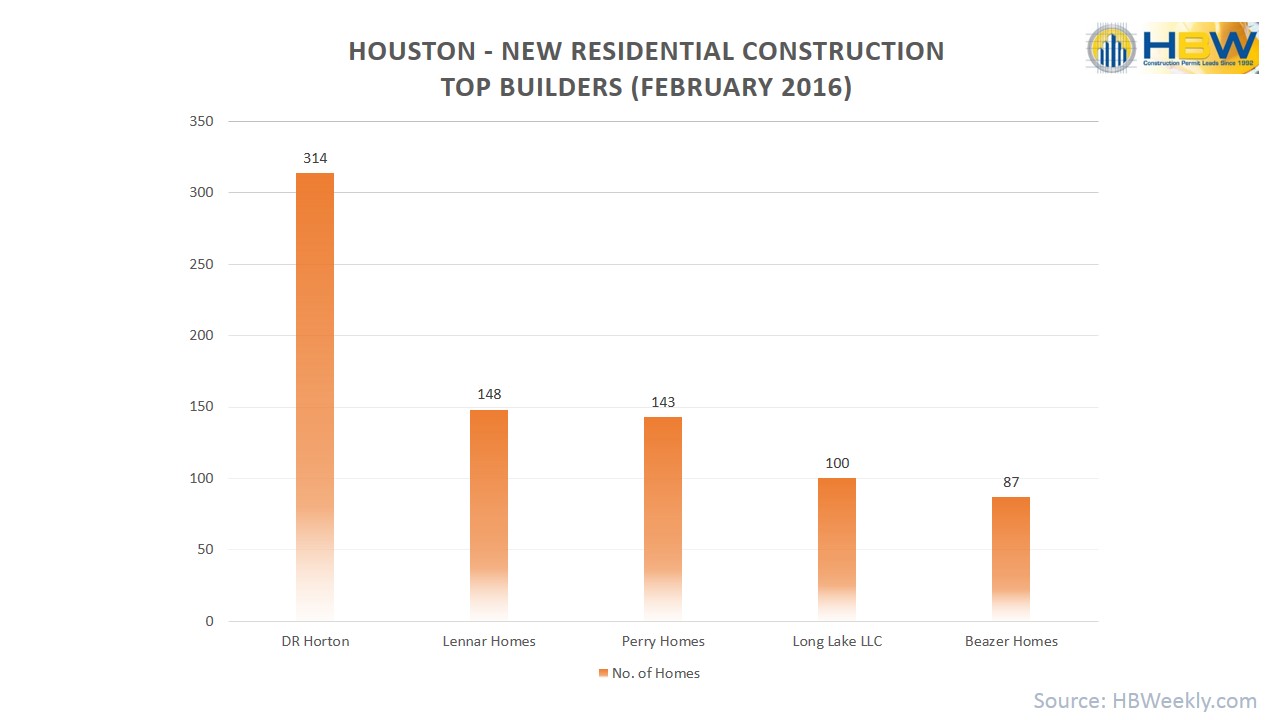
Houston Top 5 Home Builders – Feb. 2016

San Antonio

In San Antonio, another leader emerged in residential construction… Continental Homes was responsible for just over 15% of new residential construction in the area last month.  Taking the #1 spot, Continental Homes had 79 housing starts and a total construction value of nearly $17 million.  At the second highest spot for new residential construction, KB Homes had 29 starts and a total construction value just under $5.9 million. Close on the heels of KB Homes, Lennar Homes had 25 new residential construction permits on file last month and a total construction value of more than $6.7 million.

San Antonio Top 5 Home Builders - Feb. 2016

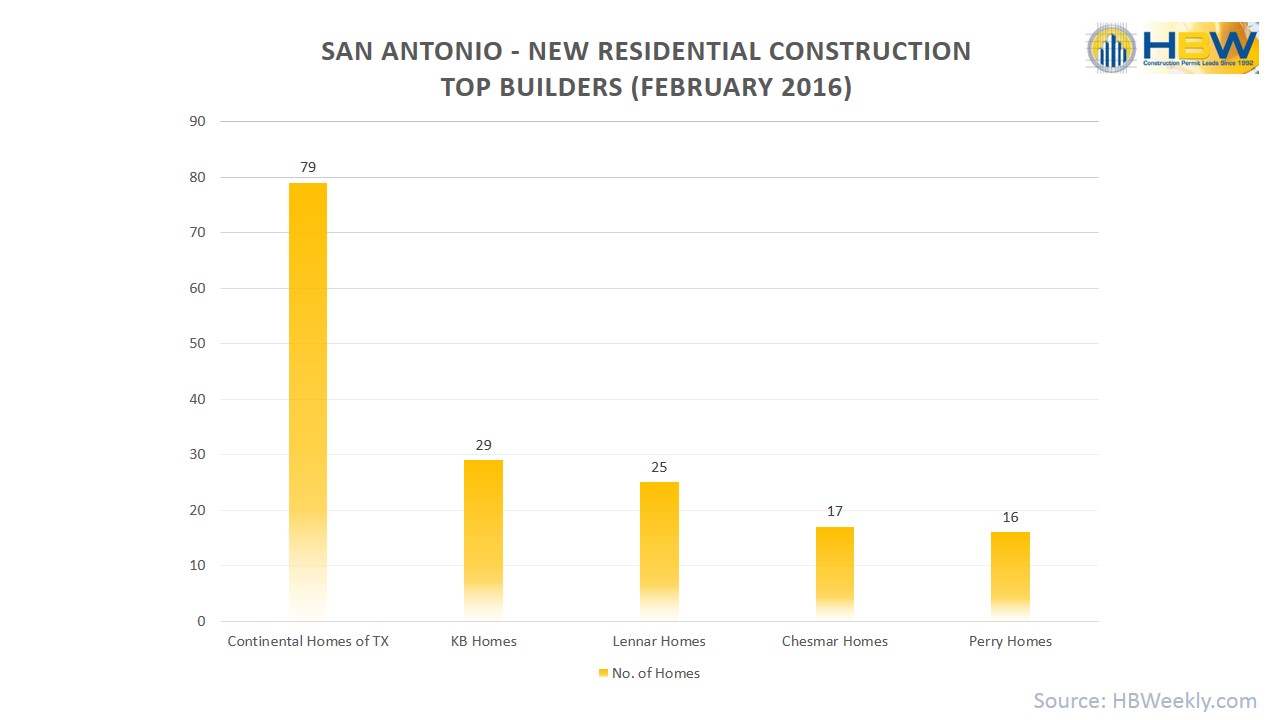
San Antonio Top 5 Home Builders – Feb. 2016

Information utilized for the graphs and above listed figures was directly derived from HBW builder data reports. To gain access to the HBW database and receive custom and detailed reports on the latest building activity in Texas and beyond, please contact HBW for details.

Planning for the National Safety Stand-Down

Workplace Injury Facts

Workplace Injury Facts

As a construction professional, you already know that safety is of the utmost importance in the industry.  From the onboarding process with new crew members to safety guidelines and policies, keeping crews and clients safe on the job should be an integral part of every new project plan.  In 2014 alone, OSHA reported nearly 4,700 worker fatalities on the job, and out of private industry worker fatalities, approximately 20% were in construction (source:OSHA).  What was the leading cause of these fatalities? The answer: Falls.  According to OSHA, Falls are the #1 cause of worker fatalities.  With such daunting figures, it is no wonder that OSHA dedicates one week each year to the National Safety Stand-Down (May 2-6, 2016).

Although your company may have all safety measures fine-tuned and in place, OSHA’s National Safety Stand-Down is a great way to refresh crews on Fall Protection (and other safety guidelines), as well as inform clients and the public of the safety measures you take on a daily basis to protect your workers.  The ultimate goal of the week is to educate and reach 5 million workers nationwide with tools and knowledge on fall protection and prevention.  Each year, construction contractors and other industry professionals take part in educating workers and the community to help reduce risk and falls on the job.

Here are a few ideas and resources that you can use to plan your participation in the National Safety Stand-Down in May:

  1. Hold a Seminar – Along with teaching and refreshing your own crews, consider offering a free and open workshop to the public. This would allow you to maximize your reach and show the community that you care about worker safety and the industry as a whole.  Focusing on fall protection, the seminar can be as simple as a workshop on your property or as elaborate as a presentation at a community center or public hall.  For larger events, consider a corporate partner or co-sponsor to help spread the word and build public awareness.
  2. Make it Social – Get in on the safety buzz in social networks. Share OSHA’s videos, or create your own video to post on YouTube, emphasizing the importance of fall protection. You can also easily share some of OSHA’s fact sheets (see below) or guidelines, as well as use hashtags such as #StopFalls, #OSHA and #StandDown4Safety in your posts and tweets.
Fall Prevention Fact Sheet by OSHA.gov

Fall Prevention Fact Sheet by OSHA.gov

  1. Toolbox Talks – In addition to your planned staff and crew meetings, you may want to schedule a toolbox talk for one or all days of the Safety Stand-Down. Offering refreshers on fall protection on one day could be coupled with another day covering fall hazards and prevention.
  2. Conduct Inspections – Along with toolbox talks, make the week of May 2nd-6th a time where you conduct random site and/or equipment inspections. You can inform your crews or conduct impromptu on-the-job inspections that are designed to educate rather than intimidate.  Random inspections are a great way to gain insight on strengths and weaknesses in your safety program and compliance.  Equipment inspections can also be useful in working with crews to ensure that all equipment is properly inspected, maintained, and stored before and after use.
  3. Share Your Story – Along with the option of sharing your story or suggestions with OSHA, consider sharing your program with others in the industry. If you have a safety program or toolbox talk that has proven successful, consider presenting it at a local building association meeting or a partnering trade school.  Sharing successful safety programs is a great way to give back to the industry and protect other workers in the future.  Additionally, through a few powerful press releases, you can also use this time to exhibit your expertise in safety as well as make a greater impact in the community.

OSHA offers a variety of resources from videos and worksheets to posters and publications.  It is easy to take part in the National Safety Stand-Down.  Make use of the resources available through OSHA, and keep the momentum going with regular safety check-ins and trainings throughout the year.

For more information on construction business tips and industry updates, stay connected with the HBW Blog.  To get ahead of construction activity and gain access to the latest permitting data in Florida, Texas, Georgia, Alabama and Oklahoma, contact HBW for more information on construction data reports and industry leads.


Top Home Builders in Florida – February 2016

D.R. Horton continues to lead residential construction in Florida with more than 630 housing starts on file for February.

FL BUILDERS2

For those of you who read our Florida Residential Construction Report last week, you are already aware of the 19% increase in housing starts in Florida since January.  With close to 4,800 new Florida residential construction permits added to the HBW database last month, it is a great time to identify and recognize the top builders.  From Orlando, Tampa, Jacksonville, Southwest and Southeast Florida, there were three builders who led the bulk of new residential construction:

#1 –  D.R. Horton

#2 – Lennar Homes

#3 – Pulte Homes

D.R. Horton led new residential construction in Florida for all of 2015, and in February it continued to lead the state with 632 starts.  The company did not just dominate statewide, but when isolating activity by region, D.R. Horton took the #1 spot in four out of 5 of the regions, and was #2 in the southwestern portion of the state.

Coming in at second highest for housing starts, Lennar Homes had 320 new residential permits on file for February.  Lennar was in the top five list in four out of five of the regions (see graphs below), and was #2 in Tampa and Orlando just behind D.R. Horton.  In the #3 spot, Pulte Homes had 292 housing starts in February throughout Florida.  Pulte was most active in the southwestern portion of the state, taking the #1 spot there with 150 permits on file for the month.

With Florida being expansive, there are many builders who are most active in specific regions.  Although they may not make the top three for statewide activity, there are many builders who focus and are successful in their primary areas of service.  For this reason, we used HBW permit reports to gain a closer look at the top builders by region.

Orlando

As previously mentioned, D.R. Horton was #1 for total housing starts in every region aside from the southwest.  In Orlando, D.R. Horton led with 132 new residential permits on file for the month and a total value in excess of $37.6 million.  Lennar Homes was second highest with 75 starts and more than $13.6 million in total value.  Close behind, Meritage Homes took the third spot with 72 starts and nearly $25.9 million in total construction value.

Orlando Top Home Builders - Feb. 2016

Orlando Top 5 Home Builders – Feb. 2016

Southwest FL

Pulte Homes took the #1 spot in SW Florida with 150 housing starts and nearly $36.6 million in total new construction value.  Pulte was most active in three counties for the month: Manatee, Lee and Collier. D.R Horton held second in the SW with 97 new residential construction permits and a total value close to $24.3 million.  Taking #3 for the month, WCI Communities was active with 69 housing starts for the month and a total value in excess of $16.4 million.

SW FL Top 5 Home Builders - Feb. 2016

SW FL Top 5 Home Builders – Feb. 2016

Southeast FL

D.R. Horton had new residential construction activity in nearly every county in the SE with 122 starts on file for the month and nearly $40 million in total construction value.  Galloway Contractors and Builders took #2 in the SE with 87 housing starts and close to $29 million in total value.  In the #3 spot, GL Homes had 60 starts for the month and just under $21.6 million in total value.

SE FL Top 5 Home Builders - Feb. 2016

SE FL Top 5 Home Builders – Feb. 2016

Jacksonville

In Jacksonville, D.R. Horton had a strong hold on the lead with 166 starts for the month and close to $26.2 million in total construction value.  Holding in the second spot for residential construction starts, Dream Finders Construction had 86 new permits for the month and nearly $19.8 million in total value.  Not far behind, Lennar Homes held in at third highest with 84 starts in February and more than $20.5 million in total value.

Jacksonville Top 5 Home Builders - Feb. 2016

Jacksonville Top 5 Home Builders – Feb. 2016

Tampa

The top two builders leading in Tampa had new residential construction taking place in three counties: Hillsborough, Pasco and Polk.  D.R. Horton held the #1 spot for total new permits with 115 starts and more than $27 million in construction value.  Lennar Homes was close behind and held second highest with 96 starts and a total value in excess of $21.4 million.  Coming in at #3, The Villages of Lake Sumter had 68 housing starts for the month and a total value close to $23 million.

Tampa Top 5 Home Builders - Feb. 2016

Tampa Top 5 Home Builders – Feb. 2016

Information utilized for the graphs and above listed figures was directly derived from HBW builder data reports. To gain access to the HBW database and receive custom and detailed reports on the latest building activity in Florida and beyond, please contact HBW for details.

Florida’s Top Counties for Commercial Construction – February 2016

se fl comm. HBW

Spring Break is here, and with Florida being home of the Spring Break capital of the U.S., it is the perfect time to look at commercial construction in the Sunshine State.  Earlier this week, our review of residential construction in Florida showed the state on the upswing since January.  Taking a look at commercial construction last month, there were nearly 330 commercial starts and more than 1,000 alterations (including renovations and additions).  With a new commercial construction value in excess of $1.2 billion and $460M in alterations in February, Florida had various counties seeing the bulk of commercial construction activity for the month.

New Commercial Construction

Using HBW construction data reports, we were able to customize our search for the highest concentration of new commercial construction leads throughout Florida.  In February, Miami-Dade County of South Florida held the #1 spot for highest new commercial construction value ($318.5M), while Orange County (Orlando) was #1 for total commercial starts (44 permits).  When looking at alterations and renovations, the leaders switched as Miami-Dade led for total permits (122), and Orange County led for total value ($77.5M) for the month.

Miami-Dade and Orange County were not the only areas with new commercial starts on file for February.  The area with the second highest total for commercial starts was Hillsborough County (Tampa) with 27 starts and nearly $168.6 million in total construction value.  South Florida held the third and fourth spots for total new commercial construction permits.  Miami-Dade had 24 starts and a total value in excess of $318.5 million, and Palm Beach County also had 24 starts with a total value just over $52.4 million.  Not far behind, Polk County (Tampa) had 23 new commercial construction permits and a total value close to $100.6 million.

FL Top 5 Counties - New Commercial Construction Feb. 2016

FL Top 5 Counties – New Commercial Construction Feb. 2016

Commercial Alterations

As previously mentioned, commercial alterations refer to all alterations, renovations and additions.  In Florida, Miami-Dade County was #1 for total alterations with 122 permits and more than $43.4 million in total value.  Orange County wasn’t far behind with 109 permits and a total value in excess of $77.5 million.  Palm Beach County (SE) came in a close third for alterations with 103 new permits on file in February and a total construction value greater than $48.1 million.  Hillsborough County (Tampa) held the fourth top spot with 101 alterations on file and more than $70.3 million in total construction value.  The northern portion of the state in Jacksonville also had some new commercial activity on file as Duval County had 98 alterations with a value of more than $46.3 million.

FL Top 5 Counties for Commercial Alterations - Feb. 2016

FL Top 5 Counties for Commercial Alterations – Feb. 2016

Information utilized for the graphs and above listed figures was directly derived from HBW builder data reports. To gain access to the HBW database and receive custom and detailed reports on the latest building activity in Florida and beyond, please contact HBW for details.

Florida New Residential Construction Report – February 2016

New residential construction in Florida had a boost last month with a 19% increase in activity in comparison to January.

homebuild increase fl

Florida has gained some forward momentum since the start of the year.  With nearly 4,800 housing starts on file with HBW for the month of February and a total construction value in excess of $1.4 billion, Florida residential construction activity increased last month in all areas from Jacksonville to South Florida.  Although the southwestern portion of the state has led residential permitting totals in recent months, Orlando took the lead last month with an 18% increase in residential construction activity since January.  Orlando held the top spot for total starts and total construction value with 1,162 permits on file for the month and a total value in excess of $356.6 million.

Not far behind, the southwestern region of Florida experienced a 12% increase in residential construction since January, with 1,149 housing starts and a total value greater than $320.6 million.  On the heels of SW Florida, Tampa’s 6% increase in new residential construction activity positioned it in third, with 931 housing starts and more than $251.1 million in total value. Although Jacksonville and SE Florida held fourth and fifth for total permits, both areas experienced the greatest increases in residential construction activity for the month. Jacksonville was up by 38% with 874 permits and a value of more than $206.5 million, and the southeastern region saw a massive 55% increase in activity with 672 new permits and nearly $272.5 million in total construction value.

FL New Residential Construction Permits - Feb. 2016

FL New Residential Construction Permits – Feb. 2016

When looking at the average value of new residential construction in Florida last month, SE Florida stands out on top with an average value of $405k.  Orlando held strong in second with an average construction value of nearly $307k, while SW Florida was third highest with an average value of approximately $279k.

FL Average Residential Construction Value - Feb. 2016

FL Average Residential Construction Value – Feb. 2016

Using HBW reports for a more detailed breakdown of new residential construction in Florida, we are able to identify the counties with the greatest concentration of activity last month.  Areas like Jacksonville that didn’t lead for total starts have counties that are standouts and in the top 3 when compared to counties across the state.  Orange County (Orlando) experienced a 15% increase in activity since January and continued to hold the number one spot with 520 housing starts and a total value of approximately $178.3 million.  St. Johns County in Jacksonville held the second highest for total permits with 334 housing starts (a 25% increase since January) and more than $90.5 million in total value.  Duval County’s (Jacksonville) impressive 42% increase in activity resulted in a jump from #8 to #3 with 310 housing starts and more than $55.2 million in total construction value.  The southwestern portion of Florida took fourth and fifth as Collier County had 298 starts (total value: $121.4M) and Lee County had 293 starts (total value: $72.6M).

FL Top 10 Counties for Permits - Feb. 2016

FL Top 10 Counties for Total Permits – Feb. 2016

Information utilized for the graphs and above listed figures was directly derived from HBW builder data reports. To gain access to the HBW database and receive custom and detailed reports on the latest building activity in Florida and beyond, please contact HBW for details.

Texas Commercial Construction – February 2016

Using the HBW database, we discovered approximately 1,400 new commercial construction projects in Texas.  Here’s the scoop on the top counties for February…

tx.comm-hbweekly

When it comes to commercial construction, Texas is a state to watch.  According to Site Selection magazine, Texas is ranked No. 1 overall based on the number of new and expanded facilities projects constructed in 2015.  HBW subscribers in Texas already know about the nearly 1,400 new commercial projects that started in February throughout the state.  From new construction to alterations (including renovations and additions), county-to-county, more than $1.4 billion in commercial projects started last month.

Using the HBW database to gain detailed insight on where the bulk of commercial construction activity is taking place, Harris County in Houston was a clear winner in both new construction and alterations in February.  From Houston Baptist University’s $60 million expansion to new recreational facilities like a high-end bowling alley (CityCentre) and Nike’s Golf Performance Center at Bluejack National Resort, Houston has quite an array of newsworthy construction projects that are catching attention.  Just in Harris County, there are more than 500 commercial construction projects and alterations on file for February; in new commercial construction there were 116 starts for the month with a total value of more than $510 million.  Taking second behind Harris County is Bexar County in San Antonio, with 57 new permits and a total construction value in excess of $154.5 million.

The Texas County that was third highest in new commercial construction activity is Tarrant County which is located in the Dallas area. Known for its boom in real estate and higher-priced properties, Dallas has its fair share of commercial development.  Some of the latest construction projects highlighted in the Dallas Business Journal recently include Equinix’s awaited unveiling of a new $20 million data center in Legacy Business Park, and new redevelopment projects like that of the Lorenzo Hotel.  In February, 45 new commercial permits in Tarrant County were added to the HBW database with a total construction value of nearly $224 million.


TX Top 5 Counties - New Commercial Construction Feb. 2016

Texas Top 5 Counties – New Commercial Construction Feb. 2016

Commercial alterations led the bulk of commercial construction activity in Texas last month, and Harris County in Houston took the #1 spot again with 393 permits and a total value of nearly $254 million.  Two counties in Dallas (Dallas and Tarrant) held the second and third spots for commercial construction alterations.  Dallas County has 180 commercial alterations on file and a total construction value above $66.4 million, while Tarrant County has 106 permits on file for alterations in February and a total value of nearly $69 million.  Here’s a look at how the top five counties stacked up in total commercial construction alterations for the month:

Texas Top 5 Counties - Commercial Alterations Feb. 2016

Texas Top 5 Counties – Commercial Alterations Feb. 2016

Information utilized for the graphs and above listed figures was directly derived from HBW builder data reports. To gain access to the HBW database and receive custom and detailed reports on the latest building activity in Texas and beyond, please contact HBW for details.

HBW Report: Texas Residential Construction – February 2016

Permit totals from February have been tallied, and housing starts in Texas increased by 18% in comparison to January.

tx

Late last month, Realtor.com revealed its top 20 hottest U.S. real estate markets for February 2016, and Dallas, Texas was in the #3 spot out of 20 U.S. cities.  Dallas continued its upward climb in the HBW database in February as well, along with Houston for residential construction.  From Dallas, Houston, Austin and San Antonio, there were more than 5,100 housing starts on file for the month, with a total construction value in excess of $1.2 million.

The area with the greatest total number of permits for February was Houston, with 2,262 housing starts and approximately $420 million in total value – a 15% increase since January.  As previously mentioned, Dallas continues to rise since the start of the year.  Last month, there were 1,706 new residential permits on file for Dallas which is a 21% increase in comparison to January; additionally, Dallas held the highest total construction value for the month with more than $544 million in residential construction.

Experiencing the greatest increase since January, San Antonio’s residential construction activity was up by a whopping 80% with 512 housing starts and a total construction value close to $112.8 million.  The only area that we reviewed in Texas that experienced a slight decline (-5%) in residential construction permits was Austin.  According to the latest from the HBW database, there were 701 new residential permits in Austin for February and a total construction value in excess of $171.1 million.

Texas Residential Construction Permits - February 2016

Texas Residential Construction Permits – February 2016

Since January, there were a few shifts in position in the top 5 counties for the month.  Harris County (Houston) continued its lead in the #1 spot for total housing starts in February.  Harris was remarkably steady and consistent with 1,050 starts for the month and a total construction value of $191.5 million.  Jumping up one spot to the second highest for total permits, Fort Bend (Houston) had 594 new residential construction permits and a total value greater than $97.2 million.  Although up by 8% since January, Collin County (Dallas) dropped one spot to #3 for the month with 522 housing starts and the second highest total construction value of nearly $169.3 million.  Tarrant County (Dallas) moved up one spot since January and was fourth highest for total permits in February, with 499 housing starts and more than $128.7 million in total construction value.  Travis County (Austin) slipped back one spot to #5 with 367 total permits and a monthly construction value of more than $89.1 million).

Texas Top 5 Counties for Total Permits - February 2016

Texas Top 5 Counties for Total Permits – February 2016

Monthly summaries are intended to provide the latest on lead information available through HBW’s construction data reports and services.  Construction fluctuations in any given area on a monthly basis are normal and expected.  For a comprehensive understanding of residential construction patterns based on permitting activity, check out the HBW Blog’s Quarterly Reports and Year-End Reviews.

Information utilized for the graphs and above listed figures was directly derived from HBW builder data reports. To gain access to the HBW database and receive custom and detailed reports on the latest building activity in Texas and beyond, please contact HBW for details.

Industry Update: AIA Reports Top Nonresidential Design Trends

AIA surveyed leading architects, and the results revealed that efficiency and sustainability are at the top of the list for the construction process and lifespan of buildings.

Sust.Bldg - HBW

According to its most recent Semi-Annual Consensus Construction Forecast, AIA (American Institute of Architects) reports a projected increase in construction spending by more than 8% in 2016.  The report is based on projections provided by the nation’s leading construction forecasters including Dodge Data & Analytics, IHS Economics, FMI, Associated Builders and Contractors, and Wells Fargo Securities to name a few.

Another area in construction expected to see growth is that of sustainability. Last month, AIA published a press release revealing results from a recently conducted survey of leading architects.  The survey was designed to gain a clearer perspective and understanding of how nonresidential building design is expected to evolve over the next 10 years. As new technologies continue to develop at an unprecedented pace, it is no surprise that the survey indicates renewable energy and innovations in technology as a driving force behind the changes to come.

The AIA report stated that the following nonresidential design trends will become increasingly more popular as sustainability continues to be an area of focus:

  • Water conservation
  • Solar power
  • Wind power generation
  • Natural “day-lighting” techniques
  • Smart/motion-sensor lighting systems


According to the report and architects surveyed, a number of innovative materials and tools will also gain more use and attention; some of the materials and methods expected to increase in use in nonresidential construction over the next 10 years include:

  • Composites
  • New glass/glazing technologies
  • BIM (Building Information Modeling) software
  • Alternative and efficient project delivery methods
  • Lean construction practices


Although green design and sustainability are not new concepts in construction, the report indicates that the focus on efficient construction and design will continue to expand and strengthen in the industry.  This growth will be driven by the increased need and demand for projects that have less impact on the environment through both design and energy-saving methods and technologies.  Ultimately, leaner processes and energy efficient designs are desired by building owners because along with saving energy, sustainable designs can also offer savings for the budget in the long-term.

To remain current on the latest construction business tips and industry updates, stay connected with the HBW Blog.  For access to detailed construction activity and permitting data in Florida, Texas, Georgia, Alabama and Oklahoma, contact HBW for more information.

Drone Use for Home Builders

Aerial photos are a great way to showcase your latest project, but if you are going to use drones, be aware of the potential liability.

HBWeekly.com drone use

Drone use is becoming increasingly more popular, and according to the FAA, the number of drones flying the U.S. skies could reach as high as 30,000 by the year 2020.  Along with increased popularity, drones are becoming more of a liability with various risks and associated penalties.  The power of high-quality images and videos in marketing for home builders is undeniable.  An aerial video tour or panoramic view of a new roof, finished pool, landscaping project or home can be a major asset in selling to potential customers and building a portfolio.  As tempting as it may be to buy a drone and begin documenting your latest designs, take a moment to pause and consider the implications of drone use.

According to the FAA, a drone is classified as an “Unmanned Aircraft System”.  What does this mean to you?  Basically, all aircraft systems must be registered, so in order to use a drone owned by you or your business, you must register it as required by Federal law.  Although there was initially a grace period for unregistered drones late last year, as of February 19, 2016, all small unmanned aircraft owners must register their aircraft if they wish to continue to operate outdoors. Registration is easy and only requires a nominal fee ($5).  Skipping the registration process can result in much higher fines and regulatory and criminal sanctions. Civil penalties can be as high as $27,500, and criminal penalties can reach $250,000 and/or imprisonment for up to three years.  Bottom line: Register your drone.  Currently, commercial use of drones is a paper-based registration process, but the forms can be accessed online; the system for commercial drones is expected to transition to web-based later in the year.

Along with registration, how and where you operate your drone is important.  Before taking flight, consider the following:

  • Airports – If your project involves an airport or is within 5 miles of one, contact the airport and control tower before flying your drone.
  • Privacy – When covering residential projects, make sure to keep the drone on your project only. Flying over other homes, backyards or other properties puts you at risk for privacy issues.  Check and follow all local laws and ordinances prior to flying over private property. If in a gated community, make sure to check their regulations (if any) as well. You may also refer to AMA’s (Academy of Model Aeronautics) privacy policy as a guide.
  • Visual – It is suggested that drones fly below 400 feet. Always keep the aircraft in line of sight, and take note and stay clear of any potential obstacles prior to flying.
  • Identification and Insurance – Ensure the drone is properly marked and easily identifiable. If flying outdoors, include the name and address or AMA number of the owner on the inside or outside of the aircraft. Also, check with your insurance provider to see what may be covered and if you need to add additional levels of insurance to your policy.
  • No Fly Zone – Know where you can and cannot fly. In addition to airports, do not fly your drone near people, stadiums, or sensitive public facilities (power plants, correctional facilities, high-traffic roadways, sewage plants, government buildings).
  • Ability – Whether you or a staff member will be operating the drone, make sure they are trained and have practiced controlling the device, including take-off and landing. Just as you would when operating any vehicle, take care and stay in control.  Irresponsible or reckless use can result in fines for endangering people or other aircraft.

Laws governing the use of drones are in development as the technology is new. If you are contemplating using drones on your job site, it is advisable to seek legal advice from an attorney to ensure that you are aware of potential issues and operate your drone in a manner that limits liability. To learn more about drone safety and guidelines, check out “Know Before You Fly”.  “Know Before You Fly” is an educational program resulting from a partnership with the FAA and founded by the Association for Unmanned Vehicle Systems International (AUVSI), and the Academy of Model Aeronautics (AMA).

For more information on construction business tips and industry updates, stay connected with the HBW Blog.  To get ahead of construction activity and gain access to the latest permitting data in Florida, Texas, Georgia, Alabama and Oklahoma, contact HBW for more information on construction data reports and industry leads.

HBW Report: Texas Swimming Pool Construction – January 2016

More than 450 new swimming pool permits were added to the HBW database in January, and Dallas is leading the way.

HBW report pls-TX

Looking for the latest on swimming pool construction in Texas? Texas is holding steady for the start of the year as swimming pool construction for January remained consistent with December’s figures.  When reviewing Dallas, Austin, Houston and San Antonio, more than 450 new swimming pool permits with approximately $23.2 million in construction value were added to the HBW database in January alone.  Leading construction activity as usual, Dallas continues to hold steady having a slight 2% increase in activity since December and 264 new permits (total value: $11.3 million+).

Another area that saw a slight increase since December is Houston.  The area experienced close to a 7% increase in pool construction activity, with 98 new permits and a total construction value in excess of $6 million on file for January.  On the other hand, Austin was slightly down since December (6% decrease) with 51 pool starts and a total construction value close to $3.6 million.  Approximately 89% of all new pool permits in Austin were out of Travis County.  Although fourth for total permits, San Antonio saw a spike of 10% in pool construction activity with 42 starts and more than $2.3 million in total value.

Texas Pool Permits by Area - January 2016

Texas New Pool Permits by Area – January 2016

From a county-by-county perspective, there were some slight shifts in the top five since December.  Not surprisingly, Dallas counties were leading and holding the top three positions.  Just as in December, Collin County in Dallas held the #1 spot for the month; with a 20% increase in pool construction activity, Collin had 124 permits with more than $5.6 million in total value added to the HBW database.  Another area with an increase since December is Tarrant County (Dallas); Tarrant experienced a 30% increase in pool construction since December, moving it from #3 to the #2 spot in January.  Tarrant had 70 pool starts and more than $2.5 million in total construction value.

Dropping from second in December to the third spot this month, Dallas County had 55 pool starts with a total construction value in excess of $2.7 million.  Moving outside of Dallas for the fourth and fifth spots, we travel to Houston and Austin. Stepping up from #5 in December, Harris County (Houston) was the fourth highest for total pool permits; in January, Harris had 50 pool starts with a total value greater than $3.4 million.  Slipping back one spot to #5 is Travis County in Austin.  Travis had 45 new pool construction permits with a total value close to $2.8 million on file for the month.

Top 5 Counties for Pool Construction - January 2016

Texas Top 5 Counties for Pool Construction – January 2016

Information utilized for the graphs and above listed figures was directly derived from HBW builder data reports. To gain access to the HBW database and receive custom and detailed reports on the latest building activity in Texas and beyond, please contact HBW for details.