Florida Residential Construction Quarterly Review

A review of new residential construction permits in the HBW database for Florida through Q3-2018

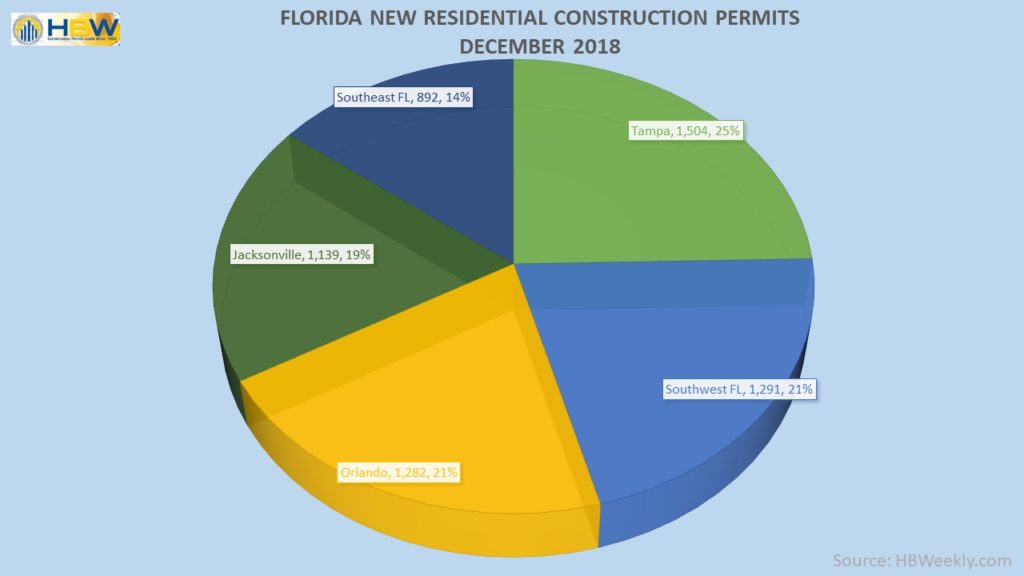
New residential construction in Florida has been on a consistent climb for the past three years, and through the third quarter of this year, the pattern remains the same as the Sunshine State continues its annual climb with a 14% year-over-year increase in housing starts so far this year.  Through the third quarter, there have been more than 62,800 housing started throughout the six major regions reviewed (Central, West, Southeast, Southwest, Northeast and Northwest), and every area is reflecting healthy growth.

The area with the greatest total number of new residential construction permits on file for the 9-month period is West Florida.  Having experienced a 7% year-over-year increase in housing starts through Q3, there have been more than 13,050 new permits added to the HBW database for the area.

Next in line is the southwest region which ranked second highest for total housing starts through Q3.  New residential construction in Southwest Florida has reflected growth every year for the last five years, and this year is no exception.  Through the third quarter of this year, the southwest has experienced a noteworthy year-over-year increase of 21% in housing starts, resulting in more than 11,880 new permits added to the HBW database.

Looking at Central Florida which has had significant increases in new home construction for the last four years, housing starts have continued to increase, but the rate of growth appears to be slowing.  Since 2015, Central Florida has experienced annual increases ranging from 11% to 25%.  So far this year (thru Q3), the area is ahead of last year’s figures by a smaller margin (2%).  While slower, residential permits are still growing in the area each year, and through the third quarter of this year, there are already more than 11,500 new residential construction permits on file with HBW.

In the northeastern region of Florida, new home construction has been experiencing remarkable growth year after year, and the area is ranked #1 for rate of growth in housing starts so far this year.  Through Q3, there has been a 26% year-over-year increase in new residential construction permits in the northeast, resulting in more than 10,800 housing starts.  Additionally, the area is on track for surpassing permit totals for higher value construction (total value > $500k) by the end of this year.

When looking to the northwestern portion of the state, residential construction has been on the rise annually since 2015.  Through the third quarter of this year, the northwest reflects a 16% year-over-year increase in housing starts which resulted in approximately 8,160 new residential construction permits for the given period.

Another area that has been exemplary in growth is the southeast region.  Through Q3, the southeast is already ahead of last year by 22%, resulting in approximately 7,400 new residential construction permits on file.  It is also an area that is on our radar for higher value construction (construction value >$500k) and on target for surpassing higher value starts from last year.

To gain more information on the builders, homeowners and permits for the construction activity above, check out HBW for your copy of the latest construction data reports. To gain access to the HBW database and receive custom and detailed reports on the latest residential and commercial building activity in Florida, Georgia, Texas, Alabama, and Oklahoma, please contact HBW for details.

New Swimming Pool Construction is on a High in Texas

HBW Quarterly Report covering the latest on new pool construction permits in Texas through Q3-2018

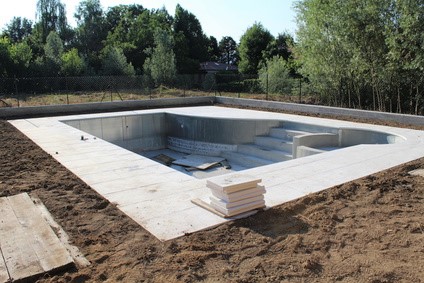
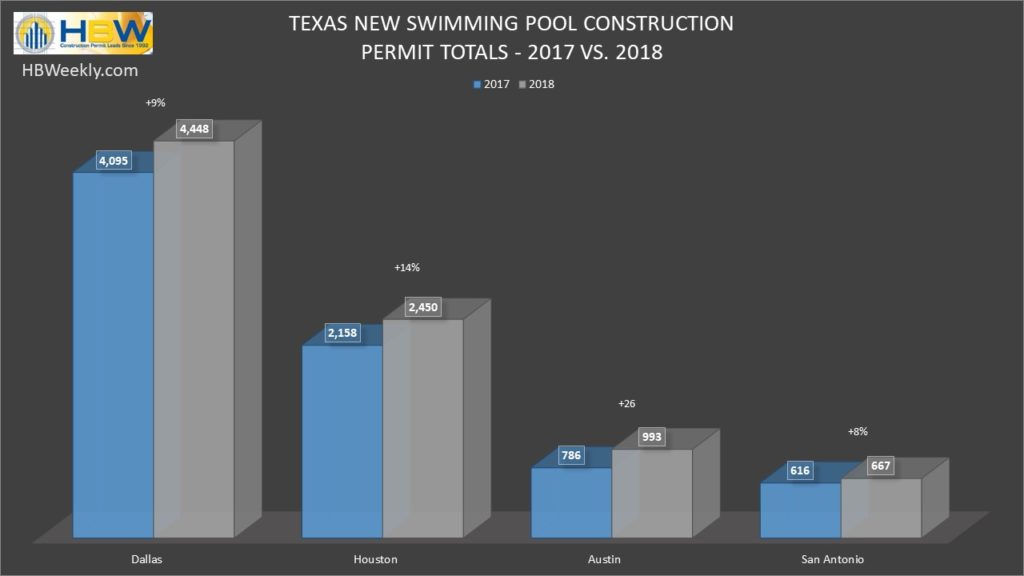
After three years of a slow decline in pool construction in Texas, it looks like pool starts are on the rise.  Through the third quarter of this year, the four major metro areas of Texas (Dallas, Houston, Austin, San Antonio) have experienced a combined year-over-year increase of 8% in pool starts, resulting in 6,560 new swimming pool permits on file with HBW.  Out of the four major metro areas reviewed, Austin has experienced the greatest boost in new pools, having a 24% year-over-year increase and approximately 720 new permits on file through the third quarter.  As far as the greatest total number of permits is concerned, Dallas landed on top.  Having experienced a 5% increase in swimming pool construction in comparison to last year, there were just about 3,385 new permits on file for Dallas so far this year.

While San Antonio had the lowest total number of swimming pool starts on file through Q3-2018, the area reflects significant gains in new pool construction.  Since the start of this year (thru September), there has been a 14% year-over-year increase in San Antonio pool construction, resulting in 540 permits for the 9-month period.

Another area worth noting when it comes to new swimming pools is Houston.  Over the last three years, swimming pool construction has been steadily declining, and as of the latest Q3 reports, that pattern has taken a turn for the better.  Through September of this year, Houston has experienced its first gains in pool construction since 2014.  With a 7% year-over-year increase, there were nearly 1,920 swimming pool starts in the Houston area through the third quarter of this year, and most of the new construction took place in Harris County (1,134 permits, +11%).

When looking at construction patterns from a county-by-county perspective, Harris County wasn’t the only one to make its mark.  In the Austin area, Travis County is ahead of last year’s figures by 25%; having 550 swimming pool starts through the third quarter, the majority of Austin’s new pool construction is taking place in Travis County.  In the Dallas area, the counties of Tarrant and Dallas are also ahead of last year.  Both areas are already displaying a 13% year-over-year increase in new pool permits having 880 permits and 782 permits on file with HBW respectively.

To gain more information on the pool builders and permits for the construction activity above, check out HBW for your copy of the latest construction data reports. To gain access to the HBW database and receive custom and detailed reports on the latest residential and commercial building activity in Florida, Georgia, Texas, Alabama, and Oklahoma, please contact HBW for details.
Texas Residential Construction Quarterly Report

A review of Texas residential construction permitting activity from January through September 2018.

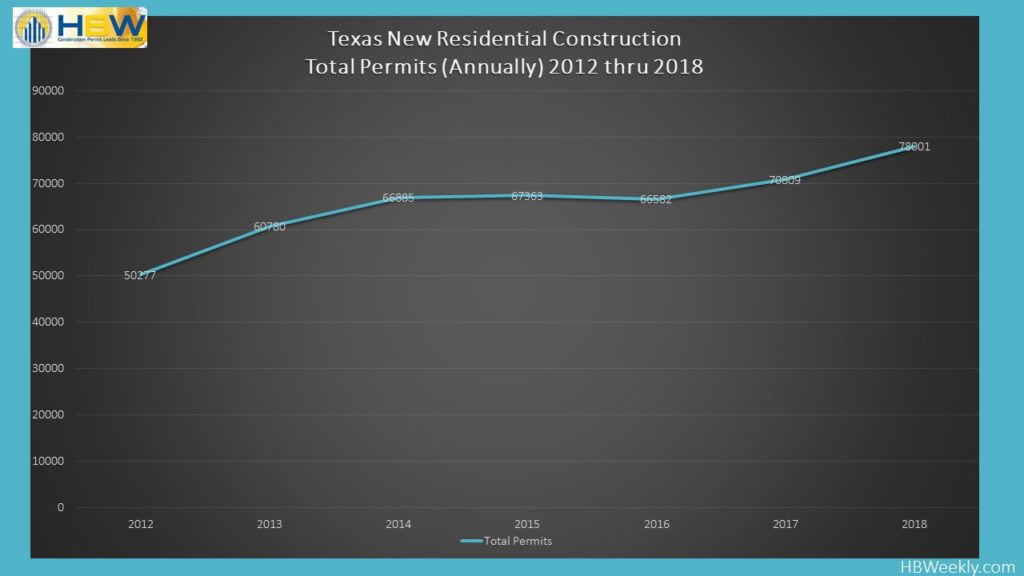
New residential construction is climbing in Texas – Since the start of this year (thru September), there has been a 10% year-over-year increase in housing starts, resulting in nearly 60,000 new residential construction permits being added to the HBW database.  All major metro areas (Dallas, Houston, Austin, San Antonio) are having a better year than last year when it comes to new home construction.  Leading the way for growth is Dallas with a 12% year-over-year increase in new residential construction starts which resulted in more than 20,700 new permits through Q3.

Houston was not far behind in growth; with a 9% year-over-year increase in new home construction, Houston stands out with the highest total number of housing starts for the 9-month period (24,534 permits).  The Houston-area county of Montgomery has been showing great potential over the last two years, exhibiting more than a 30% year-over-year increase in residential construction through the third quarter of this year.  When looking at higher concentrations of new construction activity, Harris County is a standout; more than half of all new permits originate from Harris, and so far this year the county has experienced more than a 6% year-over-year increase in housing starts, resulting in nearly 12,700 housing starts.

Next in line for both growth and total permits is Austin.  With an 8% year-over-year increase in housing starts, there were approximately 8,950 new residential construction permits on file for Austin through Q3-2018.  More than half of all new construction took place in Travis County (5,409 permits), while the greatest year-over-year increase in housing starts could be found in Williamson County (+15%).

Finally, we reviewed the permitting activity for San Antonio.  While the total number of housing starts is lower in San Antonio than other areas reviewed, San Antonio has experienced a notable increase in residential construction activity.  In comparison to last year, the area has experienced a 6% increase in new home construction, resulting in more than 5,700 new permits added to the HBW database.  The majority of housing starts took place in Bexar County (3,042 permits) where there was nearly a 25% year-over-year increase in new permitting activity across the county.

When reviewing higher value construction (greater than $500k), Dallas continues to be a leader as there have already been approximately 1,750 higher value housing starts in the area through Q3.  At this rate, the Dallas area is tracking to be just ahead of last year’s figures.  Houston is ranked second for total higher value permits having more than 820 higher value starts through the third quarter of this year, landing it ahead of last year in this value bracket as well.

To gain more information on the builders, homeowners and permits for the construction activity above, check out HBW for your copy of the latest construction data reports. To gain access to the HBW database and receive custom and detailed reports on the latest residential and commercial building activity in Florida, Georgia, Texas, Alabama, and Oklahoma, please contact HBW for details.
Atlanta Residential Construction Holds Steady through Q3-2018

HBW Quarterly Report – Building Activity Trend Report for New Residential Construction in Atlanta through Q3-2018

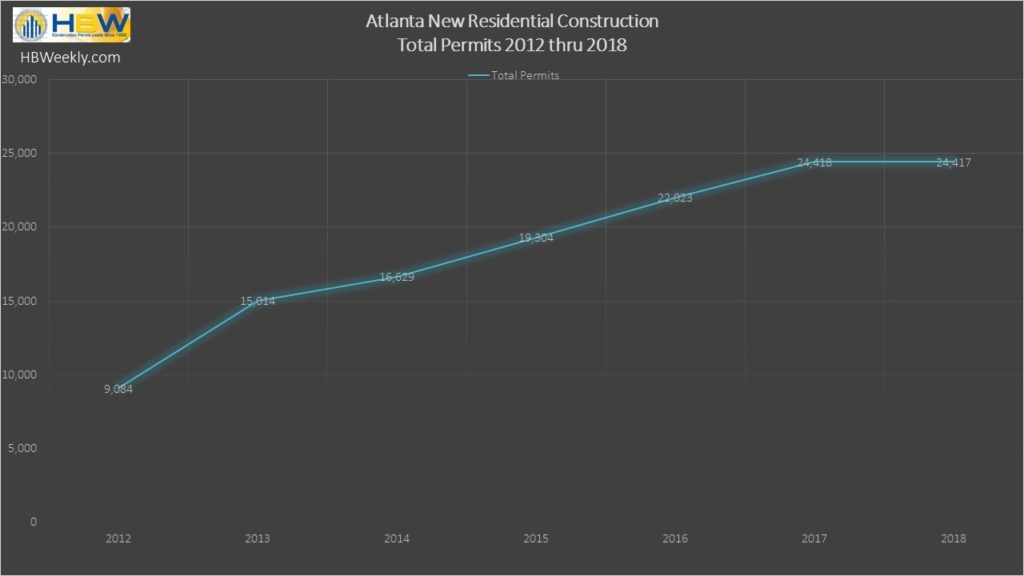
New residential construction through the third quarter of this year in the Metro Atlanta area is almost mirroring last year’s pattern.  From January through September of 2018, there have been approximately 18,550 housing starts, with the second quarter of the year holding the greatest amount of new construction activity (Q2 – 6,794 permits).  While the total number of starts is nearly on course with last year’s totals, certain counties are showing significant changes in construction patterns.  For example, Cobb County appears to be continuing its two-year growth pattern; in 2016, housing starts were up by 64%, and in 2017, the area had a 21% year-over-year boost in new home construction.  So far this year (through Q3), Cobb County is already exhibiting a 20% year-over-year increase in residential construction permits resulting in nearly 1,700 housing starts for the 9-month period.

Another county that has noteworthy activity in the residential market is Henry.  Located just about 28 miles South of the City of Atlanta, Henry County is the 8th most populated county in Georgia (source: Census.gov).  Over the last five years, annual increases in new residential construction have ranged from 17% to 50%.  So far this year, the area has experienced a 9% year-over-year increase in housing starts resulting in approximately 1,220 new residential construction permits added to the HBW database.

As far as higher concentrations of new permits are concerned, Gwinnett County ranked #1 through Q3 having 2,750 housing starts on file, reflecting a year-over-year decrease of 6%.  Next in line, Forsyth County ranked second highest for total permits through the third quarter of this year.  Currently on track with last year’s figures, Forsyth is holding steady in new home construction having approximately 1,930 housing starts so far this year (thru Q3-2018).

Other areas that had noticeable changes in construction patterns include the counties of Dekalb and Clayton.  Through Q3, Dekalb has exhibited a year-over-year decrease of 38% in new home construction that resulted in 870 new permits, a stark contrast to the four-year growth pattern that has been on record for the area since 2014.  While Clayton County broke its growth pattern in 2017 with an 11% drop in new home construction, this year the area has experienced an even greater drop in housing starts.  With a whopping 72% year-over-year decrease in residential construction permitting activity, Clayton is having a slow year to say the least.

When reviewing higher value construction (home value > $500k), Fulton County ranks #1 for total higher value housing starts so far this year.  Out of the 1,877 new residential construction permits in Fulton (thru Q3-2018), 14% (260 permits) of them were for higher value properties; at this rate, the area is expected to exceed last year’s figures by a small margin.

Information utilized for the above listed figures for metro Atlanta residential construction was directly derived from HBW construction data reports. To gain access to the HBW database and receive custom and detailed reports on the latest residential and commercial building activity in Florida, Georgia, Texas, Alabama, and Oklahoma, please contact HBW for details.
Atlanta Swimming Pool Construction Quarterly Update

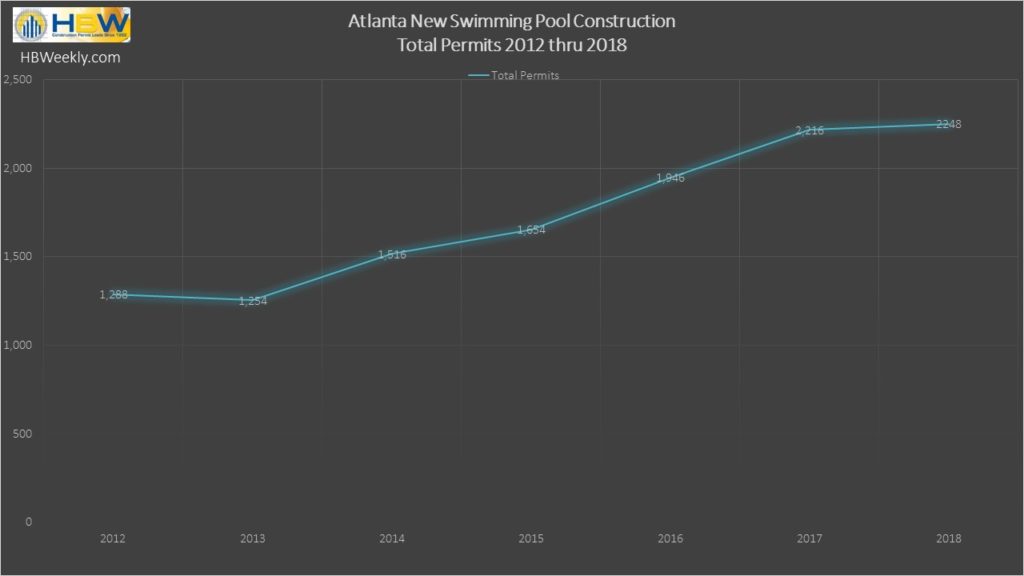
Based on the latest swimming pool permit reports available for Atlanta, new swimming pool construction appears to be reaching a plateau this year.

When we think of taking a dip, we think of pools, and new pool construction in Atlanta has taken just that… a dip in its annual growth pattern.  While new swimming pools have been on the rise in the Metro Atlanta area for nearly five years, this year shows signs of it slowing down.  Through the third quarter of this year, new pool construction is just about neck and neck with last year, resulting in 1,768 new pool permits added to the HBW database; although there isn’t a significant difference in new construction from last year, it has certainly slowed in comparison to the 14%-18% annual increases occurring in recent years.

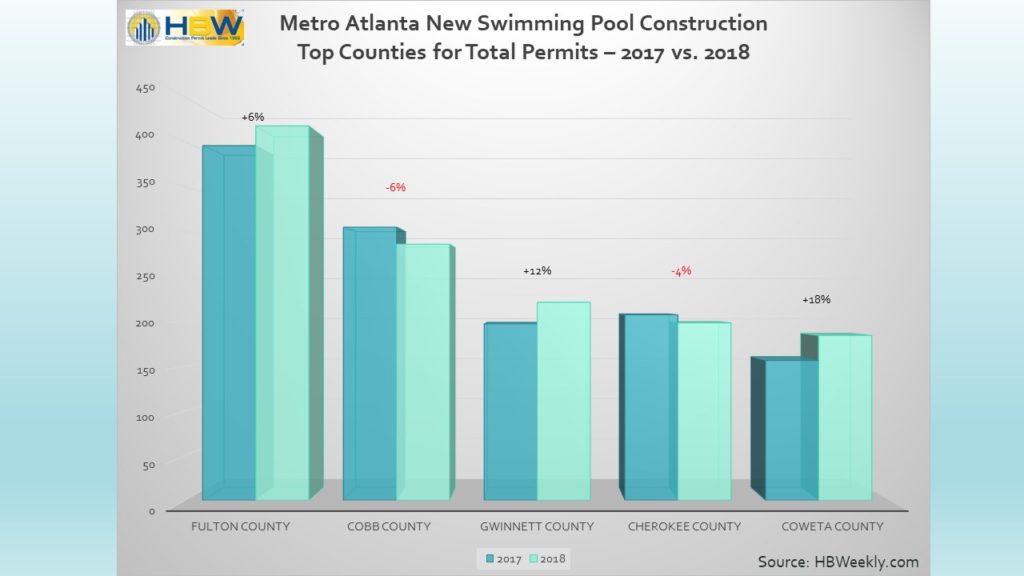
When taking a closer look at HBW’s Construction Activity Trend Report, the counties that hold the greatest concentration of new pool permits include: Fulton County (324 permits, +3%); Cobb County (238 permits, -3%); Cherokee County (162 permits, +1%).  In contrast, other counties in the Metro Atlanta area have experienced significant dips in new pool construction… While Forsyth County has reflected marked annual increases in pool starts as high as 42% in the last five years, this year pool construction in the area has experienced a considerable year-over-year decrease of 26%.

In favor of construction picking up before the end of the year, there are a handful of counties that are exhibiting consistent and high rates of growth in pool construction.  Counties including Walton, Paulding and Jackson have been on the lower side of the permit totals but on the higher side when it comes to identifiable growth patterns.  The County of Walton appears to be leaping out of its lull in pool construction having already experienced a 95% year-over-year increase in pool starts, and the counties of Paulding and Jackson are already ahead of last year’s figures by 30% and 33% respectively.

With just three short months remaining in 2018 and the popular season for pool construction being behind us, there is still enough time for new pool construction to pick up, but the probability is low.  This year may just be a plateau year for pool starts in the Atlanta area; that being stated, there are still plenty of new permits to peruse and use in the HBW database before the next batch and new totals come in during Q4.

To gain more information on the builders, homeowners and permits for the construction activity above, check out HBW for your copy of the latest construction data reports. To gain access to the HBW database and receive custom and detailed reports on the latest residential and commercial building activity in Florida, Georgia, Texas, Alabama, and Oklahoma, please contact HBW for details.
Making Productivity a Priority

Five tips for increasing your team’s productivity

There is no doubt that you are busy.  “Busy” has become the state of our work and personal lives, and thanks to technology, there seems to be no sign of this constant state of “busyness” stopping in the immediate future.  Unfortunately, being busy does not equate being productive, and often the two separate concepts become interchangeable and true productivity gets lost in shuffle.  In order to clear the haze and get you and your team on a direct path to productivity, here are five simple efforts you can make now to ensure that you are using your time, and team, wisely:

  1. Get on the Schedule – Time and time again, action items that do not get scheduled do not get done. As contractors, getting projects on the schedule is part of the process; after all, there is a contract in place.  While projects are designed to meet certain deadlines, other action items (especially those outside of the normal routine) have a tendency to get delayed if not on a schedule.  If you are not already using task management software, at the very least you should have a task list for tracking actions, assignments and due dates for everything from marketing campaigns to reporting.
  2. Press “Pause” – This one is a tough one for most of us but is truly essential for completing tasks. In order to be fully present and engaged in a project, you must block time aside for certain activities and priorities.  For this reason, you should find time to pause email, phones and devices for a specified period of time; this means that you hold calls and avoid checking your phone for the latest text or email that has come in.  Seems impossible, right? Just give it a try – You will be surprised by how much you can get done in one hour or more of uninterrupted time.  By making an effort to isolate certain time periods for certain tasks, you will be able to tackle projects with 100% effort instead of splitting your attention and energy several ways.
  3. Be Accountable – In order for scheduling (see #1) to be effective, you must hold everyone in your company accountable. If someone is assigned to a particular task and due date, there needs to be follow up or a system for reporting that will hold them accountable.  When a task isn’t completed, it is less often about laziness and more about a lack of system or organization.  Everyone can easily be sidetracked with too many action items, and by having a clear and solid system for reporting and accountability in place, priorities and expectations can be transparent and easily managed.
  4. Set Realistic Goals – It is perfectly acceptable to “dream big”, but when it comes to setting goals, you will want to be sure that they are realistic and attainable. High level goals are important for setting the long-term vision, but to reach them, smaller steps and goals should be in place.  Too often, long-term goals will not be broken down into stages, and this can lead to frustrated, unfocused and unproductive team members.
  5. Give Rewards and Incentives – While a more organized team with schedules and realistic goals will certainly be more productive, incentives will sweeten the deal and make the ride more enjoyable. By rewarding team members and showing your appreciation for their achievements (even the small ones), you can provide the encouragement and positive reinforcement necessary to build team morale and make productivity a habit rather than an effort.


For more information on construction business and marketing tips, stay connected with the HBW Blog.  To get ahead of construction activity and gain access to the latest permitting data in Florida, Texas, Georgia, Alabama and Oklahoma, contact HBW for more information on construction data reports and industry leads.

Top Texas Pool Builders – September 2018

An HBW review of the latest pool permitting data and leading builders throughout Texas during the month of September 2018

In September, the combined Texas metro areas of Dallas, Houston, Austin and San Antonio had more than 680 new swimming pool permits added to the HBW database.  Out of the four major metro areas reviewed, Austin carried the highest average value of new pool construction (average value: $61,517), while Dallas held the lowest average value ($46,312) and the highest volume (358 permits) for the month.

When reviewing the leading pool builders for the one-month period, for the most part companies were specific to each region; that being stated, Cody Pools (Austin and San Antonio) and Anthony & Sylvan Pools (Houston, San Antonio and Austin) had some cross over and were on the leader board in two and three metro areas respectively.

Here is a closer look at the breakdown of new pool construction by area:

Dallas

Total # of Permits: 358 (Highest volume of new permits for the month out of all metro areas)

Average Value of Construction: $ 46,312 (Lowest average value of new pool construction in Texas)

Out of the approximately 140 active builders on file for the month, the following ranked in the top five for total pool starts:

1. Riverbend Pools
2. Gold Medal Pools
3. Foley Custom Pools
4. Venture Custom Pools
5. Claffey Pools Inc.


Houston

Total # of Permits: 181

Average Value of Construction: $ 52,815

Out of the approximately 105 active builders on file for the month, the following ranked in the top five for total pool starts:

1. Anthony & Sylvan Pools
2. Platinum Pools
3. Premier Pools
4. Preferred Pools
5. Horizon Pools


Austin

Total # of Permits: 97

Average Value of Construction: $ 61,517 (*Highest Average Value in Texas)

Out of the approximately 47 active builders on file for the month, the following ranked in the top five for total pool starts:

1. Cody Pools
2. Anthony & Sylvan Pools
3. Texas Pools & Patios
4. Innovative Pools & Spas
5. Trinity Pools & Scapes


San Antonio

Total # of Permits: 45

Average Value of Construction: $ 48,958

Out of the 17 active builders on file for the month, the following ranked in the top five for total pool starts:

1. Keith Zars Pools
2. Cody Pools
3. Blue Haven Pools
4. Gary Pools
5. Anthony & Sylvan Pools

To gain more information on the pool builders and permits for the construction activity above, check out HBW for your copy of the latest construction data reports. To gain access to the HBW database and receive custom and detailed reports on the latest residential and commercial building activity in Florida, Georgia, Texas, Alabama, and Oklahoma, please contact HBW for details.
Dallas Leads Texas in New Residential Construction – September 2018

An HBW review of residential construction permitting activity for the month of September.

During the month of September, Texas experienced an estimated 13% month-over-month decline in housing starts resulting in a total of 5,827 new residential construction permits with a total construction value of nearly $1.5 billion.  All major metro areas reviewed, with the exception of Dallas, experienced decreases ranging from 19% to (Austin) to 24% (San Antonio) in residential permitting activity.

Dallas was seemingly immune to the monthly drop as it experienced a 3% month-over-month increase in residential construction.  The Dallas area ranked #1 for both total housing starts (2,436 permits) and average value of construction (average value: $302,592).  On the flip side, San Antonio experienced the most significant month-over-month decline (-24%) in new home construction, landing it at the lowest end of the spectrum for both housing starts (421 permits) and average value of construction (average value: $198,418).

When taking a look at the home builders leading the area, D.R. Horton continued its long-term reign in Texas as it ranked #1 for total new permits in Dallas, Houston and Austin.  In San Antonio, Fieldstone Communities took top spot holding just about 10% of all new permits in the area for the month.

Here are the stats on new residential construction in the four major metro areas of Texas last month:

Dallas* (#1 for total housing starts and average value of construction):

Total permits: 2,436 (+3% | month-over-month increase)

Total Construction Value: ~ $737M

Average Value of Construction: $302,592

Top County(s) for Total New Permits: Collin (753 permits); Tarrant (706 permits)

Houston (#2 for total housing starts)

Total permits: 2,171 (-22% | month-over-month decrease)

Total Construction Value: ~ $450M

Average Value of Construction: $207,306

Top County(s) for Total New Permits: Harris (1,183 permits)

Austin

Total permits: 799 (-19% | month-over-month decrease)

Total Construction Value: ~ $198M

Average Value of Construction: $247,687

Top County(s) for Total New Permits: Travis (366 permits); Williamson (318 permits)

San Antonio

Total permits: 421 (-24% | month-over-month decrease)

Total Construction Value: $83.5M

Average Value of Construction: $198,418 (lowest of four metro areas)

Top County(s) for Total New Permits: Bexar (278 permits)

To gain more information on the builders, homeowners and permits for the construction activity above, check out HBW for your copy of the latest construction data reports. To gain access to the HBW database and receive custom and detailed reports on the latest residential and commercial building activity in Florida, Georgia, Texas, Alabama, and Oklahoma, please contact HBW for details.

‘Tis the Season for Holiday Marketing

If you haven’t already set your plans for holiday marketing, then now is the time.  The holiday season is right around the corner, and it is the perfect time to plan your happy holiday wishes to current clients while providing holiday “gifts” and offers that are perfectly wrapped for the season.

According to the Conference Board, Consumer Confidence Index (CCI) figures are at an 18-year high.  In recent months, the CCI increased in September, following a large improvement in August.  Consumers’ assessment of current conditions remains very favorable and is bolstered by a strong economy and healthy job growth. According to Lynn Franco, Director of Economic Indicators at The Conference Board: “The historically high confidence levels should continue to support healthy consumer spending and should be welcome news for retailers as they begin gearing up for the holiday season”. (Source: Conference Board)

With the economy and consumer confidence levels in your favor, you should be gearing up to take advantage of this positive position in the form of holiday marketing strategy.  Here are a few areas to review and sharpen as you plan for the season ahead:

1 – Focus on Social Media – As recently published by Mobile Marketer, social media ranks #1 for holiday ad spending. In the study reviewed, FaceBook was determined to be the most popular social media platform with nearly 42% of SMBs stating that they will primarily spend on the social network (followed by Google – 28%), and more than a third (36.4%) of advertisers will allocate the majority of their holiday ad budgets to social media, followed by email marketing (15.2%).

2- Make Content Count – Generic messages and predictable holiday notices will most likely fade into the background of the many similar announcements that your target audience will receive throughout November and December.  For this reason, your email subscribers and social media followers should receive content that is of value to them and makes them want to share it with others.  Whether it is something truly unique and entertaining or tips and technology that they will find useful, make sure your content matters.  Of course, one-of-a-kind gift ideas, packages and holiday discounts and deals will also be enticing for the holiday shopper.

3 – Make Sharing Easy – Don’t assume that because your email has been “opened” or your social post was scheduled that you have made the most of this opportunity.  Your campaigns must be easy to share, and with a few minor adjustments you can increase the likelihood of expanding your reach. This can be done by adding social share icons to the top of your e-newsletters, encouraging shares and retweets, asking followers to tag friends, and keeping the main message at the front of the post so that it can be quickly and easily viewed.

4 – Be Authentic – With the many automation tools available, it is easy to just let technology handle your campaigns for you, but you should resist the urge.  To be unique, it is important that you add a personal touch, and while automation tools make it easy to keep your accounts active, it will benefit you to be deliberate with your posts, customizing them to your audience and each distinct social network.

5 – Join the Holiday Cheer – From your customers to your suppliers, there are bound to be plenty of holiday conversations and posts being generated that relate to your business.  Join the conversation by sharing others’ posts that can link back to your services, as well as respond to customer feedback and industry conversations; offer your expertise, solutions and packages that will meet their needs long after the holiday season has ended.

For more information on construction business and marketing tips, stay connected with the HBW Blog.  To get ahead of construction activity and gain access to the latest permitting data in Florida, Texas, Georgia, Alabama and Oklahoma, contact HBW for more information on construction data reports and industry leads.

Facing the Labor Shortage

If you are a contractor, construction professional, roofer… really anyone in the trades, then you know that the labor shortage is taking its toll on the construction industry.  How did it get to such a depleted level that it almost seems irreparable?  Well, there are a number of contributing factors that got us to what can feel like a point of no return.

According to a recent report by PBS News, the 1970s and 1980s have much to blame as they were times when trades fell by the wayside and the pursuit of a bachelor’s degree became revered. That was really just the beginning of vocational programs and careers in trade losing their allure and developing a lesser image.  Fast forward a few decades later, and we are left with upcoming generations that have not learned the true value of vocational training and the opportunities it can bring.

According to the National Center for Education Statistics, only 8% of undergraduates are enrolled in certificate programs which tend to be vocationally oriented.  It would seem that now more than ever is a time for a boost in the image of trade occupations, and many company owners that are looking to attract talent are bringing solid facts to the table when rallying for the industry.  It has become a matter of rebranding and getting the word out about the value of vocational training.  The fact is that the U.S. has 30 million jobs that don’t require a bachelor’s degree and pay an average of $55k per year (source: The Georgetown Center). Based on data provided by The Good Jobs Project, nearly half of all the U.S. states have added good jobs in blue-collar industries for workers without bachelor’s degrees since 1991.

So, with all of this solid information on why there should be more individuals seeking careers in construction, what is taking so long to make it happen?  The truth is that we did not get here overnight, and the solution won’t take place that quickly either.  There needs to be a shift in culture, and contractors and business owners will be the ones to propel the industry forward.  In your business, you can make careers in construction more attractive by becoming a desirable workplace with strong compensation and benefits packages to start.  On a broader level, you can begin the work of educating the next workforce in the following ways:

  1. Educate the Community – Share the statistics and resources regarding the value of vocational careers in your social networks and even ads (where appropriate). When running ads for open positions, consider including information about the growing room within the company and industry and mention any additional perks such as paid education, training and/or on the job training.  For tips on recruiting top talent, review our previously published recruiting tips here.
  2. Join the Movement – There are a number of trade associations (ABC, AGC, NRCA, etc.) and industry-related awareness months (National Construction Safety Week) that gain major attention for the industry. By having your company join a special industry day, effort or association event, you build awareness for your company and the achievements that take place within the industry.  Your marketing campaign can get a boost with each event, along with the image of the industry as a whole.
  3. Educate the Worker – In addition to offering training and education on and off the job to your current crews, consider partnering with a local vocational school or creating your own apprenticeship program to provide opportunities for the younger generations. By partnering with a vocational program at a high school and/or offering internships for local trade or vocational certificate programs, you are investing in more than just your potential next hire… you are investing in the future of the industry.

While there isn’t a quick-fix answer to the labor shortage in construction, there are steps that we can begin taking as contractors and business owners that will open the eyes of the next generation to the world of possibilities in construction.

For more information on construction business and marketing tips, stay connected with the HBW Blog.  To get ahead of construction activity and gain access to the latest permitting data in Florida, Texas, Georgia, Alabama and Oklahoma, contact HBW for more information on construction data reports and industry leads.