Florida’s Top Spots for New Home Construction – June 2019

A review of the top three spots in Florida for new residential construction permits during the month of June 2019

In June, more than 5,300 new permits were added to the HBW database for residential construction in Florida.  Out of the five major regions reviewed (Orlando, Tampa, Jacksonville, Southeast, Southwest), three areas came out on top when reviewing total volume of housing starts as they held nearly 70 percent of all new residential construction activity in the state for the month:

  1. Tampa – 1,523 permits
  2. Southwest Florida – 1,119 permits
  3. Orlando – 1,028 permits


Here is a look at the breakdown of new permitting activity for the top three Florida regions in June 2019:

Tampa

The Tampa area ranked #1 for total housing starts, having 1,523 new permits with a total construction value in excess of $429 million.  The average value of new construction was $281,702, and nearly all new permits originated from the counties of Hillsborough (542 permits), Polk (462 permits) and Pasco (305 permits).

Out of the more than 200 active builders with new permits in the area for the one-month period, the following ranked as the top five for total new permits on record with HBW:

Builder Total Permits
Lennar Homes 254
Pulte Homes 92
The Villages of Lake Sumter 79
D.R. Horton 74
M/I Homes 46


Southwest Florida

The Southwest region ranked #2 for total new residential construction permits, having 1,119 permits with a total construction value of approximately $281 million added to the HBW database.  The average value of new construction was $251,107, and nearly half of all new construction took place in Sarasota County (278 permits) and Lee County (263 permits).

Out of the approximately 225 active home builders on file for the month, the following ranked as the top five for total new permits:

Builder Total Permits
Lennar Homes 195
Pulte Homes 138
Neal Communities of SW FL 61
D.R. Horton 59
Taylor Morrison 38


Orlando

During the month of June, the Orlando area gained 1,028 housing starts with a total construction value in excess of $324 million.  The average value of new home construction was highest in Orlando (average value: $315,422) in comparison to other regions reviewed, and nearly half of all new construction activity took place in the counties of Orange (291 permits) and Volusia (202 permits).

Out of the approximately 170 active home builders in the area for the month, the following ranked as the top five for greatest total amount of new permits on file with HBW:

Builder Total Permits
D.R. Horton 123
Lennar Homes 68
Mattamy Homes 51
Ryan Homes 47
Pulte Homes 29


To gain more information on the builders, homeowners and permits for the construction activity above, check out HBW for your copy of the latest construction data reports. To gain access to the HBW database and receive custom and detailed reports on the latest residential and commercial building activity in Florida, Georgia, Texas, Alabama, and Oklahoma, please contact HBW for details.

Texas Quarterly Home Construction Review: Q2-2019

A review of the latest construction permits on record with HBW from January 2019 through June 2019

Since the start of this year, new residential construction in Texas has been off to a slower start than anticipated.  Overall, and in the four major metro areas of Dallas, Houston, Austin and San Antonio, there has been a 5% decrease in housing starts in comparison to the same time last year (Q2-2019).  From January to June of 2019, there have been approximately 36,550 new residential construction permits added to the HBW database for Texas, with more than 40 percent of those permits originating from the Houston area.  While Austin is the only metro area that has exhibited a year-over-year increase in housing starts (+4%), all other metro regions reviewed have experienced notable drops in new home construction ranging from as low as 3 percent (Houston) to as high as 11 percent (Dallas).

Here is a closer look at the details from HBW’s latest building activity trend report for new residential construction in Texas through the second quarter of 2019:

Houston

Houston continues to be a powerhouse metro area when it comes to high volume in new residential construction.  From January to June of this year, there have been approximately 15,635 housing starts in Houston, with more than 2 percent representing higher value properties (construction value in excess of $500k).  While the area has demonstrated a pattern of growth in housing starts since 2017, so far this year new home construction is slower and reflective of a 3 percent decrease in new permits in comparison to the same time last year.  From a county-wide perspective, Harris County is holding steady with last year’s figures and carries more than half of all new permits for the Houston area (8,358 permits).

Dallas

While the Dallas area has exhibited significant annual growth in its housing market year after year since 2015, new residential construction permits are down by 11 percent (compared to 2018) through the second quarter of this year.  Dallas ranks second-highest for volume of new home construction, having approximately 11,590 housing starts on file with HBW. More than 5 percent of all new home construction in the Dallas area represented higher value properties (construction value > $500k), and the majority of all new permits originated from Tarrant County (3,521 permits) and Collin County (2,638 permits).

Austin

Last year, Austin demonstrated healthy growth in new residential construction, and based on figures through the second quarter of this year, its growth pattern has continued.  Through Q2-2019, there have been approximately 6,035 new permits added to the HBW database for the Austin area, reflecting a 4 percent year-over-year increase.  More than half of all new construction took place in Travis County (3,972 permits), where there has been more than a 15 percent increase in new home construction in comparison to the same time last year.

San Antonio

Since the start of this year (through Q2-2019) there have been close to 3,300 housing starts in the San Antonio area, reflecting a 7 percent year-over-year decrease in new home construction from the combined counties of Bexar, Comal and Guadalupe.  In contrast to the overall drop in new residential construction activity, the majority of new home construction took place in Bexar County (~2,100 permits) where there has been more than a 7 percent increase in total residential construction permits in comparison to the same time last year.

To gain more information on the builders, homeowners and permits for the construction activity above, check out HBW for your copy of the latest construction data reports. To gain access to the HBW database and receive custom and detailed reports on the latest residential and commercial building activity in Florida, Georgia, Texas, Alabama, and Oklahoma, please contact HBW for details.
Texas Swimming Pool Construction Quarterly Report

An HBW review of swimming pool construction permit data for Texas through Q2-2019

During the first half of this year, Texas has experienced a healthy dose of new swimming pool construction.  In the four major metro areas of Dallas, Houston, Austin and San Antonio, there has been a combined total of 4,187 swimming pool starts, reflecting a 2 percent year-over-year increase in new pool construction permits on record with HBW.

Out of the four major metro areas reviewed, Dallas ranked #1 for total swimming pool starts (2,135 permits), and the Austin area took the lead for the greatest annual growth with a 19 percent year-over-year increase in new swimming pool permits.

Here is a closer look at the latest new pool construction activity by area from January 2019 through June 2019:

Dallas

It’s no secret that Dallas is a hot housing market, and when it comes to swimming pools, the area continues to grow.  Last year, Dallas experienced a 9 percent annual increase in new pool construction, and this year (Q2-2019) the growth pattern has continued.  Since January (through June), there have been 2,135 pool starts in Dallas, reflecting a 2 percent year-over-year increase.  Nearly half of all new construction took place in the counties of Dallas (518 permits) and Tarrant (512 permits), and the greatest percentage of growth could be found in Denton County (+16%).

Houston

Houston has been consistent to say the least when it comes to new pool construction – Through the second quarter of this year, new swimming pool permits have remained steady and in line with figures from the same time last year.  From January through June 2019, there have been 1,193 new pool permits added to the HBW database for Houston, with the majority of new construction taking place in Harris County (702 permits).

Austin

Out of the four metro areas reviewed, Austin has experienced the greatest amount of growth in pool construction in comparison to the same time last year.  Since January, there have been 540 new swimming pool permits added to the HBW database for Austin, reflecting a 19 percent year-over-year increase.  Nearly all new permits originated from Travis County (415 permits) and Williamson County (116 permits), with both counties exhibiting an 18 percent year-over-year increases in new pool permits.

San Antonio

While San Antonio has demonstrated an annual growth pattern in new pool construction since 2015, there have been some signs of slowing since the start of this year.  As of the second quarter of 2019, there has been a seven percent decline in new pool construction in comparison to last year, resulting in nearly 320 new pool permits on record with HBW, most of which originated from Bexar County (261 permits).

To gain more information on the builders, homeowners and permits for the construction activity above, check out HBW for your copy of the latest construction data reports. To gain access to the HBW database and receive custom and detailed reports on the latest residential and commercial building activity in Florida, Georgia, Texas, Alabama, and Oklahoma, please contact HBW for details.

Texas Home Building Report – June 2019

An HBW report on the top home builders for new residential construction permits on file in Texas for the month of June 2019

Home builders in Texas are certainly busy as of late – In a recent report published by Dallas Morning News, the Dallas-Fort Worth homebuilding market ranks #1 in the U.S. (as of Q1-2019), and Houston ranks second.  Home construction in the Dallas area totaled more than 34,500 units on an annualized basis and 30,000 in Houston according to the data shared by Metrostudy, Inc.

When looking at the latest residential construction permit data from HBW for the month of June 2019, both Houston and Dallas continue to lead Texas metro areas.  Last month, Houston ranked #1 for total housing starts with more than 2,600 new residential construction permits added to the HBW database, and Dallas ranked #1 for average value of new home construction (average value: $296,988).

Here is a closer look at new residential construction permits and the leading home builders for Houston, Dallas, Austin and San Antonio during the month of June 2019:

Houston

As previously stated, Houston held the greatest total amount of new permits in comparison to other Texas metro areas.  Last month, there were 2,612 housing starts with a total construction value of approximately $531.7 million.  The average value of new construction was on the lower end of the spectrum at $203,570, and more than half of all new permits originated from Harris County (1,382 permits).

Out of the approximately 345 active home builders on file for the month, the following ranked as the top five for total new permits:

Builder Total Permits
K Hovnanian Homes 184
Lennar Homes 174
Perry Homes 132
D.R. Horton 113
Taylor Morrison Homes 109


Dallas

Last month, Dallas ranked second highest for new home construction having nearly 1,850 housing starts with a total construction value in excess of $548 million.  The average value of new construction was highest in Dallas (average value: $296,988) in comparison to the other areas reviewed, and the greatest amount of new construction activity could be found in the counties of Tarrant (488 permits) and Collin (484 permits).

Out of the more than 270 active home builders on file, the following rank as the top five for total new residential construction permits for the month:

Builder Total Permits
D.R. Horton 285
Highland Homes 96
Beazer Homes 71
First Texas Homes 68
Pulte Homes 60


Austin

In Austin, there were 915 housing starts with a total construction value of more than $237.8 million last month.  The average value of construction was $259,921, and more than half of all new permits originated from Travis County (542 permits).

Out of the 125 active home builders on record last month, the following ranked as the top five for total new permits:

Builder Total Permits
Lennar Homes 116
KB Homes 76
Pulte Homes 66
D.R. Horton 54
Gehan Homes 48


San Antonio

In San Antonio, there were approximately 450 housing starts with a total construction value of nearly $88 million during the month of June. The average value of new construction was lower in San Antonio (average value: $196,861) in comparison to other metro areas reviewed, and the bulk of all new home construction activity took place in Bexar County (338 permits).

Out of the 85 active home builders in the area last month, the following ranked as the top five for total new permits:

Builder Total Permits
KB Homes 49
LGI Homes 44
AHV Vertical 30
Bella Vista CMI 28
M/I Homes 24


To gain more information on the builders, homeowners and permits for the construction activity above, check out HBW for your copy of the latest construction data reports. To gain access to the HBW database and receive custom and detailed reports on the latest residential and commercial building activity in Florida, Georgia, Texas, Alabama, and Oklahoma, please contact HBW for details.

Texas Swimming Pool Construction Report – June 2019

A review of the latest swimming pool construction permit data from the HBW database for the month of June 2019

Texas – Average Value of New Swimming Pool Construction, June 2019

Last month, there were more than 730 new swimming pool permits added to the HBW database for the combined Texas metro areas of Dallas, Houston, Austin and San Antonio.  Out of the four major areas reviewed, Dallas ranked #1 for total new permits (413 permits), while Austin held the highest average value of new swimming pool construction ($64,626) for the month.

Here is a closer look at the new swimming pool construction permit data in Texas, by metro area, for the month of June 2019:

Dallas

As previously mentioned, Dallas had the greatest amount of new pool construction activity last month in comparison to the four areas reviewed.  There were approximately 160 active pool builders on record that were responsible for 413 pool starts with a total construction value of nearly $20.5 million.  The majority of new permits originated from the counties of Collin (123 permits), Tarrant (100 permits) and Dallas (91 permits), and the average value of construction was $49,568.

Houston

The Houston area ranked second for total new pool permits on record last month having 200 pool starts with a total construction value in excess of $11.7 million, and more than half of all new construction took place in Harris County (126 permits).  There were more than 130 active pool builders on file for the month, and the average value of new pool construction landed on the higher end of the spectrum at $58,636.

Austin

In Austin, there were 40 active contractors on record last month that generated 75 new construction permits with a total value in excess of $4.8 million.  Nearly all new construction took place in Travis County (68 permits), and the average value of construction was highest in Austin (average value: $64,626) in comparison to the other regions reviewed.

San Antonio

Last month, there were 25 active builders in the San Antonio area that generated 45 new permits and more than $2 million in construction value. Most new swimming pool construction took place in Bexar County (35 permits), and the average value of new construction was lower (average value: $46,621) than the other metro areas reviewed.

To gain more information on the builders, homeowners and permits for the construction activity above, check out HBW for your copy of the latest construction data reports. To gain access to the HBW database and receive custom and detailed reports on the latest residential and commercial building activity in Florida, Georgia, Texas, Alabama, and Oklahoma, please contact HBW for details.

Metro Atlanta Swimming Pool Construction Q2-2019

A review of the latest swimming pool permit data for Atlanta from January through June 2019

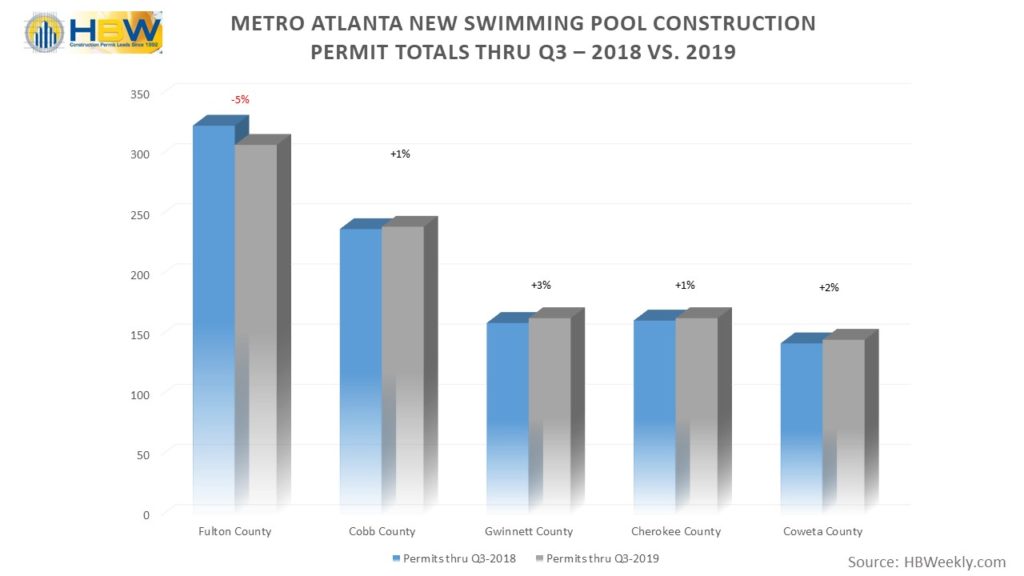
Atlanta Top Counties for Total New Swimming Pool Permits 2018 vs. 2019

In Atlanta, new swimming pool construction permits have been on the rise year after year.  Since 2015, HBW has identified marked growth in swimming pool starts ranging from annual increases as low as 1 percent to as high as 18 percent every year.  So far this year (Q2-2019), new swimming pool construction in Atlanta reflects a 3 percent year-over-year increase, resulting in 1,150 new permits.

For the purpose of HBW reports, the metro Atlanta area includes data from twenty-four counties.  Based on HBW’s latest swimming pool construction activity trend report for the second quarter of this year, and as noted in the above listed graph, the counties with the highest concentration of new swimming pool construction include Fulton County (186 permits); Cobb County (160 permits); Gwinnett County (98 permits); Coweta County (97 permits); and Cherokee County (94 permits); all of the top listed counties are off to a slower start in new pool construction in comparison to the same time last year with the exception of Coweta County; new pools have been on the rise in Coweta for the last five years, and through the second quarter of this year, the area is already 11 percent ahead of figures from 2018.

Other counties that are exhibiting healthy growth in new pool construction but still hold lower concentrations of total permits include Hall County (36% year-over-year increase) and Forsyth County (31% year-over-year increase).

Information utilized for the above listed figures for Metro Atlanta residential construction was directly derived from HBW construction data reports. To gain access to the HBW database and receive custom and detailed reports on the latest residential and commercial building activity in Florida, Georgia, Texas, Alabama, and Oklahoma, please contact HBW for details.
Quarterly Report: Atlanta Residential Construction Q2-2019

A review of new residential construction permit data from January 2019 through June 2019

Last year, metro Atlanta’s new residential construction market held steady, not having much movement in the direction of growth or slowing down.  Since the start of 2019 (through June), residential construction in the metro Atlanta area has shown a slight sign of slowing with a 4% year-over-year decrease in new permits on record with HBW.

Throughout the metro Atlanta area there have been approximately 11,730 housing starts in the first half of this year, and nearly half of all new construction took place in the following five counties:

Gwinnett County

Through the second quarter of this year, Gwinnett County ranked #1 for total housing starts in comparison to other metro Atlanta area counties.  As of 2018, the population is estimated to be 927,781, making it the second-most populous county in Georgia.  Since the start of this year, there have been 1,513 new residential construction permits added to the HBW database for Gwinnett, reflecting a 17% year-over-year decrease in new residential construction.

Fulton County

Fulton County ranked second highest for total new residential construction permits on file with HBW through Q2-2019.  Being city-center and having Atlanta as its county seat, Fulton’s population and residential market continue to grow; based on 2018 estimates, the population was 1,050,114, making it the state’s most populous county and the only one with over 1 million inhabitants.  Since the start of this year, there have been more than 1,320 housing starts in the area, reflecting a 5% year-over-year increase in new residential construction activity.

Cherokee County

According to the Cherokee Ledger-News (August 29, 2018), Cherokee County (population 254,500+) is currently the fastest growing county in the metro Atlanta area.  In the first half of 2019 (thru Q2-2019), Cherokee’s new residential construction market has held steady with no major changes, resulting in nearly 1,070 housing starts on file with HBW.

Forsyth County

According to HBW records, Forsyth County has been experiencing a decline in new residential construction year after year since 2016.  This year (thru Q2-2019) has followed the same pattern of decline as there has been a 25% year-over-year decrease in new home construction permits, resulting in just over 1,020 new permits.

Cobb County

Similar to Forsyth County, the County of Cobb has also demonstrated a decline in new residential construction since the start of this year.  Unlike Forsyth, Cobb County’s new residential construction market has been on an upward growth trend for the past five years, so the 30% year-over-year decrease in new residential construction permits through Q2-2019 is uncharacteristic of the area.  Over the next six months, Cobb County will certainly be an area to watch for improvement in its residential construction market.

Information utilized for the above listed figures for Metro Atlanta residential construction was directly derived from HBW construction data reports. To gain access to the HBW database and receive custom and detailed reports on the latest residential and commercial building activity in Florida, Georgia, Texas, Alabama, and Oklahoma, please contact HBW for details.
Construction Job Rate Continues to Climb

An overview of the latest report by the Bureau of Labor Statistics on construction industry jobs as of June 30, 2019

There is no time like the present to be looking for employment in the construction industry.  From offering paid apprenticeships to procuring services of top headhunters, employers are in an ongoing and intense battle for trade professionals.  Based on the latest report published by the Bureau of Labor Statistics (released July 5, 2019), the 12-month period ending June 30, 2019 produced 224k new jobs in construction, and the unemployment rate was somewhat steady at 3.7 percent.

During the month of June, the construction industry added 21k jobs, and more than half were in specialty trades. Nonresidential construction employment gained 14,900 net jobs in June and is up 146,700 jobs for last 12 months. All major segments of nonresidential construction added jobs last month, with most of the job growth being in the nonresidential specialty trade contractor segment where 12,000 new positions were added (source: Bureau of Labor Statistics).

Source: Bureau of Labor Statistics

Construction wages were also up, reflecting a 3.2 percent year-over-year increase and resulting in an average hourly wage of $30.73.  While the construction industry’s unemployment rate (4 percent) slightly worsened in comparison to May (3.2 percent), the unemployment rate has exhibited improvement in comparison to 2018.

In a separate report, BLS published that “employment of construction laborers is projected to grow 12 percent from 2016 to 2026, faster than the average for all occupations. Laborers work in all fields of construction, and demand for laborers should mirror the level of overall construction activity.”

For the latest updates on construction industry news, business and marketing tips, stay connected with the HBW Blog.  To gain access to the latest reports on construction permit data in Florida, Texas, Georgia, Alabama and Oklahoma, contact HBW.

Luxury Home Sales on the Decline

A look at the highs and lows of luxury residential property sale prices in the U.S.

According to a recent report from realtor.com, home sales valued over the $1 million mark have experienced the deepest decline since 2010.  In March, such high value property sale prices were down 8.3% year-over-year in eighty-five luxury markets that were analyzed.

While high-end residential construction has seen a decline overall, thirty-five out of eighty-five of the markets reviewed actually experienced growth in luxury sales as of March 2019. Many of the growing cities are secondary markets, and according to the report, several have been experiencing at least 58 percent growth in luxury sales – Those areas include:

  • Westchester, New York
  • Plymouth, MA
  • Louden, VA
  • Honolulu, HI
  • San Luis Obispo County, CA

When looking at regions where HBW focuses its data reports, Florida had a few areas that reflected noteworthy growth (and declines) in luxury home sales:

Tampa – Tampa continues to grow both in new home construction and sales, and when it comes to value, home sale prices experienced a 13.7 percent year-over-year increase, with the entry-level price point landing at $731k in March.  In Pinellas County, luxury sales were on a high and reflected nearly a 47 percent increase from March 2018 to March 2019.

While Tampa stays in the spotlight, other Florida areas have experienced significant declines in luxury home sale prices.  For example, as of March 2019, home prices in Sarasota, Florida experienced more than a 14 percent year-over-year decrease, and Collier County reflected a nearly 2 percent year-over-year decline in price.

So, what are the most expensive luxury markets in the U.S.?  You can simply look to Northern California for the highest luxury residential property sale prices; the top five were reported as follows:

  1. San Mateo, CA – Luxury Sale Price: $3,654,000
  2. San Francisco, CA – Luxury Sale Price: $3,374,000
  3. Marin, CA – Luxury Sale Price: $3,158,000
  4. Santa Clara, CA – Luxury Sale Price: $2,835,000
  5. Eagle, CO – $2,556,000

To gain access to the HBW database and receive custom and detailed reports on the latest residential and commercial building activity in Florida, Georgia, Texas, Alabama, and Oklahoma, please contact HBW for details.
Mark Your Calendars: Five More Industry Expos

At the start of the year, we posted “Construction Industry Convention and Expos 2019” where we listed construction trade shows through the summer to help you plan ahead and secure dates for the first half of the year.  Now that we are mid-year, it is the perfect time to look at the coming months to assess if there are any other expos that would be a good fit for your business to round out networking and education programs that you have in place.

As previously mentioned in other posts, conventions and expos can serve a valuable purpose; along with having an opportunity to view the best and the brightest of the industry, industry events provide a multitude of opportunities to network, expand your knowledge and catch up on continuing education credits.  If you are a manufacturer or supplier and are looking to get the word out on a new product line or launch, it is the ideal time to put your new products in the spotlight, and connect with new and established customers with whom you may not have the chance to visit in-person on a regular basis.

The following is a list of expos and events to consider for the second half of 2019:

Event: Build Expo
Date(s): July 17-18, 2019
Location: Cobb Galleria Centre (Atlanta, Georgia)

Build Expo offers educational seminars and industry events throughout the U.S. nearly every month of the year.  The remaining events from July include locations such as Atlanta (July 17-18), Houston (August 14-15), San Diego (September 18-19), and Tampa (October 23-24).

Event: GlassBuild America
Date(s): September 17-19, 2019
Location: Georgia World Congress Center (Atlanta, Georgia)

GlassBuild America expects to house approximately 450 exhibitors, including everything from manufacturers and distributors to fabricators and retailers of flat glass and residential windows and doors. The event attracts a variety of attendees within the glass, window and door industries.  According to the website, 48 percent of attendees hold executive and high-level management positions.

International Pool, Spa and Patio Expo (PSP Expo)

Date(s): November 2-7, 2019
Location: Ernest N. Morial Convention Center (New Orleans, Louisiana)

According to the event website, this year’s expo is expecting to draw more than 10,500 buyers from all regions of the United States and from around the world, including residential and commercial builders, installers, service professionals, spa dealers, outdoor living retailers, buying agents and other industry professionals.  As for education, there will be more than 45 speakers covering topics for every segment of the residential and commercial pool, spa, and outdoor living industries.

Event: Remodeling Show (co-located with DeckExpo)

Dates(s): November 6-8, 2019

Location: Kentucky International Convention Center (Louisville, Kentucky)

The tradeshow’s frequency is annual, with the DeckExpo rotating locations.  Remodeling Show co-located with DeckExpo brings together thousands of remodeling and residential construction professionals from all over the nation to connect, learn, and elevate their craft.  The show is expected to have over 200 building product manufacturers, an in-depth educational conference program with business and jobsite training, and plenty of networking events to join.

Event: The Buildings Show

Date(s): December 4-6, 2019
Location: Metro Toronto Convention Center (Toronto, Canada)

The Buildings Show is listed as North America’s largest event for industry products, services, educational programming and networking.  For just over 30 years, the event has brought together design, architecture, construction and real estate sectors.  New this year is the PropTech Expo, Buildings Connect, along with HomeBuilder & Renovator Expo and the World of Concrete Pavilion.  Buildings Connect provides a dynamic showcase of innovative technology directly impacting people, places, properties, portfolios, energy use and operational efficiencies within the built environment.

For more information on construction business and marketing tips, stay connected with the HBW Blog.  To get ahead of construction activity and gain access to the latest permitting data in Florida, Texas, Georgia, Alabama and Oklahoma, contact HBW for more information on construction data reports and industry leads.