A review of permit data based on the latest HBW building activity trend report for new home construction in the Metro Atlanta area
ATL Top 5 Counties for New Residential Construction Permits Q1-2020
For the first time since 2017, the Atlanta area is demonstrating year-over-year increases in new home construction during the first quarter of the year. Based on the latest HBW “Building Activity Trend Report” for new residential construction in the Metro Atlanta area, there has been a 10 percent year-over-year increase in housing starts in Q1-2020, resulting in 5,825 new residential construction permits on record with HBW for the three-month period.
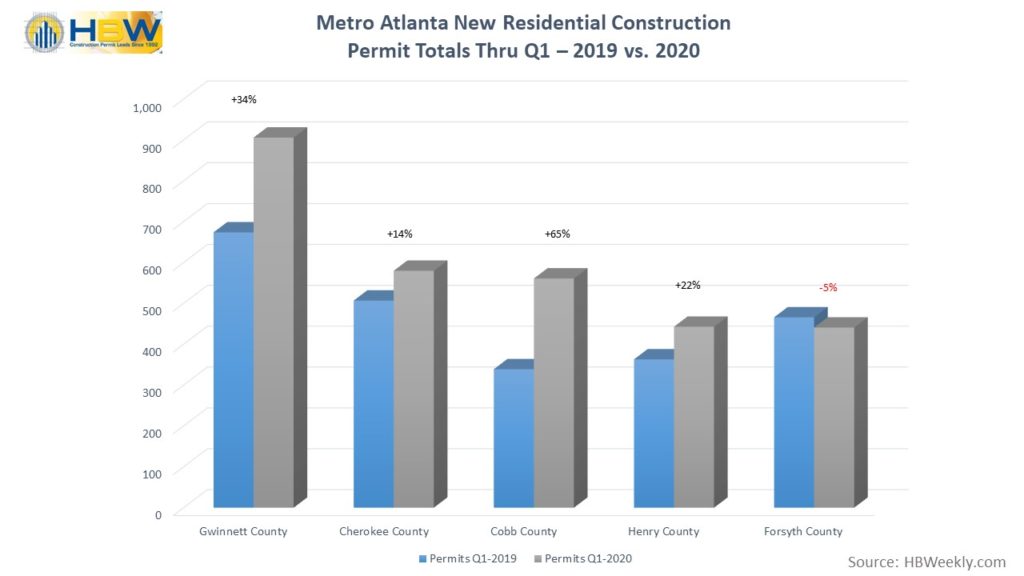
When reviewing the report to identify where the bulk of new home construction is taking place, the top three counties for highest volume of new permits are Gwinnett County (906 permits), Cherokee County (580 permits) and Cobb County (561 permits). All three counties have demonstrated a strong start to 2020, reflecting year-over-year increases in new residential construction ranging from 14 percent to a whopping 65 percent.
While current conditions and limitations posed by the pandemic will most likely affect new construction figures going forward, Gwinnett County is certainly exhibiting growth in the residential construction market. Not since 2017 has the area exhibited annual increases in housing starts, but if the first quarter of 2020 is at all a foreshadowing of things to come, new home construction in Gwinnett County will be back on the rise. From January through March 2020, there has been a 34 percent year-over-year increase in housing starts in Gwinnett County, resulting in the highest volume of new residential construction permits (906 permits) out of all Metro Atlanta area counties reviewed.
Ranking second for volume of housing starts is Cherokee County. Through the third quarter of this year, there have been 580 housing starts in Cherokee County, reflecting a 14 percent increase in new permitting activity in comparison to Q1-2019.
Not far behind Cherokee County is Cobb County with more than 560 housing starts from January through March of this year. While Cobb County had experienced a significant annual dip (-23%) in new home construction last year (2019), the county is off to a major upward trajectory in the first quarter of this year, with a 65 percent increase in housing starts in comparison to the same time last year.
Other Metro Atlanta area counties that held higher concentrations of new residential construction permits in the first quarter of this year include: Henry County (443 permits); Forsyth County (441 permits); and Fulton County (431 permits).
Information utilized for the above listed figures for Metro Atlanta residential construction was directly derived from HBW construction data reports. To gain access to the HBW database and receive custom and detailed reports on the latest residential and commercial building activity in Florida, Georgia, Texas, Alabama, and Oklahoma, please contact HBW for details.


 The coronavirus pandemic has gripped our country and the entire globe like nothing we have experienced before. It seems as if everything is in constant flux – statistics, statewide and citywide regulations and related reports are changing on a daily basis, and the uncertainty is hitting everyone at home and at work.