A review of permit data for new swimming pool construction in Texas during the month of September
Based on HBW’s latest construction data reports, there were approximately 785 new swimming pool construction permits with a total value in excess of $45.2M added to the HBW database for the Lone Star State last month. Out of the four metro areas reviewed (Dallas, Houston, Austin, San Antonio), the greatest concentration of new pool construction could be found in Dallas (327 permits), while the highest average value of construction could be found in Houston (average value: $75,081).
Here is a closer look at the new swimming pool construction permit data added to the HBW database for each Texas metro area last month:
Dallas
Total Number of Permits: 327
Average Value of Construction: $50,081
Top Counties for New Pool Construction: Denton County (88 permits); Tarrant County (81 permits)
Top 3 Pool Builders (based on total permits):
Builder
Total Permits
1-BMR Pools
14
2-Puryear Custom Pools
13
3-Riverbend Pools
12
Houston
Total Number of Permits: 278
Average Value of Construction: $75,081
Top Counties for New Pool Construction: Harris County (172 permits); Galveston County (45 permits)
Top 3 Pool Builders (based on total permits):
Builder
Total Permits
1-Platinum Pools
29
2-Cypress Custom Pools
11
3-Premier Pools
11
Austin
Total Number of Permits: 113
Average Value of Construction: $50,600
Top Counties for New Pool Construction: Travis County (67 permits); Williamson County (37 permits)
Top 3 Pool Builders (based on total permits):
Builder
Total Permits
1-Cody Pools
11
2-Denali Pools
9
3-Aquamarine Pools of Texas
9
San Antonio
Total Number of Permits: 66
Average Value of Construction: $34,437
Top County for New Pool Construction: Bexar County (51 permits)
Top 3 Pool Builders (based on total permits):
Builder
Total Permits
1-Gary Pools
11
2-Keith Zars Pools
10
3-Blue Haven Pools
7
To gain more information on the builders, homeowners and permits for the construction activity above, check out HBW for your copy of the latest construction data reports. To gain access to the HBW database and receive custom and detailed reports on the latest residential and commercial building activity in Florida, Georgia, Texas, Alabama, and Oklahoma, please contact HBW for details.
A review of the leading residential construction contractors in Texas during the month of September 2022
Last month, there were approximately 5,050 new residential construction permits with a total value of nearly $1.5 billion in the Lone Star State. Out of the four major metropolitan areas reviewed (Dallas, Houston, Austin, San Antonio), Houston carried the highest concentration of new home construction activity (2,142 permits), while the highest average value of new home construction projects could be found in Austin (average value: $333,097).
When taking a closer look at HBW’s monthly construction data reports, several home builders were identified as leading new construction across the state – Based on the total number of new permits on record with HBW for the one-month period, both D.R. Horton and Lennar Homes have a strong presence in the market, having 588 and 525 new permits respectively.
Here is a closer look at the leading home builders in Texas (by area) based on the total number of new residential construction permits added to the HBW database during the month of September 2022:
Houston
Last month, there were more than 2,140 new residential construction permits with a total value in excess of $562 million on record for the Houston area.
Out of more than 305 active contractors with new home construction activity in the Houston area last month, the following ranked as the top five for total new permits:
Builder
Total Permits
Average Value
1-Lennar Homes
244
$ 179,617.00
2-D.R. Horton
216
$ 226,629.00
3-Pulte Homes
123
$ 304,615.00
4-Meritage Homes
83
$ 266,900.00
5-Century Communities
67
$ 187,536.00
Dallas
In the Dallas area, there were 1,630 new residential construction permits with a total value of $495 million added to the HBW database last month.
Out of 215 contractors with new residential construction activity in the area, the following ranked as the top five for total new permits:
Builder
Total Permits
Average Value
1-D.R. Horton
275
$ 167,000.00
2-Lennar Homes
164
$ 188,017.00
3-Meritage Homes
81
$ 312,002.00
4-Bloomfield Homes
68
$ 399,164.00
5-LGI Homes
54
$ 151,879.00
Austin
In the Austin area, there were more than 850 new residential construction permits with a total construction value of nearly $284 million last month.
Out of the more than 125 contractors with new residential construction activity on record for the one-month period, the following ranked as the top five for total new permits:
Builder
Total Permits
Average Value
1-Pulte Homes
101
$ 368,072.00
2-D.R. Horton
96
$ 259,273.00
3-KB Homes
92
$ 262,735.00
4-Lennar Homes
68
$ 219,011.00
5-Taylor Morrison Homes
46
$ 425,840.00
San Antonio
Last month, there were approximately 425 housing starts with a total construction value in excess of $115 million in San Antonio.
Out of 95 home builders with new permits added to the HBW database during the one-month period, the following ranked as the top five for total new permits:
Builder
Total Permits
Average Value
1-Perry Homes
50
$ 261,892.00
2-Lennar Homes
49
$ 201,946.00
3-KB Homes
40
$ 221,257.00
4-Pulte Homes
31
$ 237,097.00
5-M/I Homes
29
$ 235,801.00
To gain more information on the builders, homeowners and permits for the construction activity above, check out HBW for your copy of the latest construction data reports. To gain access to the HBW database and receive custom and detailed reports on the latest residential and commercial building activity in Florida, Georgia, Texas, Alabama, and Oklahoma, please contact HBW for details.
A review of permit data for new residential construction in Atlanta from January through September
Based on HBW’s latest Building Activity Trend Report for new residential construction in Metro Atlanta, new home construction activity has declined since last year. Through the third quarter of this year there has been a 20 percent year-over-year decrease in new residential construction, resulting in 18,357 new permits on record with HBW.
Out of the 24 counties that make up the Metro Atlanta area, there were five counties that carried nearly 50 percent of all new residential construction permits; those counties were as follows:
Gwinnett County – While Gwinnett County has experienced a year-over-year decrease of 24 percent in new home construction through Q3-2022, the area still holds the greatest concentration of new residential construction activity (2,674 permits) in comparison to other counties reviewed.
Cherokee County – In Cherokee County, there has been a 10 percent year-over-year increase in new home construction, resulting in more than 2,000 new permits added to the HBW database through the third quarter of this year.
Fulton County – Fulton County ranks third for total new permits on record with HBW through Q3-2022 (1,509 permits), and the area ranks #1 for higher value housing starts, having 383 new permits with construction values in excess of $500k.
Cobb County – Cobb County ranks #4 for new home construction through Q3-2022, having more than 1,250 housing starts on record for the nine-month period.
Forsyth County –Through the third quarter of this year, Forsyth County has experienced a hefty 44 percent year-over-year decrease in new home construction, resulting in approximately 1,105 new residential construction permits.
Although residential construction in the Atlanta area is down overall, there are a few counties where housing starts are soaring in comparison to last year, with year-over-year increases ranging from 4 percent (Fayette County, 573 permits) to 42 percent (Rockdale County, 295 permits). Additionally, there are more than 1,260 new permits with residential construction values in excess of $500k on record through Q3-2022, and more than half of all new “higher value” housing starts originated from the three counties of Fulton (383 permits >$500k), Dekalb (150 permits >$500k), and Hall (116 permits >$500k).
Information utilized for the above listed figures for Metro Atlanta residential construction was directly derived from HBW construction data reports. To gain access to the HBW database and receive custom and detailed reports on the latest residential and commercial building activity in Florida, Georgia, Texas, Alabama, and Oklahoma, please contact HBW for details.
A review of permit data for new swimming pool construction in the Metro Atlanta area from January through September
Through the third quarter of this year, it appears that new swimming pool construction is slowing down in Atlanta. Every year, since 2017, the metro Atlanta area has exhibited a pattern of annual growth in swimming pool construction, but so far this year, that pattern appears to have slowed or taken a slight turn down.
Based on the latest HBW Swimming Pool Construction Activity Trend Reports for Metro Atlanta, there has been a 10 percent year-over-year decrease in new swimming pool construction (thru Q3), resulting in approximately 3,160 new permits on record through the third quarter of this year.
Out of the 24 counties that make up the metro Atlanta area, the following carried the greatest concentration of new swimming pool construction activity for the 9-month period:
Fulton County (626 permits)
Cobb County (336 permits)
Gwinnett County (270 permits)
Forsyth County (243 permits)
Cherokee County (242 permits)
Although the metro Atlanta area’s new pool construction figures are on a low through the third quarter, there are a few areas that appear to be holding steady or have demonstrated some notable growth. In Coweta County, there has been a 5 percent year-over-year increase in new pool construction (thru Q3), resulting in nearly 210 new permits on record with HBW. In Walton County, new pool construction figures are climbing as there has been an 11 percent year-over-year increase in new permits, resulting in 127 new permits through Q3. And in Henry County, there has been a 29 percent year-over-year increase in new swimming pool construction, resulting in approximately 165 new permits on record with HBW.
Information utilized for the above listed figures for Metro Atlanta swimming pool construction was directly derived from HBW construction data reports. To gain access to the HBW database and receive custom and detailed reports on the latest residential and commercial building activity in Florida, Georgia, Texas, Alabama, and Oklahoma, please contact HBW for details.
As most of us are aware, Hurricane Season runs from June 1st to November 30th each year. This means that we are now more than halfway through the season, and for Florida, Hurricane Ian has reminded all of us how powerful and destructive these storms can be. As I write this, in the wake of Hurricane Ian, more than 1.9 million homes and businesses in Florida are still without power; that is down from more than 3.5 million power customers affected by Ian since it hit Florida’s West Coast on Wednesday.
Beyond power loss, the widespread destruction to homes and properties, as well as unfathomable flooding (700+ water rescues so far), will require a long and heavy recovery process. On top of that, a resurgent Hurricane Ian is currently making a second landfall in South Carolina, where power outages were starting to grow as the storm approached.
And while many construction industry professionals will be carrying a heavy load of responsibility in this recovery process, it is important to not lose sight on how preparation can better position all of us for these extreme weather events. As a construction industry professional, weather conditions hold significant importance to your job sites, crews, and clients, even more so than other industries. Safety and communication are crucial in managing clients’ expectations and employees. For this reason, it is prudent to be ahead of the weather by reviewing your safety plan and implementing some basic guidelines:
Prepare Clients – When executing a contract, it is best practice to have a clause covering the possibility of delays due to natural forces and unforeseen circumstances. Although it may be in the fine print, it is crucial that you make sure your clients understand the potential implications of severe weather conditions on the project and construction timeline. Managing expectations is paramount in maintaining a quality and long-term relationship with your clients. Be upfront and direct about the possibility of delays due to weather while communicating your plans and intentions for following through on the original and proposed timeline. Such delays will also directly impact other outstanding projects, so balance your schedule and communicate realistic expectations with all clients who may be affected.
Once the storm has passed, have project managers touch base with clients of open projects. Don’t wait for damage to be reported to you. When it’s safe, work to get your teams on your job sites to assess and document damage (if any) and report back as soon as possible. Additionally, you can keep your clients’ minds at ease by communicating what you will be doing and keeping them informed with status updates.
Prepare Crews – If you don’t already have a weather safety plan and guidelines for your crews in place, creating a plan should be a priority. In addition to foremen and crews demonstrating a clear understanding of all safety regulations and equipment, job sites should be properly outfitted with safety instructions, tools, and gear. Provide crews with a checklist for securing the site in the case of severe weather. Take time each year to review your plan for applicability and effectiveness. Consider adding additional training or tools. With September being National Preparedness Month, Ready.gov has many resources you can use to create or revise your current Disaster Plan, as well as tools for preparing and recovering from flooding and hurricane damage.
Prepare Office – Beyond securing property, technology, and equipment, your office will benefit from a proper plan for managing employee communication, evacuations, office equipment and more. You will want to assess all possible hazards that exist and could potentially have an impact on operations. Designate lead points of contact for every department early in the process, along with proper distribution of an emergency call tree.
Once the storm has passed, have the department leaders check in with all employees on their safety, as well as their ability to return to the office. Be clear about office hours, the status of your job sites and facilities, as well as any support your company may be providing for employees during recovery.
Being ready for severe weather is more than safety kits, canned food, water, and flashlights. For construction business owners, there are various levels of liability, extending from the job site to the office. By having a comprehensive plan in place, you can provide a sense of security for employees and clients during the uncertain and stressful conditions resulting from extreme weather events.
For more information on construction industry trends and business tips, stay connected with the HBW Blog. To get ahead of construction activity and gain access to the latest permitting data in Florida, Texas, Georgia, Alabama and Oklahoma, contact HBW for more information on construction data reports and industry leads.
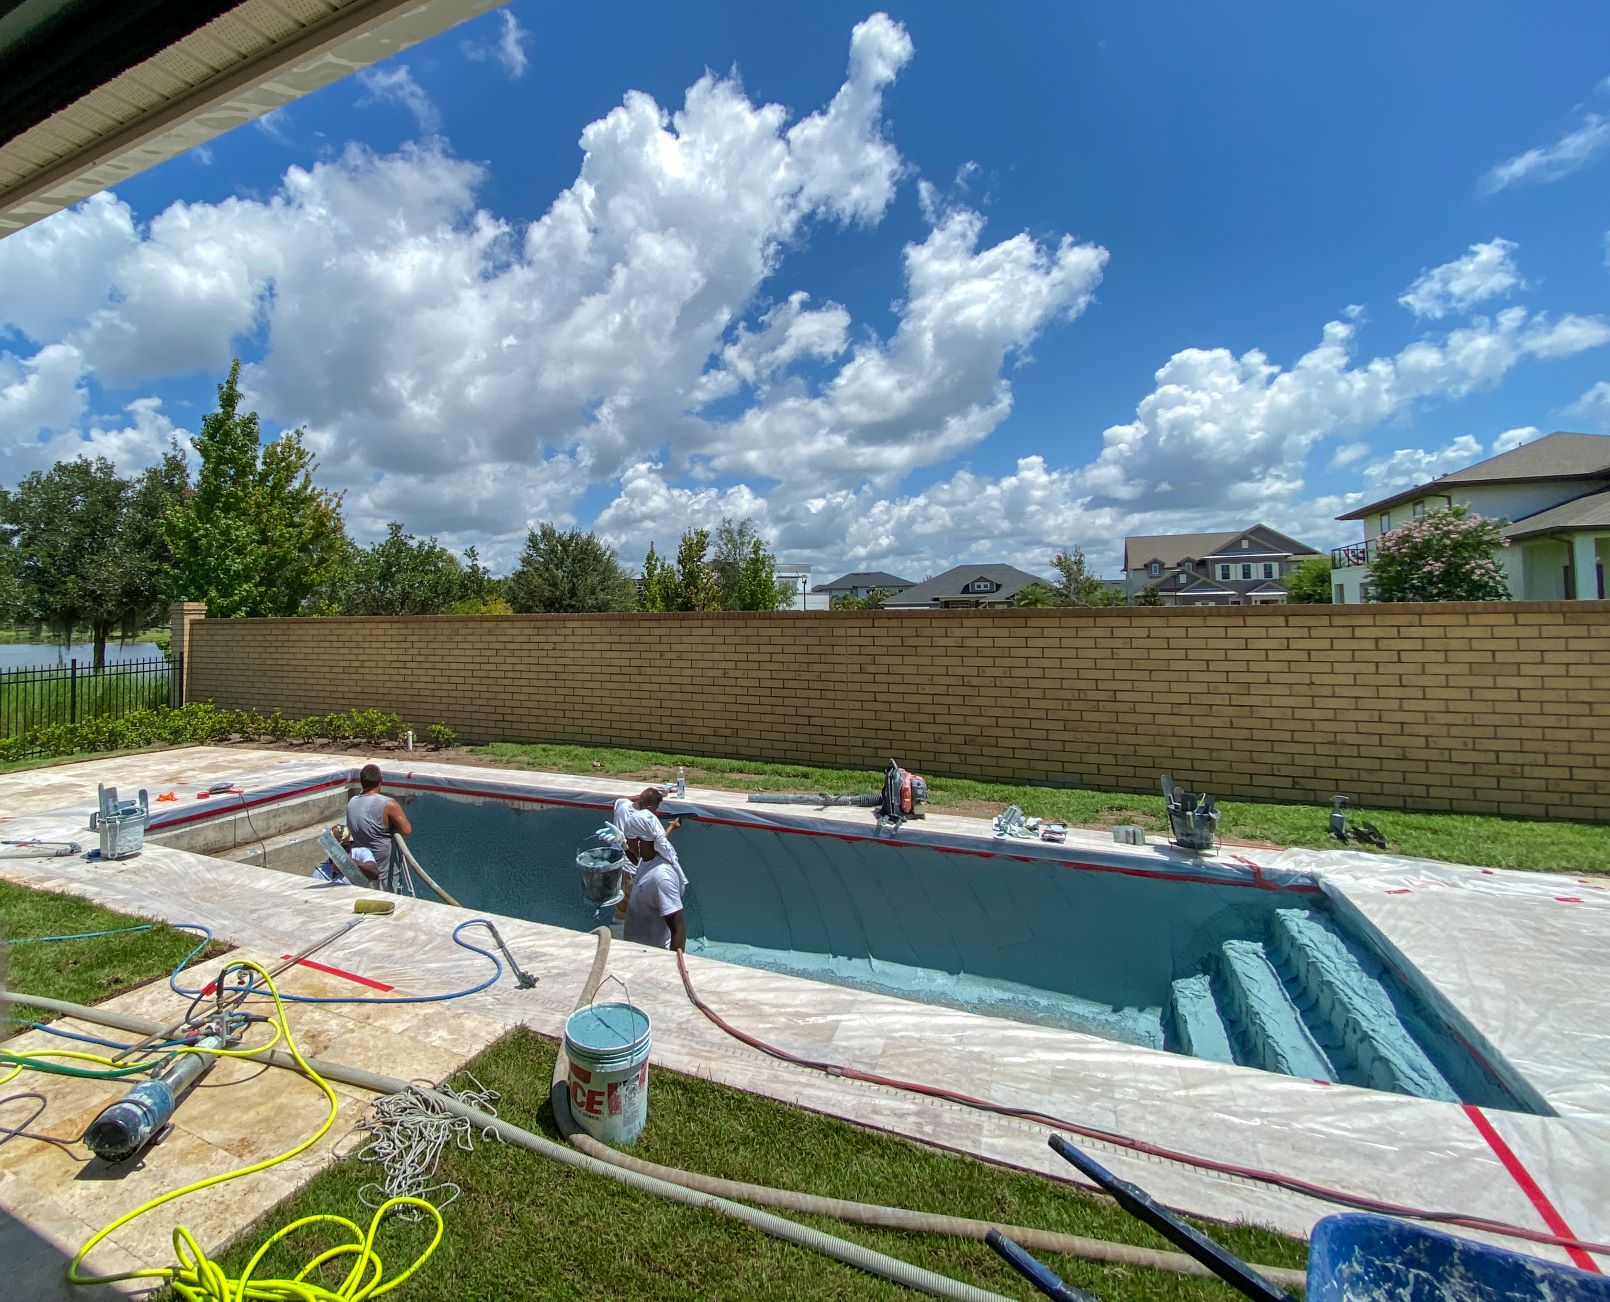
A review of leading swimming pool contractors in Florida during the month of August
If you have been keeping up with the HBW blog, then you are already aware of the latest statistics on Florida’s swimming pool construction last month. In our most recent post, the southwestern region of Florida was in the spotlight, as approximately 35 percent of all new swimming pool construction took place there during the month of August. When looking at the Sunshine State overall, there were nearly 3,250 new swimming pool permits with a total construction value of approximately $225 million last month.
When it comes to swimming pool contractors, the leaderboard widely varies by region. For this reason, here is a summary of the leading pool builders, by Florida region, for the month of August 2022:
Southwest
As previously mentioned, Southwest Florida ranked #1 for new swimming pool construction last month, having nearly 1,125 new swimming pool permits with a total construction value of approximately $75.2 million.
Out of the nearly 210 swimming pool contractors on record for the month, the following ranked as the top five for total new permits:
Builder
Total Permits
1-Aragon Pools & Spas
54
2-Pinnacle USA
46
3-Artesian Pool Construction
45
4-Coast to Coast Pools
43
5-Trusted Pool & Spa
39
Southeast
In the southeastern region of Florida, there were 718 new pool permits with a total construction value of nearly $47 million on record for the month of August.
Out of nearly 250 pool contractors with new construction activity in the area last month, the following ranked as the top five for total new permits:
Builder
Total Permits
1-A&G Concrete Pools
34
2-Van Kirk Construction
30
3-Pools by Greg
19
4-Sunsational Pools & Spa
18
5-Apex Pavers & Pools
17
Tampa
In Tampa, there were 660 new swimming pool construction permits with a total value of nearly $50 million last month.
Out of the 170 pool builders with new construction activity on record in the area last month, the following ranked as the top five for total new permits for the one-month period:
Builder
Total Permits
1-Bob’s Pool Service
54
2-Challenger Pools
52
3-Central Florida Pools
26
4-Gulfstream Pools & Spas
20
5-Modern Pools
17
Orlando
Last month, the Orlando area had more than 475 new swimming pool permits with a total construction value of nearly $30.2 million on record with HBW.
Out of more than 110 pool contractors with new construction on record for the month, the following ranked as the top five for total new permits:
Builder
Total Permits
1-Dreamscapes Pools & Spas
44
2-American Pools & Spas
31
3-All Seasons
27
4-Martin Pools
19
5-Bob’s Pool Service
19
Jacksonville
Finally, in Jacksonville there were nearly 270 new swimming pool permits with a total construction value of more than $22.3 million last month.
Out of approximately 80 pool contractors with new construction activity on record in the region last month, the following ranked as the top five for total new permits:
Builder
Total Permits
1-Agua Pools & Spas
28
2-Blue Haven Pools
15
3-Pools by John Clarkson
13
4-Island Pools
12
5-Waldhauer & Son
12
To gain more information on the builders, homeowners and permits for the construction activity above, check out HBW for your copy of the latest construction data reports. To gain access to the HBW database and receive custom and detailed reports on the latest residential and commercial building activity in Florida, Georgia, Texas, Alabama, and Oklahoma, please contact HBW for details.
A review of the latest permit data for new swimming pool construction in Southwest Florida during the month of August 2022
When reviewing the latest construction permitting data available from the HBW database, we found nearly 3,250 new swimming pool permits in Florida for the month of August. Based on HBW’s construction data reports, last month appears to be the strongest summer month for swimming pool construction this year, with June and July having 2,430 and 2,460 new permits on record respectively.
Out of the five regions (Tampa, Southwest, Southeast, Orlando, Jacksonville) that make up the Sunshine State, there is one region that has been consistently holding its lead in new pool construction month after month, and that region is the Southwest.
In August, approximately 35 percent of all new swimming pool construction in Florida originated from the southwestern region – Last month, there were nearly 1,125 new swimming pool permits with a total construction value of approximately $75.2 million. The average value of construction landed on the lower range in comparison to other major regions reviewed, coming in at $66,897 for the one-month period.
When looking at figures from a countywide perspective, more than 80 percent of all new swimming pool construction in the Southwest took place in Lee County (430 permits), Manatee County (248 permits) and Collier County (229 permits), where the average value of new construction ranged from a low of $62,319 (Lee County) to a high of $71,676 (Collier County).
Last month, there were nearly 210 swimming pool contractors with new permits on record with HBW in the southwestern region. When looking at the contractors with the greatest total amount of new permits on record for the one-month period, the following ranked as the top five for total new permits:
Builder
Total Permits
Average Value
1-Aragon Pools & Spas
54
$ 32,778.00
2-Pinnacle USA
46
$ 58,804.00
3-Artesian Pool Construction
45
$ 64,486.00
4-Coast to Coast Pools
43
$ 46,175.00
5-Trusted Pool & Spa
39
$ 73,367.00
To gain more information on the builders, homeowners and permits for the construction activity above, check out HBW for your copy of the latest construction data reports. To gain access to the HBW database and receive custom and detailed reports on the latest residential and commercial building activity in Florida, Georgia, Texas, Alabama, and Oklahoma, please contact HBW for details.
A list of the top home builders in Florida during the month of August
Last week, we reviewed new residential construction permit data for the Sunshine State during the month of August, at which time we reported just over 9,000 new residential construction permits on record with HBW for the one-month period. This week, we are taking a closer look at the leading home builders driving new construction figures across the state.
Across the five major regions reviewed (Tampa, Southwest, Orlando, Southeast, Jacksonville), Lennar Homes and D.R. Horton led the market, having 1,141 and 925 new residential construction permits on record for the one-month period respectively. Combined, they carried approximately 23 percent of all new home construction activity statewide for the month.
Here is a closer look at leading contractors by Florida region, as based on total new residential construction permits on record with HBW for the month of August 2022:
Tampa
Out of the nearly 270 active contractors with new permits on record in the Tampa area last month, the following ranked as the top five for total new permits:
Builder
Total Permits
Average Value
1-Lennar Homes
314
$ 292,918.00
2-D.R. Horton
275
$ 243,172.00
3-The Villages of Lake Sumter
158
$ 311,285.00
4-Pulte Homes
145
$ 243,147.00
5-Taylor Morrison
84
$ 388,265.00
Southwest
Last month, there were approximately 455 contractors with residential construction permits on record with HBW in the southwestern region of Florida, and the following ranked as top five for the greatest number of new permits:
Builder
Total Permits
Average Value
1-Lennar Homes
280
$ 148,762.00
2-Pulte Homes
214
$ 221,898.00
3-Taylor Morrison
153
$ 192,124.00
4-Neal Communities of SW FL
121
$ 306,108.00
5-D.R. Horton
107
$ 234,124.00
Orlando
Out of approximately 220 contractors with new residential construction activity on record in the Orlando area last month, the following ranked as the top five for total new permits:
Builder
Total Permits
Average Value
1-Lennar Homes
253
$ 187,014.00
2-D.R. Horton
241
$ 301,564.00
3-Pulte Homes
124
$ 328,881.00
4-Dream Finders Homes
85
$ 314,320.00
5-M/I Homes
56
$ 294,399.00
Southeast
In the southeastern region of the state, there were 170 active home builders with new construction activity on record last month, and the following ranked as the top five for total new permits:
Builder
Total Permits
Average Value
1-Lennar Homes
215
$ 255,297.00
2-D.R. Horton
100
$ 181,162.00
3-Pulte Homes
70
$ 379,597.00
4-Gl Building Corporation
64
$ 355,384.00
5-Ryan Homes
55
$ 239,279.00
Jacksonville
Last month, there were more than 165 home builders with new construction activity on record in the Jacksonville area, and the following ranked as the top five for total new permits:
Builder
Total Permits
Average Value
1-D.R. Horton
202
$ 210,888.00
2-KB Homes
131
$ 126,958.00
3-Dream Finders Construction
129
$ 241,444.00
4-American Classic Homes
120
$ 85,000.00
5-Mattamy Homes
113
$ 178,494.00
To gain more information on the builders, homeowners and permits for the construction activity above, check out HBW for your copy of the latest construction data reports. To gain access to the HBW database and receive custom and detailed reports on the latest residential and commercial building activity in Florida, Georgia, Texas, Alabama, and Oklahoma, please contact HBW for details.
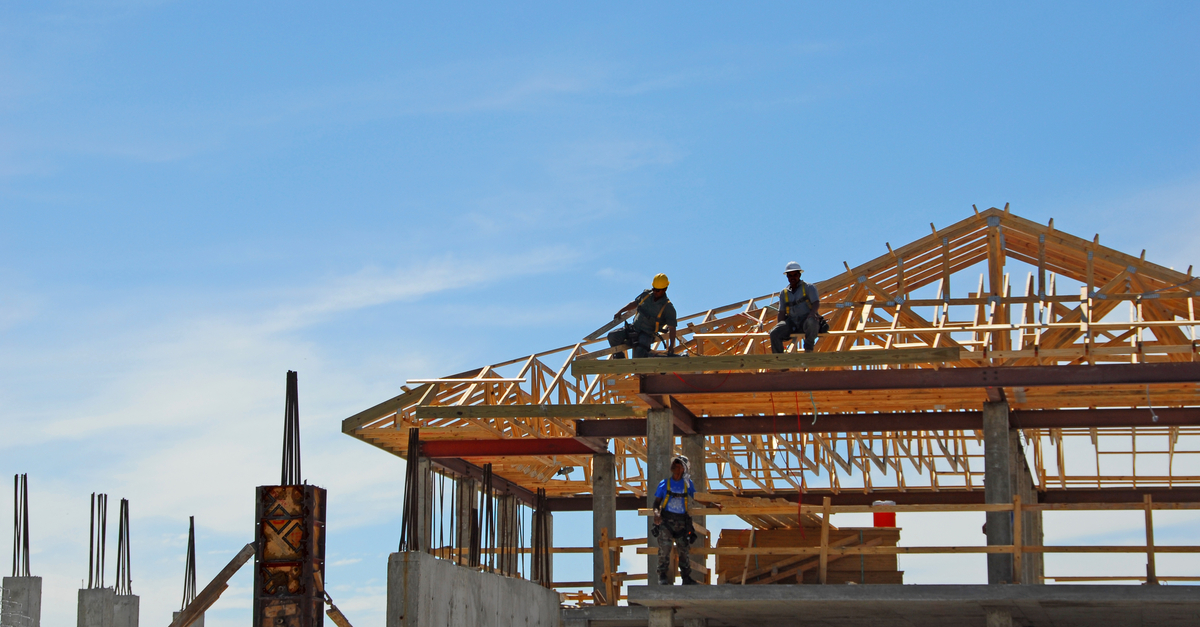
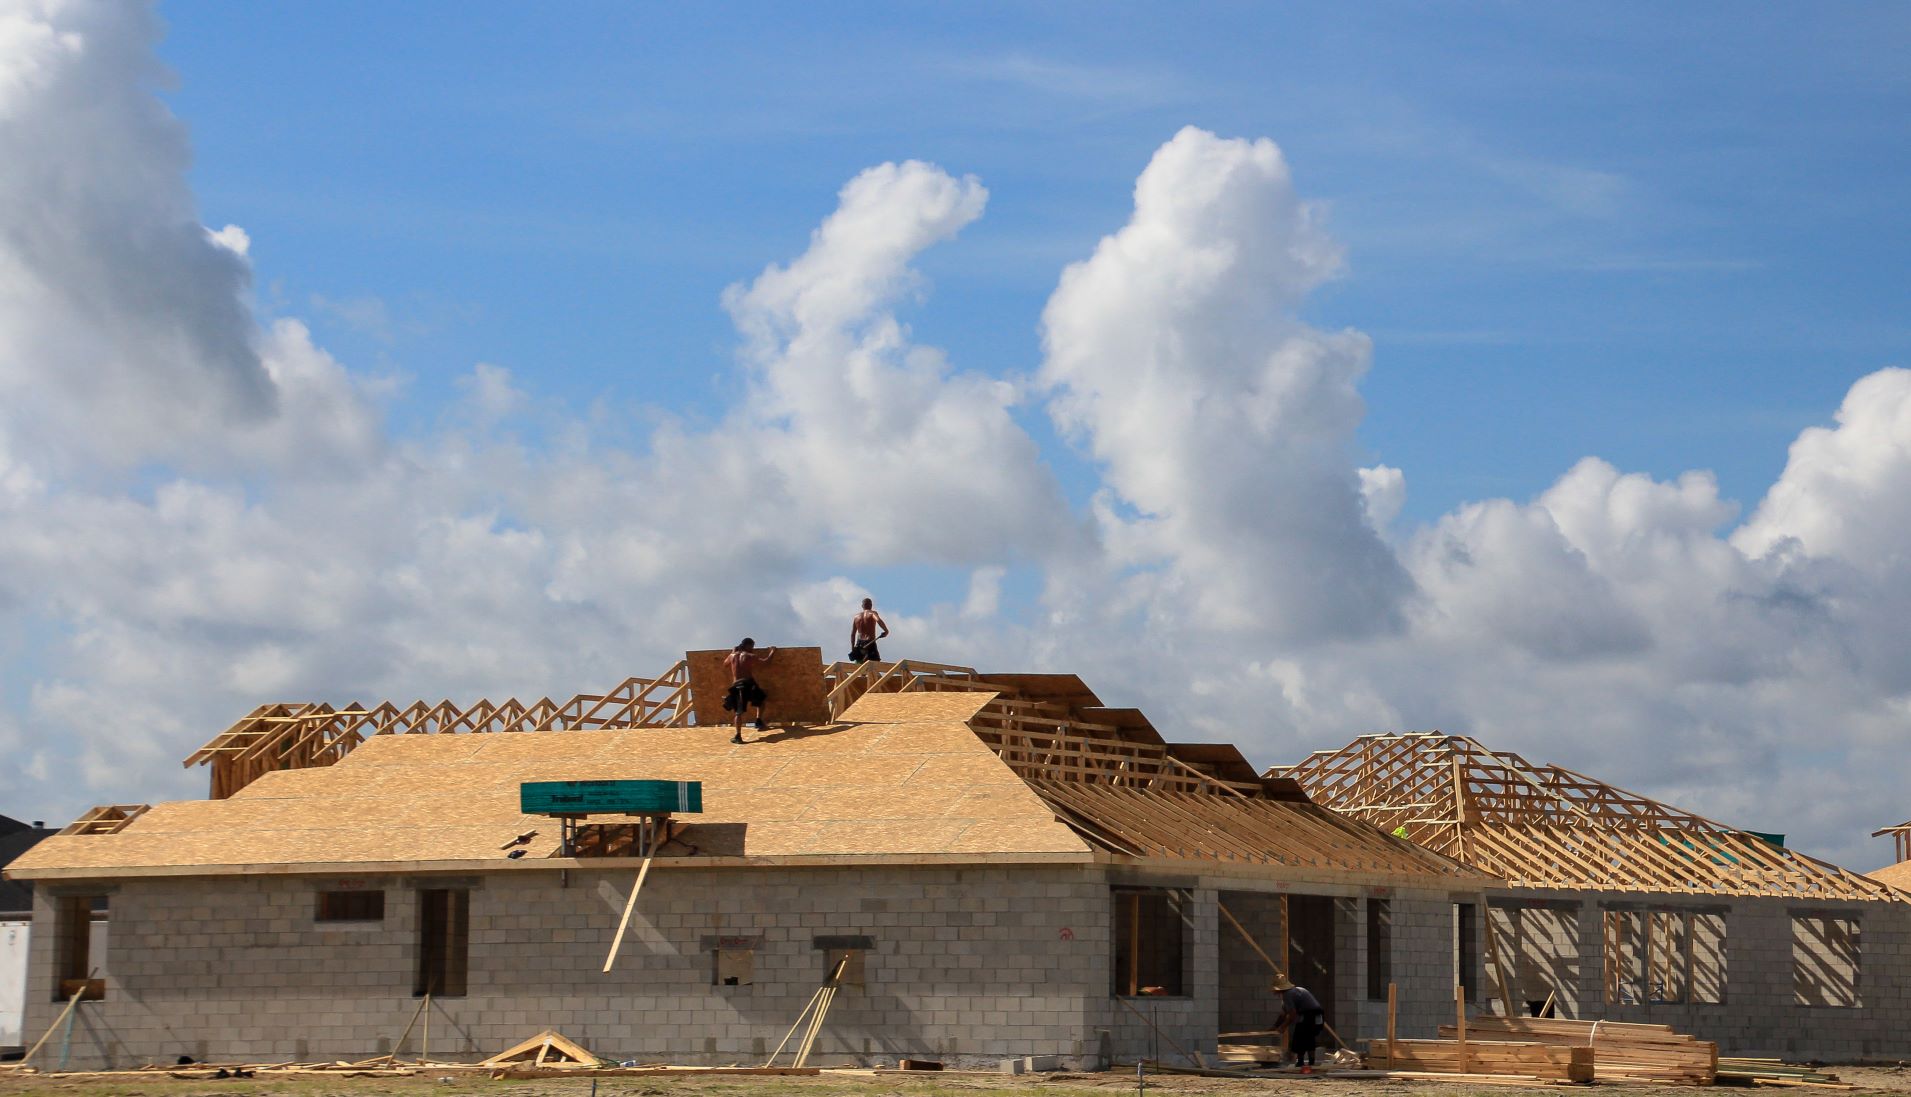
An overview of permit data for new residential construction in Florida during the month of August
Last month, there were just over 9,000 new residential construction permits with a total value in excess of $2.7 billion added to the HBW database for Florida; this reflects approximately a 20 percent month-over-month increase in new home construction activity.
Top Markets
Out of the five regions reviewed (Southwest, Tampa, Orlando, Jacksonville, Southeast), nearly 54 percent of all new home construction activity originated from the Southwest and Tampa areas last month where there were 2,495 and 2,351 new permits respectively. In addition to the Southwest and Tampa areas, higher levels of new residential construction activity could also be found in Orlando (1,674 permits), as well as Jacksonville (1,458 permits).
Leading Counties
Out of the five regions reviewed last month, there were several counties that carried higher levels of new residential construction activity; those counties include Lee County (963 permits) in the southwestern portion of the state, and Pasco County (664 permits) and Polk County (600 permits) in the Tampa area. Additionally, Duval County (Jacksonville) and Orange County (Orlando) exhibited greater concentrations of new home construction in comparison to other counties reviewed as there were 535 and 488 new permits on record for the one-month period respectively.
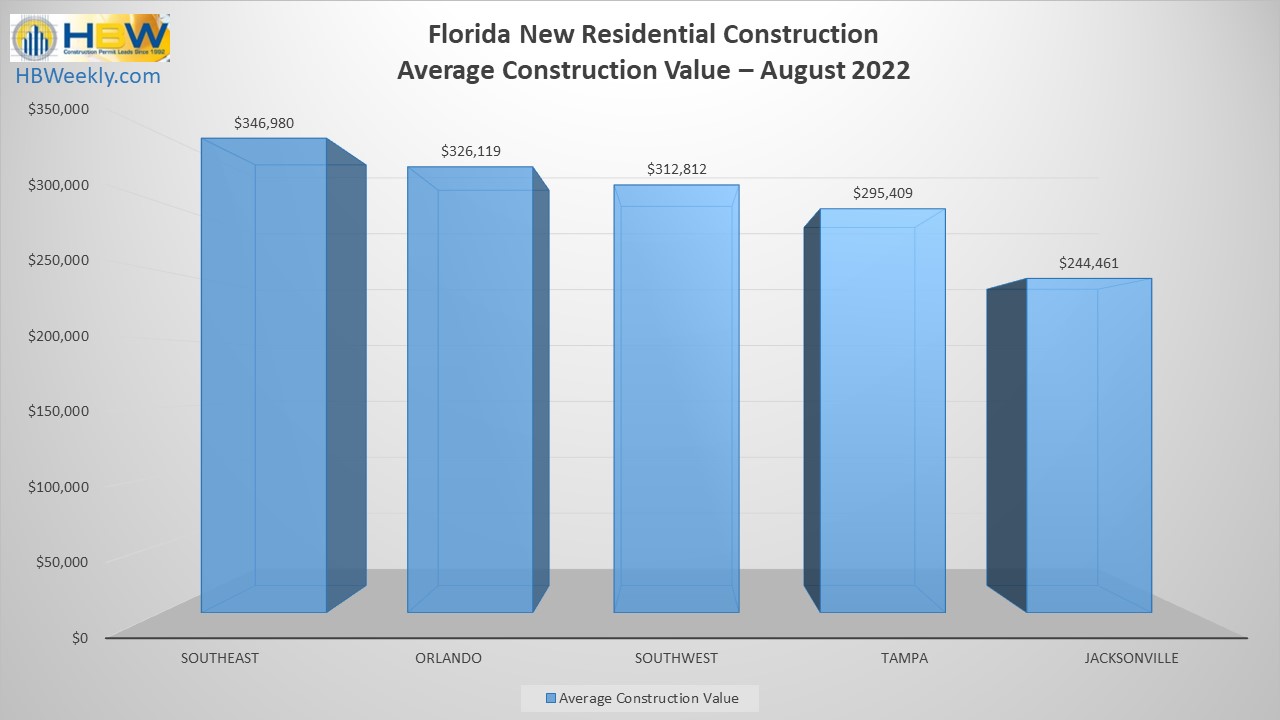
Average Value of Construction
During the month of August, the average value of new home construction across the Sunshine State ranged from a low of $244,461 (Jacksonville) to a high of $346,980 (Southeast). Here is a look at the average value of new home construction statewide during the month of August:
To gain more information on the builders, homeowners and permits for the construction activity above, check out HBW for your copy of the latest construction data reports. To gain access to the HBW database and receive custom and detailed reports on the latest residential and commercial building activity in Florida, Georgia, Texas, Alabama, and Oklahoma, please contact HBW for details.
A review of leading residential construction contractors in Texas during the month of August
Last week, we used HBW construction data reports to review the latest permit data for new residential construction in Texas; based on the latest reports, there were 7,515 new permits with a total value in excess of $2 billion added to the HBW database during the month of August.
As noted in the earlier post, there were hundreds of home builders with new permits on record last month, and D.R. Horton and Lennar Homes continued to hold major power in the market, having 1,139 and 696 new permits on record respectively. Other leading contractors with higher concentrations of new permitting activity throughout the state included KB Homes (239 permits) and Pulte Homes (253 permits).
Here is a closer look at the top five home builders in each major metro area of Texas, based on the total number of new permits added to the HBW database last month:
Houston
Last month, there were approximately 340 home builders with new permits on record in the Houston area, and the following ranked as the top five total new permits:
Builder
Total Permits
Average Value
1-D.R. Horton
483
$ 129,812.00
2-Camillo Properties
190
$ 147,790.00
3-Lennar Homes
188
$ 195,503.00
4-Meritage Homes
124
$ 248,597.00
5-Wan Pacific Real Estate Development
117
$ 165,044.00
Dallas
In Dallas, there were more than 290 contractors with new residential construction activity on record with HBW last month, and the following ranked as the top five for total new permits:
Builder
Total Permits
Average Value
1-D.R. Horton
555
$ 179,430.00
2-Lennar Homes
232
$ 202,318.00
3-Trophy Signature Homes
111
$ 274,016.00
4-Bloomfield Homes
97
$ 405,235.00
5-Meritage Homes
92
$ 267,425.00
Austin
Last month, there were nearly 125 home builders with new construction activity on record in the Austin area, and the following ranked as the top five for total new permits for the one-month period:
Builder
Total Permits
Average Value
1-Lennar Homes
150
$ 154,390.00
2-KB Homes
147
$ 253,606.00
3-D.R. Horton
99
$ 200,416.00
4-Taylor Morrison Homes
79
$ 365,183.00
5-David Weekley Homes
64
$ 436,978.00
San Antonio
In San Antonio, there were nearly 120 contractors with new residential construction activity on record last month, and the following ranked as the top five for total new permits:
Builder
Total Permits
Average Value
1-Lennar Homes
126
$ 174,315.00
2-KB Homes
55
$ 254,109.00
3-Pulte Homes
52
$ 241,012.00
4-M/I Homes
51
$ 237,283.00
5-LGI Homes
30
$ 202,760.00
To gain more information on the builders, homeowners and permits for the construction activity above, check out HBW for your copy of the latest construction data reports. To gain access to the HBW database and receive custom and detailed reports on the latest residential and commercial building activity in Florida, Georgia, Texas, Alabama, and Oklahoma, please contact HBW for details.