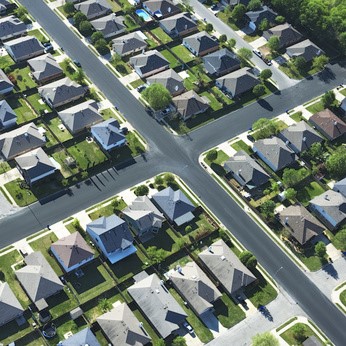
A review of permit data for new residential construction in the Metro Atlanta area during the first quarter of 2022
Earlier this week, we reviewed the latest construction data on record with HBW for new swimming pool construction in Atlanta; in the report, we recognized that the Metro Atlanta area has been off to a slower start when it comes to new pool construction, and when it comes to residential construction, it appears that the slow pattern continues.
Since the start of this year (through March), there has been a 24 percent year-over-year decline in new home construction, resulting in approximately 6,075 new permits being added to the HBW database. And while the Metro Atlanta area has experienced a decline in residential construction overall, there are some counties that have proven to hold steady or exhibit growth in the first quarter of this year (vs. Q1-2021); those counties include but are not limited to the following:
Dawson County (141 permits; +66 percent)
Dekalb County (237 permits; +9 percent)
Coweta County (265 permits; +5 percent)
Carroll County (150 permits; +95 percent)
Fayette County (187 permits; +17 percent)
When reviewing the latest HBW Building Activity Trend Report to identify areas with the highest levels of new residential construction activity, we found that there are five counties (out of 24 that make up the Metro Atlanta area) that carry approximately 47 percent of all new permitting activity; those counties are as follows:
Gwinnett County (814 permits)
Cherokee County (671 permits)
Cobb County (528 permits)
Fulton County (447 permits)
Henry County (383 permits)
Other Metro Atlanta counties that held a higher volume of new residential construction in the first quarter of this year include: Hall County (354 permits); Forsyth County (328 permits); and Paulding County (286 permits).
Information utilized for the above listed figures for Metro Atlanta residential construction was directly derived from HBW construction data reports. To gain access to the HBW database and receive custom and detailed reports on the latest residential and commercial building activity in Florida, Georgia, Texas, Alabama, and Oklahoma, please contact HBW for details.
A review of permit data for new swimming pool construction in the Metro Atlanta area through the first quarter of 2022
Based on HBW’s latest Swimming Pool Construction Activity Trend Report for the Metro Atlanta area, new swimming pool construction had a slow start in the first quarter of this year. From January through March 2022, there have been 1,043 new swimming pool permits added to the HBW database, reflecting a 9 percent decrease in new pool construction in comparison to the same period last year.
Out of the 24 counties that make up the Metro Atlanta area, there were several that carried the bulk of new pool construction activity; to be more specific, approximately 55 percent of all new swimming pool construction permits on record with HBW through Q1-2022 originated from the following five counties:
1-Fulton County (200 permits, 19% year-over-year decrease)
2-Cobb County (112 permits, 33% year-over-year decrease)
3-Cherokee County (102 permits, 13% year-over-year decrease)
4-Gwinnett County (81 permits, 30% year-over-year decrease)
5-Coweta County (76 permits, 21% year-over-year increase)
While there is a fairly significant difference when comparing quarterly (Q1) figures from 2021 and 2022, the truth is that it’s still too early to identify any real patterns or set any solid predictions for swimming pool construction for the remainder of the year solely based on permit totals. After all, over the last two to three years, the leading counties of Fulton, Cobb and Cherokee have exhibited year-over-year growth in new swimming pool construction ranging from a low of 5 percent to a high of 75 percent. That being stated, it has been reported that supply chain issues are expected to continue through the year, as well as labor shortages and increased labor costs; while these factors will impact the pace of growth, new construction of all types will continue to be challenged. With so many factors in play, HBW’s monthly construction data reports and activity trend reports will be useful in informing subscribers of the most updated and current status of new construction and permitting activity in their area.
As always, HBW will monitor, collect and report new permit data, as well as add the latest permits to its database, enabling us to report on growth and construction trends as we move forward through the year.
Information utilized for the above listed figures for Metro Atlanta swimming pool construction was directly derived from HBW construction data reports. To gain access to the HBW database and receive custom and detailed reports on the latest residential and commercial building activity in Florida, Georgia, Texas, Alabama, and Oklahoma, please contact HBW for details.
Here are a few more tips for keeping your target audience engaged and content interesting:
Be Relatable – While it is always important to maintain a sense of professionalism in your company’s social media posts, it is equally important to offer some relatable information about you, your company, your employees – your business. From personal stories and employee introductions to customer experience videos and statements, there are many ways to provide a personal touch when presenting your professional services.
Repost and Post UGC – What is UGC? It’s user-generated content. UGC is content that has been posted by your customers, ambassadors, corporate partners, employees, etc. about your company and brand. For example, a client may tag your company when posting about their new kitchen remodel, or a corporate partner may tag you in an industry event or project highlight. It is important that you take the time to “like” and recognize posts that recognize you, as well as reshare/repost so that prospects and clients can learn more about you through a third-party’s perspective. And although it goes without saying, you will only want to repost content that is favorable. In order to track and locate UGC, be sure to keep an eye out for social media mentions and include your branded hashtag on promotional materials so that you can easily search and find related content.
Answer Questions – You most likely have an FAQ section on your website, but not everyone who follows you on social media will view it. For this reason, it is important to provide answers to “Frequently Asked Questions” (FAQs) on social media. This is a good time to get ahead of questions that you know are coming down the pipe. For example, when COVID-19 hit, many people were asking businesses about their safety procedures – To be proactive and stay ahead of the guessing, many businesses published safety measures at the top of their social media profiles and websites. Only you will know what is asked from customers most often, so let them know that you are listening by answering a question or two. This type of post provides value to your audience and can help buyers make a decision, as well as create opportunity for you to highlight interesting features of your products or services.
There is no one-size-fits-all strategy for creating the perfect post, but by keeping social media content relevant, dynamic, and interactive, you will increase the likelihood of engaging current customers, as well as attracting new ones.
For more information on construction business marketing tips, stay connected with the HBW Blog. To get ahead of construction activity and gain access to the latest permitting data in Florida, Texas, Georgia, Alabama and Oklahoma, contact HBW for more information on construction data reports and industry leads.
Tips for making the most of your social media marketing efforts
As a construction professional, coming up with creative social media posts is most likely not your first priority. While you may be creative and have the aptitude and/or experience for developing unique and engaging content, chances are that you do not have time in your schedule to focus on it.
For this reason, we have compiled a quick list of various types of posts that you can create for your social media profiles. Whether you choose to be active on Facebook, Twitter, Instagram, YouTube, TikTok and/or all other platforms, it is important that you provide variety in the type of content you post in order to keep it “fresh”. Here are three (3) easy variations of social content that you may want to consider for your upcoming posts and overall social media marketing strategy:
Provide a “Walkthrough” – A “walkthrough” video, infographic or printable is a great way to familiarize your audience with your work and process. While a final product or build out may seem like the most obvious walkthrough content, there are other functions in your business that customers may be interested in understanding – For example, you may choose to explain the steps that a customer will go through from the start of a job to completion with your project manager or team; you may also conduct walkthroughs of specific services you offer or different products’ functions.
Survey Your Audience – There is no better way to get to know your audience then to ask them questions. In social media, such questions should be quick, easy, and entertaining. A good place to start is by asking questions in the form of “this or that” – preference questions. For example, you may post a side-by-side image of two similar products you offer or styles in your designs and ask the audience which one they prefer. This information not only allows you to form a loose connection with your audience, but it can also serve as informal market research to support more in-depth research you may already have in place.
Share Success Stories – While testimonials can serve as a powerful tool in building trust, client success stories take it a step further by providing a more personal touch. Success stories can be a great way to support some of your leading testimonials by offering background on a project. For example, you may have a story of recovery for a property that sustained hurricane damage; or you may have a client who had previously experienced failed attempts to renovate, and your company was able to meet their needs. There are multiple ways that success of your services or products may shine through, and all of them can serve as engaging content through blog posts, videos and/or images.
While the above listed content ideas are just a few of many, they can be used as a launching point for developing other ways to create variety in your social media posts. To keep audiences engaged, it is critical that you continue to generate new information in ways that keep them entertained, informed, and ultimately interested in hiring you for their next project.
For more information on construction business marketing tips, stay connected with the HBW Blog. To get ahead of construction activity and gain access to the latest permitting data in Florida, Texas, Georgia, Alabama and Oklahoma, contact HBW for more information on construction data reports and industry leads.
Resources and ideas for participating in OSHA’s National Safety Stand-Down in May 2022
If you haven’t already heard, OSHA’s 9th Annual, National Safety Stand-Down to Prevent Falls in Construction is scheduled from May 2-6, 2022.
So, what is a Stand-Down?
OSHA describes a Safety Stand-Down as a voluntary event for employers to talk directly to employees about safety. Anyone who wants to prevent hazards in the workplace is eligible to participate; to take part in the event, employers simply schedule some time between May 2nd and 6th to focus on Fall Hazards and reinforce the importance of Fall Prevention. By scheduling time specifically to focus on safety, employees are given a chance to discuss safety topics and talk to management about fall and other job hazards that may have come to their attention on a job site or in the workplace.
Why is it important?
According to OSHA’s website, “fatalities caused by falls from elevation continue to be a leading cause of death for construction employees, accounting for 351 of the 1,008 construction fatalities recorded in 2020 (BLS data). Those deaths were preventable. The National Safety Stand-Down raises fall hazard awareness across the country in an effort to stop fall fatalities and injuries.”
How do I conduct a Stand-Down?
Companies can conduct a Safety Stand-Down through a variety of methods… Employers may choose to integrate safety discussions and share resources through toolbox talks, staff meetings or other safety activities. Resources to help you get started include: Suggestions to Prepare for a Successful “Stand-Down” and Highlights from Past Stand-Downs.
Once employers have participated in the event, they may provide feedback to OSHA about their Stand-Down, as well as download a Certificate of Participation.
OSHA provides a number of useful tools and resources that employers can use to plan a successful event for the 2022 National Safety Stand-Down. To get started, here are a few links to access resources that are available now so that you have ample time to plan an event in May:
To learn more about the Stand-Down, visit OSHA’s webpage dedicated to the event here. Participation in the event has never been easier, and it can serve as a good starting point for developing and improving your current safety program now, and in the future.
A review of the leading home builders in Florida based on
new permits on record with HBW during the month of February 2022
In our most recent post, we reviewed the latest HBW
construction data reports for Florida and found that there were nearly 9,100
new residential construction permits added to the HBW database last month. Today, we are using the same reports to
review and identify the leading home builders that are driving residential
construction in each of the five major regions of Florida.
Statewide, there are two companies that have continued to
dominate the residential construction market month after month – Both D.R.
Horton and Lennar Homes carry a large share of new home construction in
Florida, and last month, the mega builders were responsible for more than 30
percent of all new permits on record with HBW, having 1,420 and 1,359 new
permits on record respectively.
Here is closer look at top five home builders in each of the
five regions of the Sunshine State based on the total amount of new permits added
to the HBW database during the month of February:
Southwest
In Southwest Florida, there were approximately 415
contractors with new home construction activity on record with HBW last month,
and the following ranked as the top five for total new permits:
Builder
Total
Permits
Average Value
1-D.R.
Horton
415
$
194,805.00
2-Pulte
Homes
329
$
186,031.00
3-Lennar
Homes
281
$
144,798.00
4-Taylor
Morrison
173
$
211,514.00
5-Neal
Communities of SW FL
111
$
227,433.00
Tampa
Last month, there were 255 contractors with new home
construction activity on record in the Tampa area, and the following ranked as
the top five for total new permits:
Builder
Total
Permits
Average Value
1-D.R.
Horton
389
$
257,320.00
2-Lennar
Homes
388
$
295,710.00
3-Pulte
Homes
101
$
283,432.00
4-Brandon
Construction Services
93
$
111,242.00
5-Homes
by West Bay
92
$
464,769.00
Orlando
In Orlando, there were approximately 170 home builders with
new residential construction activity on record in the Orlando area, and the
following ranked as the top five for total new permits:
Builder
Total
Permits
Average Value
1-D.R.
Horton
344
$
268,668.00
2-Lennar
Homes
313
$
279,368.00
3-Pulte
Homes
88
$
358,845.00
4-Minto
Communities
78
$
313,659.00
5-Taylor
Morrison
66
$
287,167.00
Southeast
Last month, there were nearly 145 contractors with new residential
construction activity on record with HBW for the southeastern region of Florida,
and the following ranked as the top five for total new permits:
Builder
Total
Permits
Average Value
1-Lennar
Homes
119
$
137,724.00
2-Pulte
Homes
98
$
346,446.00
3-GL
Building Corporation
78
$
352,688.00
4-Holiday
Builders
57
$
285,378.00
5-Synergy
Homes
42
$
145,266.00
Jacksonville
Last month, there were 145 contractors with new home
construction activity on record with HBW in the Jacksonville area, and the
following ranked as the top five for total new permits:
Builder
Total
Permits
Average Value
1-Lennar
Homes
258
$
241,810.00
2-D.R.
Horton
258
$
214,510.00
3-Dream
Finders Construction
140
$
237,770.00
4-Pulte
Homes
84
$
245,202.00
5-KB
Homes
84
$
130,238.00
To gain more information on the builders, homeowners and permits for the construction activity above, check out HBW for your copy of the latest construction data reports. To gain access to the HBW database and receive custom and detailed reports on the latest residential and commercial building activity in Florida, Georgia, Texas, Alabama, and Oklahoma, please contact HBW for details.
A review of new permit data for residential construction in Florida during the month of February 2022
Based on the HBW’s latest construction data reports, there
were nearly 9,100 new residential construction permits with a total value in
excess of $2.5 billion added to the HBW database for the Sunshine State last
month. Out of the five major regions reviewed (Southwest, Southeast, Tampa,
Orlando, Jacksonville), the southwest region held the highest concentration of
new residential construction (2,623 permits), while the southeast carried the
highest average value of new construction (average value: $317,909).
Here is a closer look at the total permits, average
construction value and leading counties for new home construction in the five
major regions of Florida:
Southwest
As previously noted, the southwest region ranked #1 for new
home construction last month as there were 2,623 new permits with a total value
of approximately $675.3 million on record with HBW. The average value of new
home construction landed on the lower end of the spectrum (average value: $257,459)
in comparison to other Florida regions reviewed, and more than half of all new permits
originated from the counties of Lee (775 permits) and Manatee (644 permits).
Tampa
Tampa ranked #2 for new home construction last month as
there were 2,403 new permits with a total value of nearly $694.5 million.
The average value of construction was $288,988, and more than half of all new
permits originated from the counties of Pasco (735 permits) and Polk (674
permits).
Orlando
The Orlando area ranked #3 for new home construction, having
more than 1,690 new permits with a total construction value of approximately $528.4
million last month. The average value of new home construction landed on
the higher end of the spectrum in Orlando (average value: $312,275) in
comparison to other Florida regions reviewed, and just about half of all new
residential construction permits originated from the counties of Lake (416
permits) and Orange (434 permits).
Jacksonville
Last month, there were more than 1,615 new residential
construction permits with a total value of nearly $400 million in the Jacksonville
area. The average value of construction was lowest in Jacksonville
(average value: $247,329) in comparison to other Florida regions reviewed, and
the majority of new home construction activity took place in St. Johns County
(661 permits) and Duval County (454 permits).
Southeast
Last month, the southeastern region of Florida carried the
lowest amount of new home construction activity in comparison to other Florida
regions reviewed; during the one-month period, there were 757 new permits with
a total construction value of approximately $240.7 million on record with HBW.
The average value of new home construction was highest in the southeast
(average value: $317,909) in comparison to other regions reviewed, and more
than half of all new residential construction activity took place in the two
counties of St. Lucie (325 permits) and Miami-Dade (153 permits).
To gain more information on the builders, homeowners and
permits for the construction activity above, check out HBW for
your copy of the latest construction data reports.
To gain access to the HBW database and receive custom and detailed reports on
the latest residential and commercial building activity in Florida, Georgia,
Texas, Alabama, and Oklahoma, please contact HBW for
details.
A review of permit data for new swimming pool
construction in the Sunshine State during the month of February 2022
Last month, there were approximately 2,590 new swimming pool
permits added to the HBW database for Florida; this figure reflects a 5 percent
month-over-month decrease in new pool construction.
Out of the five regions reviewed (Southwest, Tampa,
Southeast, Orlando, Jacksonville), the southeastern region ranked #1 for pool
construction, having more than 900 new permits on record for the one-month
period. On the other hand, while Jacksonville had the lowest level of new pool
construction last month (222 permits), the area carried the highest average
value of new permits (average value: $75,491).
Here is a closer look at the permit data, project values, leading
contractors, and new pool construction activity in each of the five major
regions of Florida during the month of February:
Southwest
As previously noted, the southwestern region of Florida held
the highest concentration of new pool construction activity last month, having
907 new permits with a total value of approximately $53.6 million on
record. The average value of
construction was $59,085, and more than half of all new permits originated from
the counties of Lee (291 permits) and Collier (205 permits).
Out of 200 pool builders with new construction activity on
record in the region last month, the following ranked as the top five for total
new permits:
Builder
Total
Permits
1-Aragon
Pools & Spas
99
2-Pinnacle
USA
49
3-Coast
to Coast Pools
40
4-Superior
Pools of SW Florida
28
5-Tropical
Pools & Spas of SW Florida
25
Tampa
Last month, Tampa ranked #2 for new pool construction,
having nearly 550 new permits with a total value of approximately $36 million
on record with HBW. The average value of
new pool construction was $65,400, and just about half of all new permits originated
from Hillsborough County and Polk County where there were 141 and 130 new
permits on record respectively.
Out of the more than 130 contractors with new swimming pool
construction activity on record in Tampa last month, the following ranked as
the top five for total new permits:
Builder
Total
Permits
1-Bob’s
Pool Service
62
2-The
Villages of Lake Sumter
50
3-Challenger
Pools
31
4-Tampa
Bay Pools
18
5-Patio
Pools
14
Southeast
Not far behind Tampa, the southeastern region of Florida
ranked #3 for new pool construction, having 490 new permits with a total value
of approximately $26.5 million on record with HBW. The average value of new construction was
lowest in the southeast (average value: $54,060) in comparison to other Florida
regions reviewed, and the bulk of permits originated from the two counties of
Palm Beach (150 permits) and Miami-Dade (147 permits).
Out of the approximately 200 contractors with new swimming
pool construction activity on record in the area last month, the following
ranked as the top five for total new permits:
Builder
Total
Permits
1-Fountain
Blue Pool Svc.
16
2-Crystal
Pools
15
3-Sunsational
Pools & Spa
15
4-Apex
Pavers & Pools
14
5-Endless
Summer Pools of Florida
13
Orlando
In Orlando, there were 420 new swimming pool construction
permits with a total value in excess of $26.6 million added to the HBW database
last month. The average value of
construction was $63,349, and more than half of all new permits originated from
the two counties of Orange (155 permits) and Brevard (80 permits).
Out of the nearly 95 contractors with new pool construction activity
on record in the area last month, the following ranked as the top five for
total new permits:
Builder
Total
Permits
1-All
Seasons
47
2-Dreamscapes
Pools & Spas
33
3-American
Pools & Spas
30
4-Bobs
Pool Service
21
5-Atlas
Pools of Central Florida
15
Jacksonville
Last month, there were 222 new swimming pool construction
permits with a total value of nearly $16.8 million added to the HBW database
for Jacksonville. As previously mentioned,
the average value of pool construction was highest in Jacksonville (average
value: $75,491) in comparison to other Florida regions reviewed, and the bulk
of new construction took place in the two counties of St. Johns (107 permits)
and Duval (44 permits).
Out of the approximately 75 pool builders with new
construction activity on record in the area last month, the following ranked as
the top five for total new permits:
Builder
Total
Permits
1-Pools
by John Clarkson
21
2-Palace
Pools
8
3-Waldhauer
& Son
8
4-Pools
& Spas of Central Florida
8
5-Epic
Pools & Hardscape Construction
7
To gain more information on the builders, homeowners and permits for the construction activity above, check out HBW for your copy of the latest construction data reports. To gain access to the HBW database and receive custom and detailed reports on the latest residential and commercial building activity in Florida, Georgia, Texas, Alabama, and Oklahoma, please contact HBW for details.
A review of the leading home builders in Texas based on
new residential construction permits added to the HBW database during the month
of February
Last week, we reviewed HBW’s latest construction data
reports to gain insight on the residential construction market in four major
metropolitan areas of Texas (Austin, Houston, Dallas, San Antonio). This week, we are using the same HBW reports
to sort through the hundreds of home builders with new permits on record for
the month of February to identify the contractors that are driving new home
construction throughout the Lone Star State.
Statewide, there are three major players in the market that have carried the greatest amount of new residential construction activity month after month – Last month, D.R. Horton ranked #1 in three out of four of the metro regions reviewed, having approximately 1,110 new permits on record with HBW. Next in line, Lennar Homes landed in the top five in almost all regions reviewed, having more than 480 new permits on record for the one-month period. And finally, Pulte Homes has also held strong, landing on the top five list in all areas except Houston last month with 337 new permits.
Here is a closer look at the top five home builders by region and based on the total number of new residential construction permits on record for the month of February:
Dallas
Out of the approximately 285 contractors with new residential
construction activity on record in the Dallas area last month, the following
ranked as the top five for total new permits:
Builder
Total
No
1-D.R.
Horton
363
2-Bloomfield
Homes
116
3-Lennar
Homes
99
4-Pulte
Homes
92
5-Highland
Homes
81
Houston
In Houston, there were more than 305 home builders with new
construction activity on record with HBW last month, and the following ranked
as the top five for total new permits:
Builder
Total
Permits
1-D.R.
Horton
549
2-Lennar
Homes
252
3-Perry
Homes
164
4-K
Hovnanian Homes
160
5-KB
Homes
145
San Antonio
Last month, there were approximately 115 active home builders
with new construction on record in the San Antonio area, and the following
ranked as the top five for total new permits:
Builder
Total
Permits
1-KB
Homes
81
2-Lennar
Homes
80
3-Pulte
Homes
76
4-D.R.
Horton
61
5-M/I
Homes
57
Austin
In Austin, there were 110 contractors with new residential
construction activity on record with HBW last month, and the following ranked
as the top five for total new permits for the one-month period:
Builder
Total
Permits
1-D.R.
Horton
136
2-Pulte
Homes
82
3-Perry
Homes
67
4-Milestone
Community Builders
60
5-Taylor
Morrison Homes
57
To gain more information on the builders, homeowners and permits for the construction activity above, check out HBW for your copy of the latest construction data reports. To gain access to the HBW database and receive custom and detailed reports on the latest residential and commercial building activity in Florida, Georgia, Texas, Alabama, and Oklahoma, please contact HBW for details.
A review of permit data for new residential construction
in Texas during the month of February 2022
Based on the latest HBW construction data reports, there
were approximately 7,620 new residential construction permits with a total
value of more than $2 billion added to the HBW database for Texas last
month. Out of the four metro areas
included in the report, Houston carried the highest concentration of new home
construction activity (3,291 permits), while Austin (average value: $321,877) held
the highest average value of new residential construction projects.
Here is closer look and breakdown of the total permits by
area, along with the average value of construction and leading counties in each
of the four metro areas of the Lone Star State last month:
Houston
Total # of Permits: 3,291
Average Value of Construction: $228,250
Top Counties (based on total
permits): Harris County (1,439 permits); Montgomery County (875 permits)
Dallas
Total # of Permits: 2,404
Average Value of Construction: $301,105
Top Counties (based on total
permits): Collin County (902 permits); Dallas County (455 permits)
Austin
Total # of Permits: 1,043
Average Value of Construction: $321,877
Top Counties (based on total
permits): Williamson County (488 permits); Travis County (467 permits)
San Antonio
Total # of Permits: 881
Average Value of Construction: $224,913
Top County (based on total permits): Bexar County (503 permits)
To gain more information on the builders, homeowners and permits for the construction activity above, check out HBW for your copy of the latest construction data reports. To gain access to the HBW database and receive custom and detailed reports on the latest residential and commercial building activity in Florida, Georgia, Texas, Alabama, and Oklahoma, please contact HBW for details.