5 Ways to Show Customer Appreciation

Tips for connecting and showing your appreciation to customers during the holiday season

With Thanksgiving behind us and the holidays ahead, there is no better time than now to express your appreciation to customers. While many businesses utilize the holidays to promote new products, sales, and exclusive deals, it is equally as important to take a moment to pause and connect with customers in a meaningful way. One of the easiest ways to make that connection is through recognition and appreciation.

For this reason, here are five ways to connect with your client base simply by saying “thanks”:

  1. Send a Card – While this one may seem obvious, there are important differences in the types of cards a business may send. When sending a card, we are referring to snail mail here, not an e-card. A personalized greeting received in the mail can often be a pleasant surprise for a customer. You can handwrite a personal letter of thanks or send a branded greeting card with a handwritten note to each customer on the back of the card or as an insert. The key is to be personal, authentic, and to let your customer know how much you appreciate their business and look forward to working with them in the new year.
  2. Shout it Out – If you are on social media, then now is the time of year to put your customers in the spotlight. You can do this by posting a letter of thanks and/or highlighting VIPs. For commercial clients, they would certainly appreciate a mention, backlink, and tag in a post. With social media you have room to get creative, and a little “thank you” can go a long way across your network.
  3. Make it Private (and exclusive) – Although you will most likely have some holiday offers for everyone this season, you can go a step further by offering private and exclusive deals to your top clients. Exclusive offers can be in the form of upgrades, as well as additional or deeply discounted products and services. When coming up with ideas, think of the this as your VIP club member benefits; the benefits should be greater than what you offer to the public, and they should only be available to a limited group of select customers.
  4. Deliver it – For some customers, a handwritten thank you letter or shout out on social media may just not be enough. For your top-tier clients, consider designing a branded gift basket to say thank you and happy holidays. The gift basket or package can be as simple or elaborate as you choose, and to make it extra special, have someone from your company hand deliver it when and if possible.
  5. Email it – In addition to the personalized greeting cards, design and send a “thank you” email to all clients and prospects. With email you will have the flexibility to add discount offers, links to pages and products of interest, as well as the ability to track activity and design customized templates for each market segment. This will also give you a chance to validate email addresses and update outdated contact information.

No matter how you choose to say “thanks”, your customers will appreciate a break from the last-minute holiday deals and sales to receive a sincere message of gratitude and happy holidays. Whether you choose to go with one or all of the above listed efforts to say “thanks” this season, you will be well on your way to nurturing customer relationships, while creating opportunities to connect with new clients in the coming year.

For more information on construction business marketing tips, stay connected with the HBW Blog.  To get ahead of construction activity and gain access to the latest permitting data in Florida, Texas, Georgia, Alabama and Oklahoma, contact HBW for more information on construction data reports and industry leads.

Florida Top Home Builders – October 2021

A review of the leading residential construction contractors in Florida based on permit data on record with HBW for the month of October 2021

Earlier this week, we reviewed new residential construction activity in the Sunshine State during the month of October 2021, and as a result we reported approximately 8,430 new residential construction permits with a total value of nearly $2.4 billion on record with HBW for the one-month period. This week, we are using the same construction data reports to identify the leading home builders driving housing starts in the five regions of Florida (Southwest, Tampa, Southeast, Orlando, Jacksonville).

Statewide, there are two home builders that have consistently dominated new residential construction – D.R. Horton and Lennar Homes. From the five regions reviewed, both builders carried more than 25 percent of all new home construction in Florida last month, having a combined total of 2,174 new permits. D.R. Horton ranked #1 with 1,321 total new permits, while Lennar Homes ranked #2 with 853 total new permits for the month.

Here is a closer look at the leading home builders by region, along with the total new permits on record and average value of construction for the month of October 2021:

Southwest

In the southwestern region of Florida, there were nearly 375 contractors with new residential construction permits on record with HBW for the month of October, and the following ranked as the top five for total new permits:

Builder Total Permits  Average Value
1-D.R. Horton 293  $      205,114.00
2-Lennar Homes 275  $      132,326.00
3-Pulte Homes 144  $      183,244.00
4-Taylor Morrison 116  $      231,901.00
5-Neal Communities of SW FL 82  $      211,392.00

Tampa

During the month of October, there were approximately 245 home builders with new permits on record in the Tampa area, and the following ranked as the top five for total new permits:

Builder Total Permits  Average Value
1-D.R. Horton 514  $      240,459.00
2-Lennar Homes 265  $      290,626.00
3-The Villages of Lake Sumter 228  $      297,222.00
4-Homes by West Bay 89  $      486,270.00
5-Pulte Homes 81  $      304,577.00

Southeast

In the southeastern region, there were more than 160 active home builders with new construction activity on record with HBW for October, and the following ranked as the top five for total new permits:

Builder Total Permits  Average Value
1-Lennar Homes 115  $      216,956.00
2-Thompson Thrift Construction 75  $      100,619.00
3-Toll Brothers 67  $      421,084.00
4-Kolter Signature Homes 64  $      375,272.00
5-D.R. Horton 62  $      188,572.00

Orlando

There were nearly 170 active home builders with new construction activity on record in the Orlando area during the month of October, and the following ranked as the top five for total new permits:

Builder Total Permits  Average Value
1-D.R. Horton 206  $      260,433.00
2-Lennar Homes 137  $      374,726.00
3-Pulte Homes 105  $      325,557.00
4-Taylor Morrison 76  $      303,338.00
5-Meritage Homes 72  $      154,439.00

Jacksonville

In the Jacksonville area there were approximately 145 active home builders with new construction activity on record with HBW during the month of October, and the following ranked as the top five for total new permits:

Builder Total Permits  Average Value
1-D.R. Horton 246  $      172,387.00
2-Richmond American Homes 132  $      300,817.00
3-KB Homes 121  $      143,400.00
4-Dream Finders Construction 78  $      278,595.00
5-Mattamy Homes 68  $      198,220.00

To gain more information on the builders, homeowners and permits for the construction activity above, check out HBW for your copy of the latest construction data reports. To gain access to the HBW database and receive custom and detailed reports on the latest residential and commercial building activity in Florida, Georgia, Texas, Alabama, and Oklahoma, please contact HBW for details.

HBW Report: Florida Residential Construction – October 2021

A review of permit data for new residential construction in Florida during the month of October 2021

Last month, there were approximately 8,430 new residential construction permits with a total value of nearly $2.4 billion added to the HBW database for Florida; this reflects a level construction activity that is consistent with figures from the previous month (September).

Out of the five regions reviewed (Southwest, Tampa, Orlando, Southeast, Northeast), the greatest amount of new home construction took place in Tampa, where there were 2,445 new permits for the one-month period. Not far behind, the southwest region and Orlando held high amounts of new construction having 2,336 and 1,410 new permits on record respectively. On the other hand, the areas with the least amount of new residential construction permits for the one-month period were Jacksonville (1,282 permits) and the southeastern region (956 permits).

When looking at the average value of new home construction, the southeast (average value: $342,059) held a higher value of new residential construction projects, while the lowest average value of permits could be found in Jacksonville (average value: $242,634).  Here is a closer look at the average value of new home construction across the Sunshine State last month:

While certain regions predictably held higher concentrations of new home construction, when looking at HBW’s construction data reports from a county-by-county perspective, there were pockets of highly active areas dispersed throughout the state. Based on total number of new permits on record with HBW last month, the following five counties ranked as the top five for total new permits and carried nearly 38 percent of all new home construction in the state:

#1. Lee County (Southwest) – 941 permits

#2. Polk County (Tampa) – 783 permits

#3. Hillsborough County (Tampa) – 585 permits

#4. Duval County (Jacksonville) – 448 permits

#5. Manatee County (Southwest) – 431 permits


To gain more information on the builders, homeowners and permits for the construction activity above, check out HBW for your copy of the latest construction data reports. To gain access to the HBW database and receive custom and detailed reports on the latest residential and commercial building activity in Florida, Georgia, Texas, Alabama, and Oklahoma, please contact HBW for details.
Florida Swimming Pool Construction Report – October 2021

A review of the latest permit data for new swimming pool construction in Florida during the month of October 2021

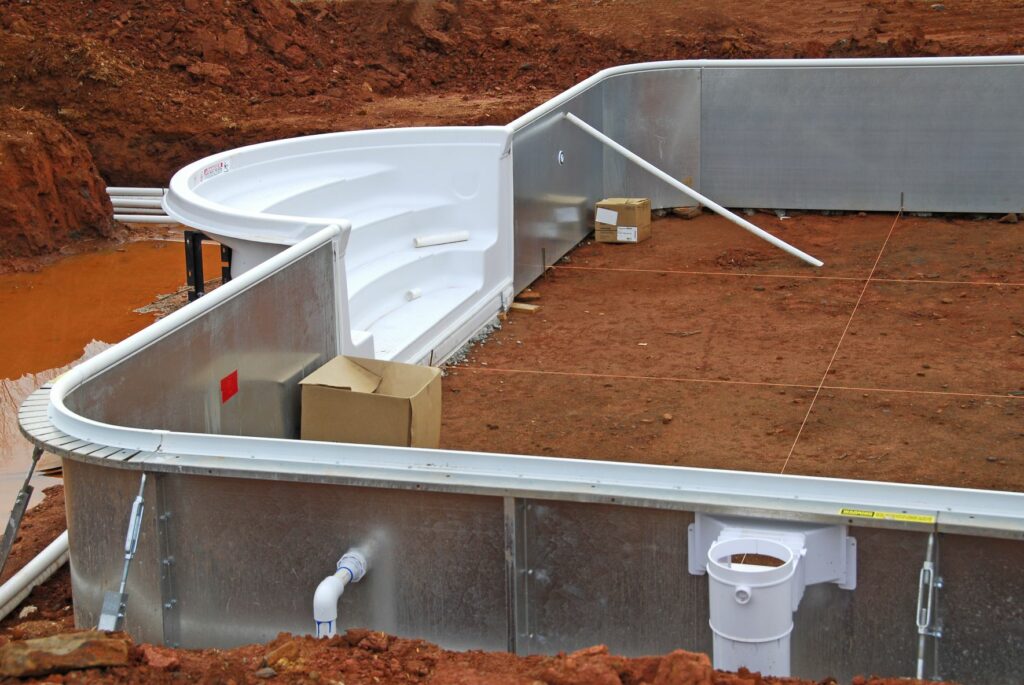
Based on the latest HBW construction data reports, there have been nearly 2,700 new swimming pool construction permits with a total value of approximately $155 million added to the HBW database for Florida last month. Out of the five regions included in the reports (Southwest, Tampa, Southeast, Orlando, Jacksonville), the southwestern region of the state held the greatest volume of new pool construction (953 permits), while the highest average value of new pool construction could be found in Jacksonville (average value: $70,880).

Here is a closer look at the total permits, average value, and the leading counties and contractors for new swimming pool construction in each of the five major regions of the Sunshine State during the month of October:

Southwest

Total Permits: 953 permits

Average Value of Construction: $54,502

Leading Counties (based on total permits): Lee (355 permits); Collier (224 permits)

Top 3 Pool Builders (based on total permits):

Builder Total Permits
1-Aragon Pools & Spas 111
2-Pinnacle USA 89
3-Coast to Coast Pools 37

Tampa

Total Permits: 533

Average Value of Construction: $64,465

Leading Counties (based on total permits): Hillsborough (169 permits); Pasco (135 permits)

Top 3 Pool Builders (based on total permits):

Builder Total Permits
1-Challenger Pools 50
2-Tropical Escapes Pool & Spa Construction 26
3-American Pools & Spas 24

Orlando

Total Permits: 379

Average Value of Construction: $57,410

Leading Counties (based on total permits): Orange (149 permits); Brevard (88 permits)

Top 3 Pool Builders (based on total permits):

Builder Total Permits
1-American Pools & Spas 28
2-Dreamscapes Pools & Spas 26
3-All Seasons 18

Southeast

Total Permits: 601

Average Value of Construction: $51,323

Leading Counties (based on total permits): Palm Beach (281 permits); Miami-Dade (163 permits)

Top 3 Pool Builders (based on total permits):

Builder Total Permits
1-Fountain Blue Pool Service 24
2-Champion Pools & Spas 20
3-Van Kirk Construction, Inc. 19

Jacksonville

Total Permits: 226

Average Value of Construction: $70,880

Leading Counties (based on total permits): St. Johns (85 permits); Duval (60 permits)

Top 3 Pool Builders (based on total permits):

Builder Total Permits
1-Pools by John Clarkson 20
2-Blue Haven Pools 15
3-Pools & Spas of Central FL 11

For more information on the builders, homeowners and permits for the construction activity above, check out HBW for your copy of the latest construction data reports. To gain access to the HBW database and receive custom and detailed reports on the latest residential and commercial building activity in Florida, Georgia, Texas, Alabama, and Oklahoma, please contact HBW for details.
Texas Top Home Builders – October 2021

A review of the leading home builders across Texas based on new permits on record with HBW during the month of October 2021

In our most recent post (“Texas Residential Construction Review”), we reviewed new residential construction permit data on record for Texas during the month of October and found that there had been a 4 percent month-over-month increase in new home construction. Using the same HBW construction data reports, today we are taking a deeper dive to identify the leading home builders that are driving residential construction in each of the four metro areas of Texas (Houston, Dallas, Austin, San Antonio).

Statewide, two leading home builders have and continue to dominate the market. D.R. Horton (1,044 permits) and Lennar Homes (468 permits) rank on the top five list in nearly every region reviewed, and combined they are responsible for just about 23 percent of all new home construction listed across Texas for the one-month period.

Here is a look at the top five contractors in each of the four metro areas of Texas based on the total number of new permits recorded by HBW last month:

Houston

Builder Total Permits  Average Value
1-D.R. Horton 569  $    171,398.00
2-Lennar Homes 202  $    180,141.00
3-Camillo Properties 138  $    112,764.00
4-Century Communities 136  $    129,593.00
5-Meritage Homes 119  $    247,485.00

Dallas

Builder Total Permits  Average Value
1-D.R. Horton 233  $    185,176.00
2-Lennar Homes 115  $    248,418.00
3-Camillo Properties 87  $    150,234.00
4-Highland Homes 72  $    294,875.00
5-Pulte Homes 72  $    209,338.00

San Antonio

Builder Total Permits  Average Value
1-Lennar Homes 96  $    168,142.00
2-Continental Homes of Texas 74  $    224,428.00
3-KB Homes 54  $    232,146.00
4-Pulte Homes 51  $    218,801.00
5-Camillo Properties 39  $    147,310.00

Austin

Builder Total Permits  Average Value
1-D.R. Horton 213  $     196,559.00
2-Pulte Homes 66  $     380,462.00
3-Meritage Homes 66  $     235,372.00
4-KB Homes 59  $     236,840.00
5-Lennar Homes 55  $     185,014.00


To gain more information on the builders, homeowners and permits for the construction activity above, check out HBW for your copy of the latest construction data reports. To gain access to the HBW database and receive custom and detailed reports on the latest residential and commercial building activity in Florida, Georgia, Texas, Alabama, and Oklahoma, please contact HBW for details.
Texas Residential Construction Review – October 2021

An HBW report on permit data for new residential construction in Texas during the month of October 2021

Based on HBW’s latest construction data reports, there were approximately 6,615 new residential construction permits with a total value of nearly $1.7 million added to the HBW database for Texas last month; this reflects a 4 percent month-over-month increase in new home construction.

Out of the four Texas regions reviewed, Houston carried the greatest volume of new home construction activity (2,855 permits), while the highest average value of residential construction projects could be found in Dallas (average value: $287,458).

Here is a closer look at new residential construction activity across the Lonestar State last month, including permits by area, average value of construction and leading counties for new home construction:

New Permits:

As previously noted, out of the four regions reviewed, the greatest amount of new residential construction permits originated from the Houston area, representing just about 43 percent of all new home construction across the state.  Here is breakdown of permits by region for the one-month period:

Average Value of Construction:

Last month, the average value of new home construction in Texas ranged from a low of $222,627 (Houston) to a high of $287,458 (Dallas). Here is a closer look at the average value of construction across Texas during the month of October:

Top Counties:

While new home construction was flourishing in each of the four metro areas of Texas, when reviewing reports county-by-county, there were five counties that carried more than 56 percent of all new residential construction activity in Texas last month; the five leading counties for new home construction are as follows:

1. Harris County (Houston): 1,391 permits

2. Montgomery County (Houston): 786 permits

3. Collin County (Dallas): 565 permits

4. Tarrant County (Dallas): 501 permits

5. Dallas County (Dallas): 482 permits


To gain more information on the builders, homeowners and permits for the construction activity above, check out HBW for your copy of the latest construction data reports. To gain access to the HBW database and receive custom and detailed reports on the latest residential and commercial building activity in Florida, Georgia, Texas, Alabama, and Oklahoma, please contact HBW for details.
Texas Swimming Pool Construction Report – October 2021

An overview of permit data for new swimming pool construction in Texas during the month of October 2021

Based on the latest construction data reports from HBW, there were approximately 845 new swimming pool permits with a total construction value in excess of $50.4 million added to the HBW database for Texas last month.  Out of the four metro areas covered in the report (Dallas, Houston, Austin, San Antonio), Dallas carried the greatest amount of new pool construction (371 permits), while the highest average value of new swimming pool construction could be found in Austin (average value: $75,493).

Here is a closer look at the latest permit data for new swimming pool construction in the Lone Star State during the month of October:

Dallas

As previously noted, Dallas carried the highest concentration of new swimming pool construction in comparison to other Texas metro areas reviewed, having 371 new permits with a total construction value of nearly $19.9 million last month. The average value of new pool construction landed mid-range ($53,563) in comparison to the other areas reviewed, and 55 percent of all new permits originated from the counties of Collin (107 permits) and Dallas (95 permits).

Out of 160 contractors with new pool construction activity on record for the Dallas area last month, the following ranked as the top three for total new permits:

Builder
1-Gold Medal Pools
2-Riverbend Pools
3-Claffey Pools Inc

Houston

Houston ranked #2 for new pool construction last month, having 296 new permits with a total construction value of nearly $20.9 million. The average value of new pool construction landed on the higher end of the spectrum (average value: $70,538) in comparison to other metro areas reviewed, and approximately 62 percent of all new permits originated from Harris County (181 permits).

Out of the nearly 135 pool builders with new permits on record within the Houston area last month, the following ranked as the top three for total new permits:

Builder
1-Anthony & Sylvan Pools
2-Platinum Pools
3-Cypress Custom Pools

San Antonio

Last month, there were 89 new swimming pool construction permits with a total value in excess of $3.1 million on record for the San Antonio area. The average value of construction was lowest in San Antonio (average value: $34,894) in comparison to other Texas areas reviewed, and 67 percent of all pool construction took place in Bexar County where there were 59 new permits during the one-month period.

Out of the 35 pool contractors with new construction activity on record in San Antonio last month, the following ranked as the top three for total new permits:

Builder
1-Keith Zars Pools
2-Blue Haven Pools
3-Gary Pools

Austin

In Austin, there were 87 new swimming pool construction permits with a total value of nearly $6.6 million during the month of October. As previously mentioned, the average value of construction was highest in the Austin area (average value: $75,493) in comparison to other areas reviewed, and 70 percent of all new pool construction took place in Travis County where there were 61 new permits for the one-month period.

Out of the more than 50 contractors with new pool construction on record in the Austin area last month, the following ranked as the top three for total new permits:

Builder
1-Anthony & Sylvan Pools
2-Denali Pools
3-Cody Pools


To gain more information on the builders, homeowners and permits for the construction activity above, check out HBW for your copy of the latest construction data reports. To gain access to the HBW database and receive custom and detailed reports on the latest residential and commercial building activity in Florida, Georgia, Texas, Alabama, and Oklahoma, please contact HBW for details.
Florida Residential Construction Review Q3-2021

A review of permit data on record with HBW for new home construction in Florida through the third quarter of 2021

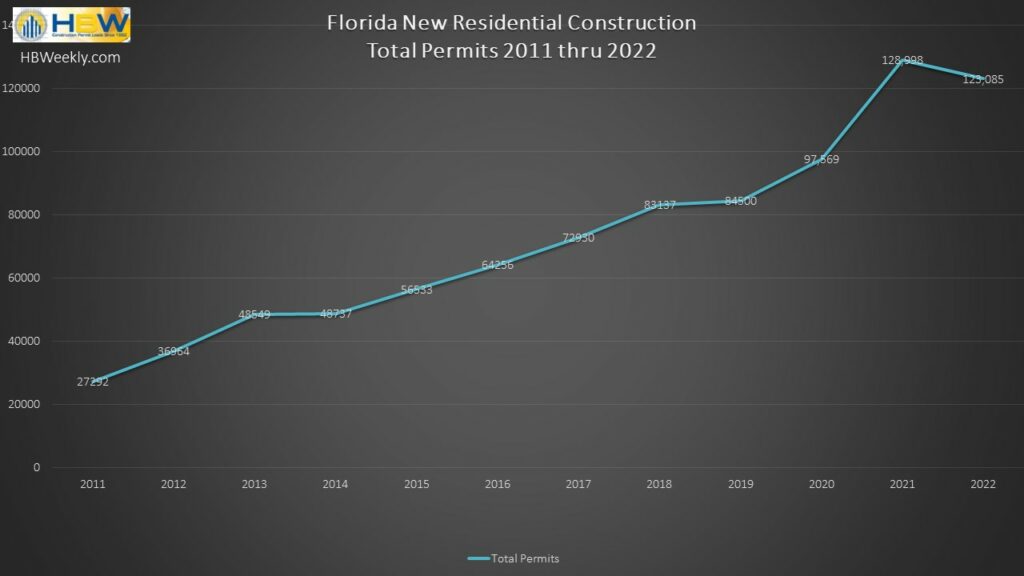
Over the last several years, the Sunshine State has exhibited annual increases in new home construction ranging from a low of 2 percent to a high of 15 percent, and so far this year the upward trend has continued.  From January through September of 2021, there has been a 43 percent increase in new residential construction permits in comparison to the same time last year, resulting in more than 99,800 new permits on record with HBW.

Out of the six regions reviewed, more than 45 percent of all new residential construction permits originated from the southwest and west where there were 22,993 and 22,287 permits on record through Q3 respectively.

Here is a closer look at the total permits, % year-over-year increase in residential construction (YTD), as well as the leading counties in each of the six Florida regions reviewed:

Southwest

In the southwestern region, there were 22,993 new permits through the third quarter of this year, reflecting a 78 percent increase in comparison to the same period last year. Out of the five counties that make up the southwest, Lee County (7,691 permits) held the highest concentration of new home construction activity.

West

Through Q3-2021, there have been 22,287 new residential construction permits added to the HBW database for the western region of Florida, reflecting a 40 percent year-over-year increase in new home construction. Out of the seven counties reviewed, the highest concentration of new permits originated from Polk County (7,207 permits) and Pasco County (6,916 permits)

Northeast

In Northeast Florida, there have been 19,094 new residential construction permits added to the HBW database through the third quarter of this year, reflecting a 51 percent increase in comparison to the same time last year. Out of the eight counties that make up the northeastern region, more than half of all new permits originated from the two counties of St. Johns (5,045 permits) and Duval (4,617 permits).

Central

Through the third quarter of this year, there have been 14,591 residential construction permits recorded for Central Florida, reflecting a 34 percent year-over-year increase in new home construction. Out of the six counties included in the Central Florida report, the highest concentration of new residential construction activity could be found in Orange County where there were 3,920 new permits on record for the 9-month period.

Northwest

In the northwestern region of Florida, there has been an 8 percent year-over-year increase in new home construction, resulting in 10,783 new permits on record with HBW. Out of the 18 counties that were included in the regional report, more than 50 percent of all new residential construction activity took place in Santa Rosa, FL (1,591 permits), Baldwin, AL (2,327 permits), and Bay, FL (1,505 permits).

Southeast

Through the third quarter of this year, there have been 10,055 new residential construction permits added to the HBW database for the southeastern region of Florida; this reflects a 39 percent year-over-year increase in new home construction. Out of the seven counties that make up the southeast, the County of St. Lucie (4,605 permits) carried the highest volume of new residential construction permits.


To gain more information on the builders, homeowners and permits for the construction activity above, check out HBW for your copy of the latest construction data reports. To gain access to the HBW database and receive custom and detailed reports on the latest residential and commercial building activity in Florida, Georgia, Texas, Alabama, and Oklahoma, please contact HBW for details.
HBW Quarterly – Florida Swimming Pool Construction Q3-2021

A review of permit data for new swimming pool construction in Florida through the third quarter of this year

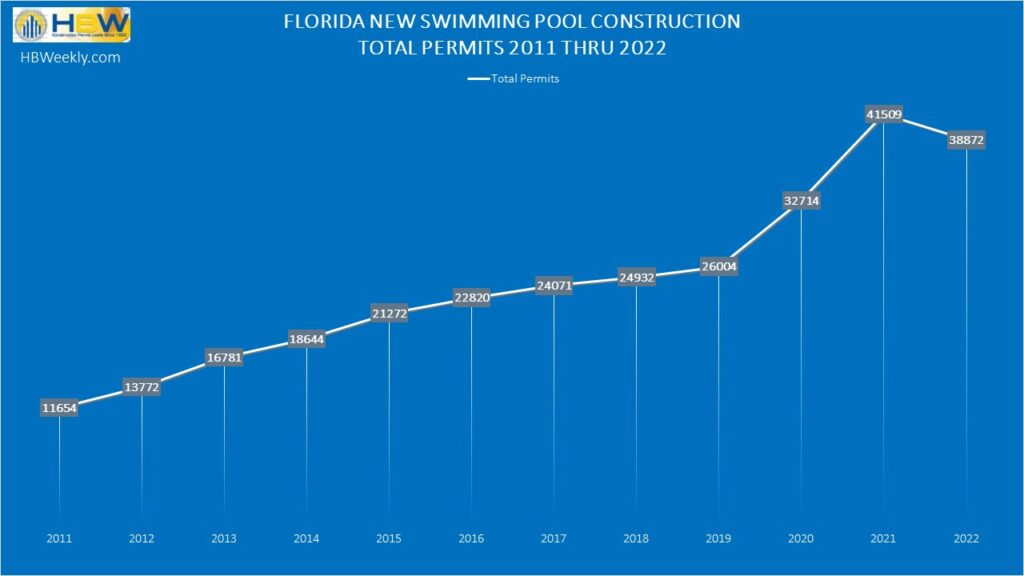
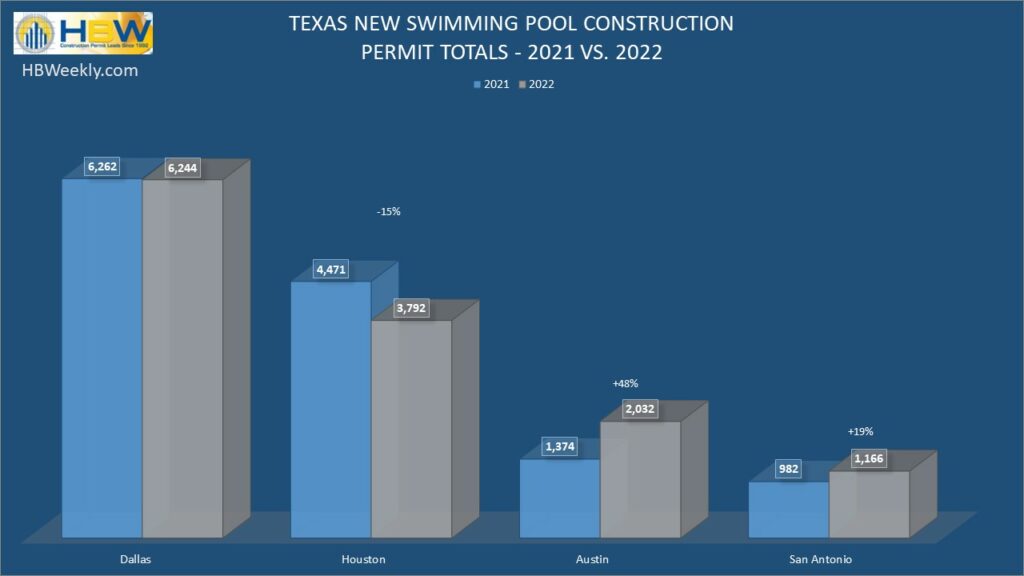
Swimming pool construction is on the rise in Florida. According to the Florida Swimming Pool Association, during 2020 the pool industry experienced an increase in demand, serving Floridians who were home and utilizing their backyards more than usual. “Interest in owning a swimming pool soared with a 23 percent increase in new pool permits over the prior year, the largest single-year increase in more than a decade.”  Based on HBW reports, this rising trend does not appear to be changing any time soon.

As evident in the latest HBW Swimming Pool Construction Activity Trend Report for Florida, there has been a 43 percent year-over-year increase in new swimming pool construction so far this year (thru Q3-2021), resulting in 32,170 new permits added to the HBW database. Out of the six major Florida regions reviewed (Southwest, Central, West, Southeast, Northeast, Northwest), the highest concentration of new pool permits could be found in the southwestern region of the state (10,749 permits); the southwestern region, along with the southeast, also exhibited the greatest gains in new pool construction as both areas had a 68 percent increase in new pool permits in comparison to the same time last year.

Here is a closer look at the total permits, growth rates and leading counties for new swimming pool construction across the Sunshine State through Q3-2021:

Southwest

Total Permits: 10,749

% Change YTD: +68 percent

Leading Counties for Total New Permits: Lee County (3,523 permits); Collier County (2,192)

Southeast

Total Permits: 6,238

% Change YTD: +68 percent

Leading Counties for Total New Permits: Palm Beach County (2,300 permits); Miami-Dade County (1,807 permits)

West

Total Permits: 5,316

% Change YTD: +25 percent

Leading Counties for Total New Permits: Pasco County (1,502 permits); Polk County (1,030 permits)

Central

Total Permits: 4,233

% Change YTD: +28 percent

Leading Counties for Total New Permits: Orange County (1,802 permits); Brevard County (823 permits)

Northeast

Total Permits: 3,069

% Change YTD: +27 percent

Leading Counties for Total New Permits: St. Johns County (1,187 permits); Duval County (584 permits)

Northwest

Total Permits: 2,565

% Change YTD: +6 percent

Leading Counties for Total New Permits: Santa Rosa County (530 permits); Walton County (327 permits)

To gain more information on the builders, homeowners and permits for the construction activity above, check out HBW for your copy of the latest construction data reports. To gain access to the HBW database and receive custom and detailed reports on the latest residential and commercial building activity in Florida, Georgia, Texas, Alabama, and Oklahoma, please contact HBW for details.
Texas Home Construction Review Q3-2021

A review of permit data on record with HBW for new home construction in Texas through the third quarter of 2021

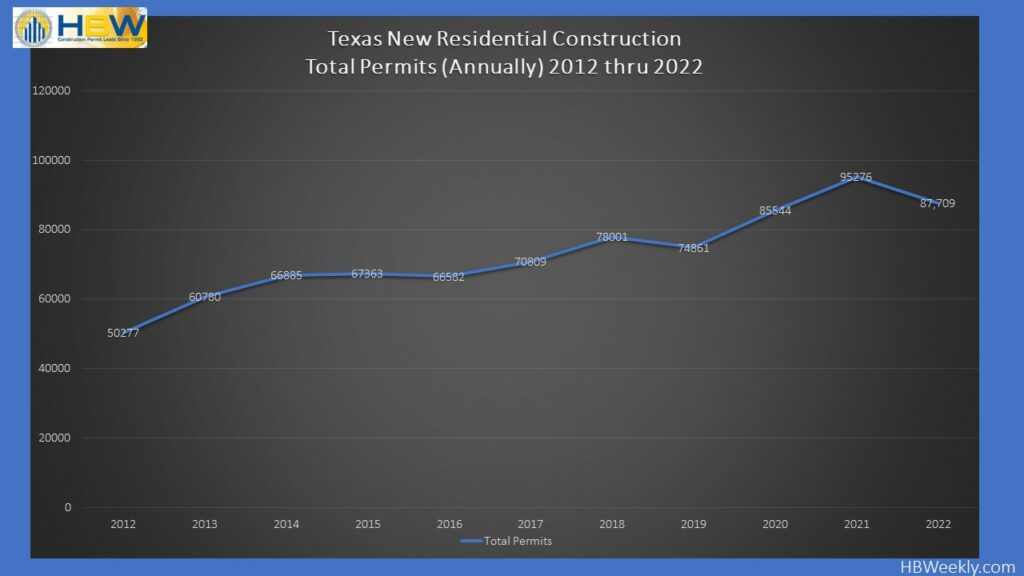
Since the start of this year, new home construction has been on the rise in the Lone Star State; in fact, housing starts are up by 18 percent in comparison to the same time last year.  Based on HBW’s latest Building Activity Trend Report for new residential construction in Texas, there have been more than 74,300 new permits added to the HBW database (thru Q3-2021) from the combined areas of Dallas, Houston, Austin, and San Antonio.

Out of the four metro areas reviewed, Houston (32,301 permits) carried the highest concentration of new residential construction activity, while Dallas held the greatest amount of higher value (>$500k) housing starts.

Here is a closer look at the total permits, leading counties and year-over-year growth rates for new home construction in Texas through Q3-2021:

Houston

As previously noted, Houston has carried the greatest concentration of new home construction activity, having more than 32,300 new permits on record with HBW through the third quarter of this year; this reflects a 19 percent year-over-year increase in new home construction.  Out of the five counties that make up the area, nearly half of all new permits originated from Harris County, where there were 16,005 new permits on record for the nine-month period.

Dallas

Since the start of this year (thru Q3), the Dallas area has experienced a 20 percent year-over-year increase in new home construction, resulting in approximately 24,675 new permits.  As previously noted, Dallas holds the greatest amount of higher value (> $500k) residential construction in comparison to other Texas regions reviewed, and so far this year there have been 1,567 higher value permits recorded for the area.  Out of the six counties factored into the Dallas report, the bulk of new home construction could be found in the counties of Collin (8,840 permits) and Tarrant (7,167 permits).

Austin

Through the third quarter of this year, there have been more than 10,525 new residential construction permits added to the HBW database for Austin; this reflects a 10 percent increase in comparison to the same time last year.  Out of the four counties that make up the area, nearly all new home construction could be found in the two counties of Travis and Williamson where there have been 4,890 and 4,325 new permits respectively.

San Antonio

Through the third quarter of this year, San Antonio has experienced an 18 percent year-over-year increase in new home construction, resulting in approximately 6,800 new permits on record with HBW.  Out of the three counties that make up the area, nearly half of all new residential construction activity took place in Bexar County where there have been 3,370 new permits on record for the given period.


To gain more information on the builders, homeowners and permits for the construction activity above, check out HBW for your copy of the latest construction data reports. To gain access to the HBW database and receive custom and detailed reports on the latest residential and commercial building activity in Florida, Georgia, Texas, Alabama, and Oklahoma, please contact HBW for details.