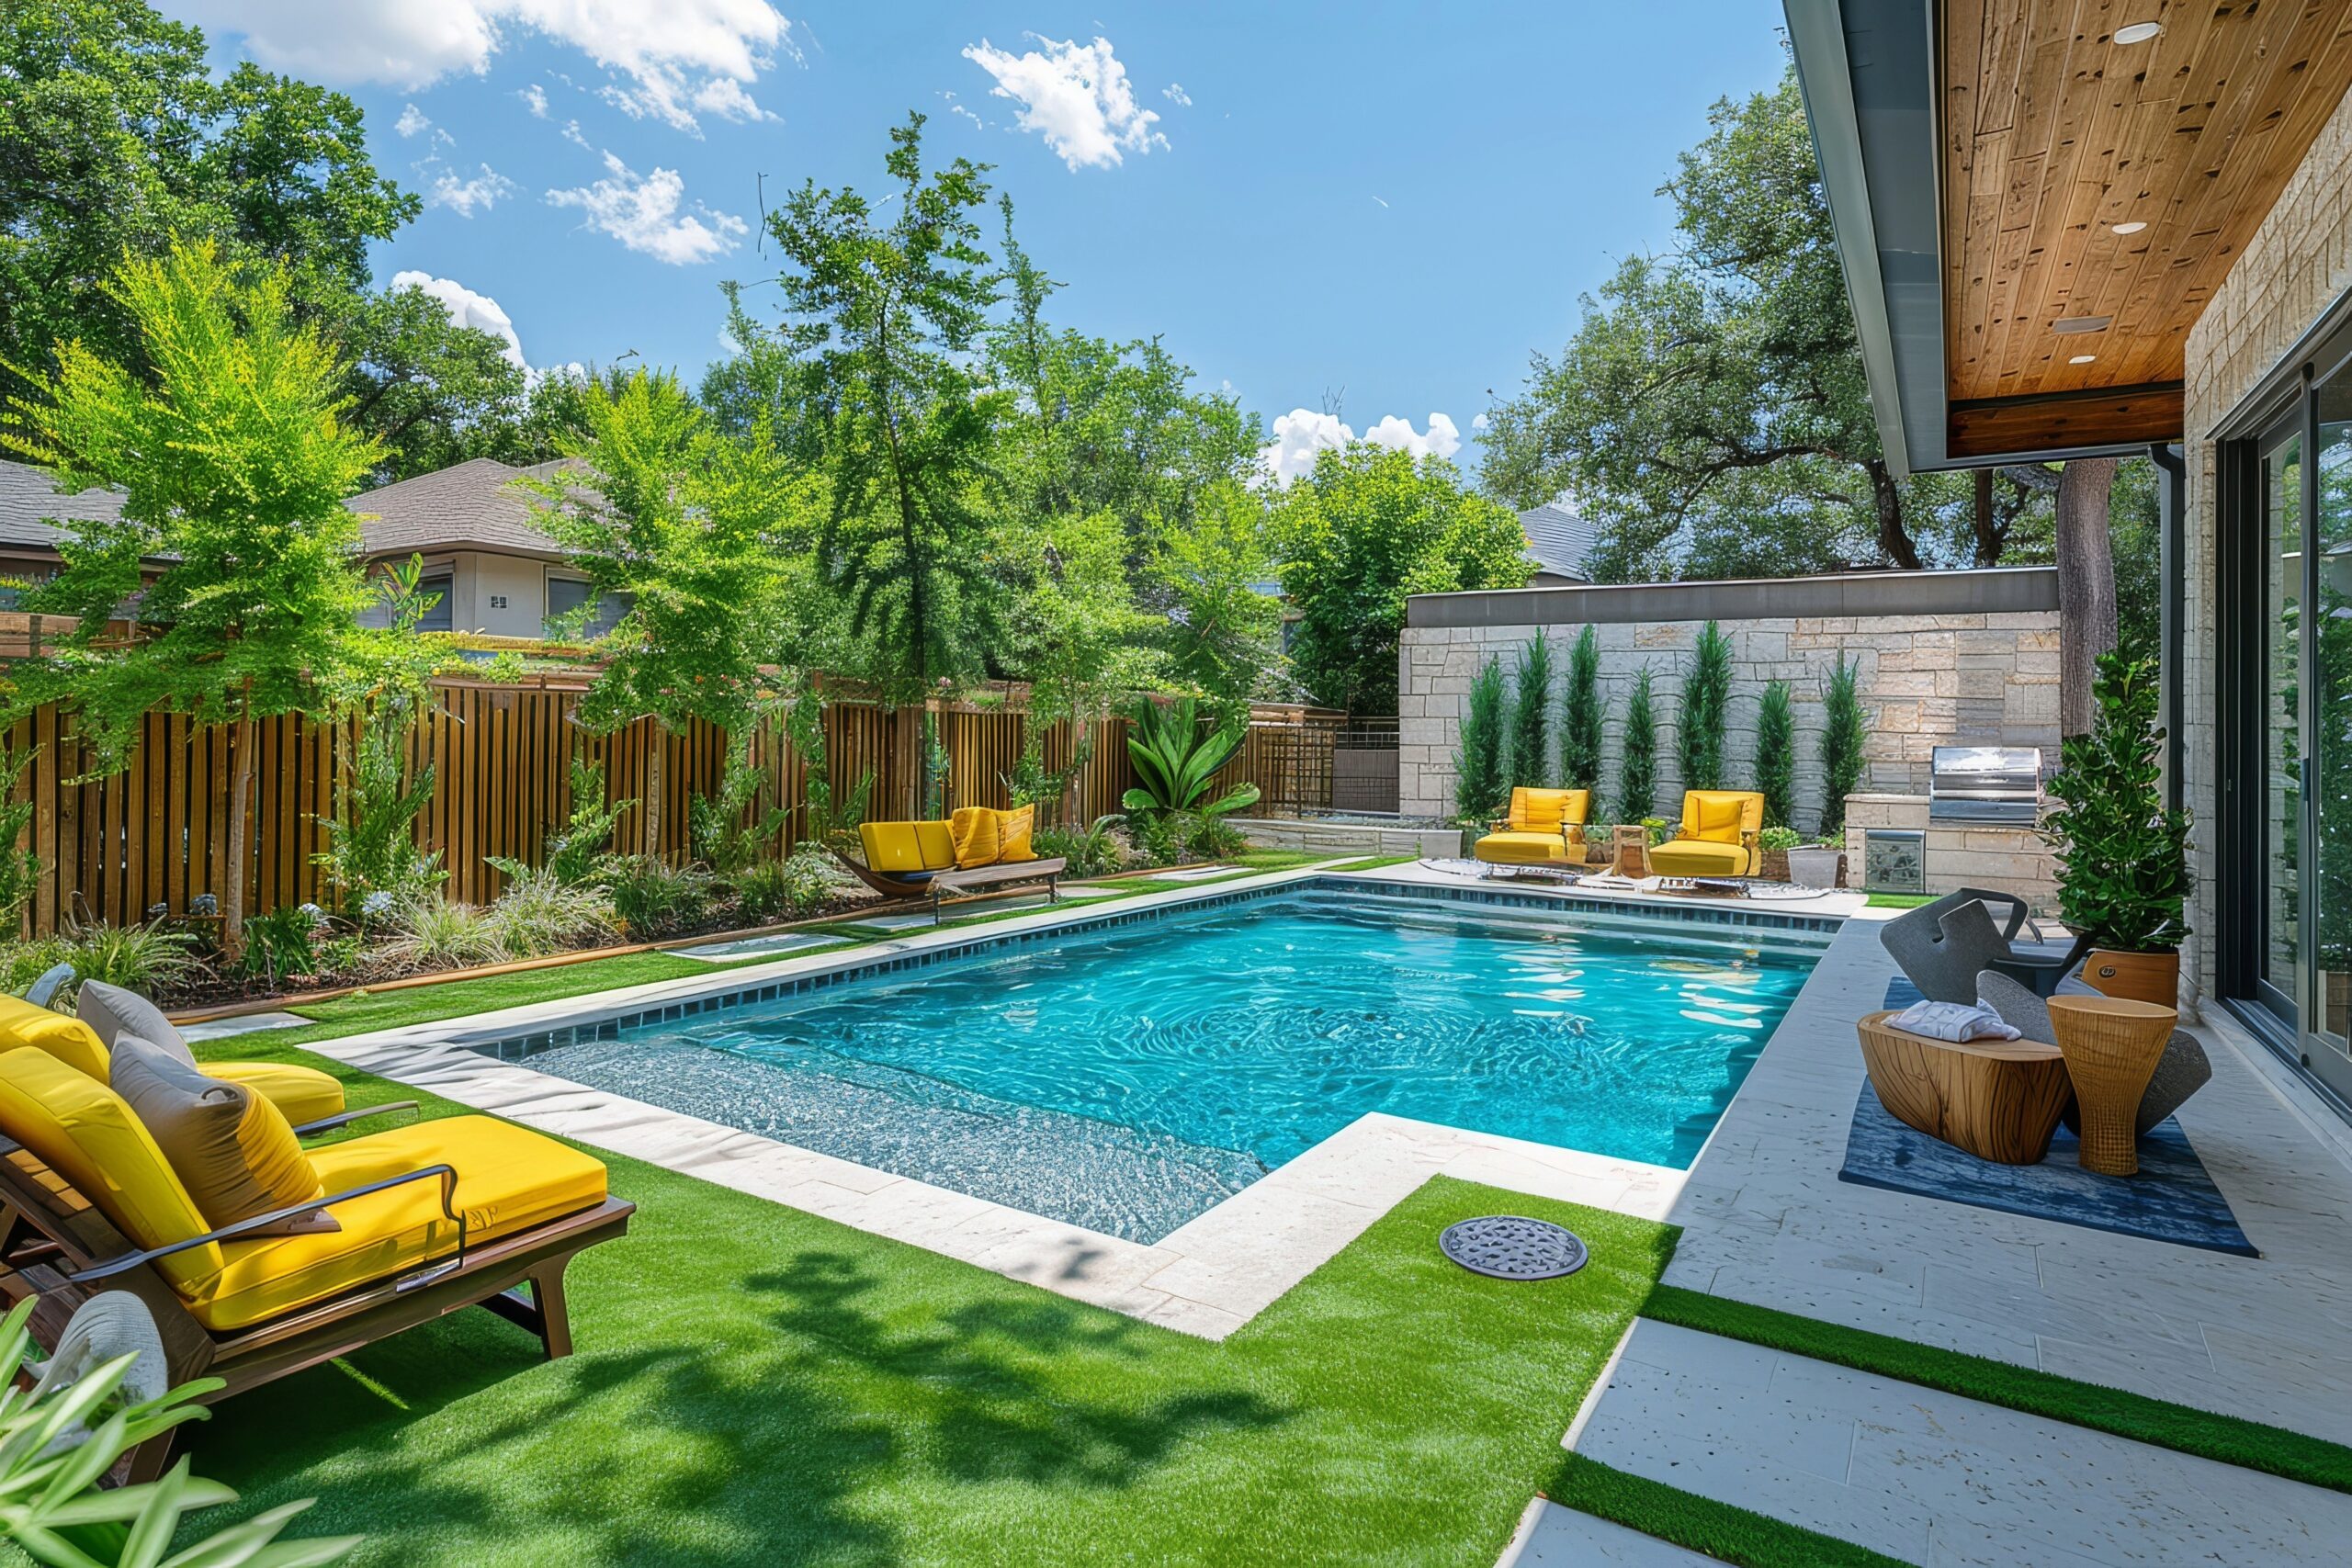
Florida New Swimming Pool Construction Report – July 2025

According to the latest construction data compiled by HBW, Florida experienced a measurable slowdown in new swimming pool construction during the month of July 2025. Across the five major regions tracked—Southwest, Southeast, Tampa, Orlando, and Jacksonville—a combined total of 2,087 new swimming pool permits were added to the books. This figure reflects a 15% month-over-month decline from the nearly 2,450 permits filed in June.

Despite the dip, new swimming pool construction continues to represent a strong segment of residential development in Florida, with total construction values surpassing $183 million for the month. Below is a closer look at permitting activity by region, along with the leading builders driving this sector:

Southwest Florida

  • Total Permits: 675
  • Total Value: $60.7M
  • Average Value: $89,958
  • Top Counties: Sarasota (148 permits), Lee (251 permits), Collier (109 permits)

The Southwest region led the state in pool construction activity, capturing nearly one-third of all new permits for July. While the average value per project was just under $90,000, the region’s sheer volume kept total value at the top statewide.

Leading builders (based on total permits) included:

  • Pinnacle USA – 62 permits, $4.83M total value
  • Aragon Pools & Spas – 47 permits
  • Coast to Coast Pools – 36 permits
  • Miromar Pools – 32 permits
  • Holiday Pools of West Florida – 23 permits

Southeast Florida

  • Total Permits: 431
  • Total Value: $33.8M
  • Average Value: $78,315
  • Top Counties: Palm Beach (143 permits), Miami-Dade (106 permits)

In Southeast Florida, there were more than 430 permits filed for the month of July. While the average value was lower than other regions reviewed, several high-profile builders set the pace:

  • Van Kirk Construction – 16 permits, $1.36M total value
  • A&G Concrete Pools – 13 permits
  • RHR Pools – 12 permits
  • Crystal Pools – 11 permits
  • Pools by Greg – 11 permits

Tampa

  • Total Permits: 401
  • Total Value: $40.8M
  • Average Value: $101,645
  • Top Counties: Hillsborough (128 permits), Pasco (86 permits)

Tampa reported more than 400 new pool permits, with an average value topping $100K, the highest average value compared to other Florida regions reviewed. Over 150 pool builders were active, though a handful stood out as market leaders:

  • Tampa Bay Pools on the Gulf – 18 permits, $1.70M total value
  • Cody Pools – 12 permits, $1.31M total value
  • Gulfstream Pools & Spas – 12 permits
  • Roden Pool Contracting – 11 permits
  • Patio Pools – 10 permits

Orlando

  • Total Permits: 373
  • Total Value: $29.0M
  • Average Value: $77,815
  • Top Counties: Orange (105 permits), Lake (76 permits)

Orlando’s pool market remained consistent, with nearly 140 builders contributing to the month’s activity. The market here showed one of the more modest average values statewide, though several top contractors continued to dominate permitting:

  • Dreamscapes Pools & Spas – 21 permits
  • All Seasons – 20 permits
  • Cody Pools – 14 permits, $2.04M total value (highest average value of the top five contractors at $146K)
  • Kura Design Pools – 12 permits
  • Grunit Pool Contractors – 10 permits

Jacksonville

  • Total Permits: 207
  • Total Value: $19.0M
  • Average Value: $91,787
  • Top Counties: Duval (41 permits), St. Johns (90 permits)

Although Jacksonville recorded the lowest overall volume among the five regions, its average value remained strong at just under $92,000. Out of 80 contractors with new construction on record for the month, the following emerged as the top five:

  • Agua Pools & Spas – 13 permits
  • Blue Haven Pools – 12 permits
  • Anthony & Sylvan Pools – 10 permits
  • Pools & Spas of Central Florida – 8 permits
  • Old Town Custom Pools – 7 permits

Statewide Trends

  • Total Permits: 2,087 (↓15% from June)
  • Total Value: $183.3M+
  • Average Value Statewide: Approximately $88K

While July reflected a noticeable month-over-month slowdown, the market is still performing at historically strong levels. Seasonal factors, including summer demand cycles and material/labor availability, likely contributed to the dip.

The data also highlights a continued concentration of activity in Southwest Florida, which accounted for nearly one-third of all permits issued. Meanwhile, Tampa’s high average value suggests a focus on larger-scale, higher-end projects compared to other regions.

With Florida’s ongoing population growth, strong housing market, and year-round outdoor lifestyle, demand for new swimming pools remains resilient. Contractors and suppliers should keep an eye out for shifts in average value per project as consumer preferences continue to trend toward luxury outdoor living spaces with integrated design features.

To gain more information on the builders, homeowners and permits for the construction activity above, check out HBW for your copy of the latest construction data reports. To gain access to the HBW database and receive custom and detailed reports on the latest residential and commercial building activity in Florida, Georgia, Texas, Alabama, and Oklahoma, please contact HBW for details.

Upcoming Industry Trade Shows & Conventions

Trade shows aren’t just “nice to have” line items; they are accelerators for pipeline, partnerships, and product intelligence. When planned properly, a single week on the floor can compress six months of BD into a few high-value meetings, sharpen your spec and procurement strategy, and surface new tech you didn’t know you needed.

For this reason, we have put together a list of events for the remainder of 2025 through March 2026, plus practical tips for planning.

Why do trade shows and expos matter for business development?

  • Dense decision-maker density: Owners, GCs, specialty subs, architects/engineers, and manufacturer reps are in one place; this set up can be ideal for account-based outreach, channel development, and partner enablement.
  • Faster technical due diligence: There is nothing like hands-on product demos to test out new products, and they certainly beat datasheets. You can compare systems (concrete, envelope, MEP, safety, project controls) side-by-side and talk to engineers on the spot.
  • Market intelligence: Keynotes and education tracks highlight code changes, decarbonization requirements, labor trends, and emerging delivery models.
  • Recruiting & brand: Career fairs, student programs, and competitions can help you fill roles and position your firm as a destination employer.

Planning Tips for Contractors

  1. Set clear project goals. Decide what you need most out of the show—whether that’s finding new suppliers, evaluating four estimating or scheduling platforms, or meeting 10 potential GCs or developers with upcoming work.
  2. Schedule meetings before you arrive. Use the exhibitor list and event portal to lock in 15-minute sit-downs with key vendors, technology providers, or project partners. Go in with a clear pain point or upcoming project need they can help solve.
  3. Plan your walk of the floor. If you have attended an expo, then you already know that the expo halls are massive. Highlight the booths most relevant to your trade (equipment, materials, tech, or safety) and group them by category so you can move efficiently. Remember to leave room for education sessions and networking events.
  4. Bring proof from the field. Instead of only handing out business cards, have other materials ready to share including real project photos, cost comparisons, safety metrics, or short video clips of your crews in action. It makes your work tangible and memorable.
  5. Capture and tag every lead. For each conversation, jot down who they are (GC, supplier, owner), what type of projects they work on, and how soon they’re buying or bidding. This makes follow-up far more effective.
  6. Act fast when you return to the office. Within a week, review leads, add them into your pipeline, and share new product or process ideas with your operations team. Decide what to stop, continue, or start doing based on what you learned at the show.

Now that you have an outline for planning ahead, here are a few events worth considering in the coming months:

September 2025

  • NECA 2025 Convention & Trade Show (Electrical Contractors)
    Dates/Location: Sept 12–15, 2025 — Chicago, IL
    Description: Stated as the “#1 Event for Power, Light, and Communication Technology”, it serves as the flagship for electrical construction—tools, prefabrication, BIM/VDC, safety, estimating, and service-contracting. The event includes education and a large expo floor.
    Official site: https://www.necaconvention.org/

October 2025

  • Procore Groundbreak (Construction Technology & Operations)
    Dates/Location: Oct 14–16, 2025 — Houston, TX
    Description: As described on the website, “Groundbreak brings together global leaders and industry experts who are setting a new standard for construction… connecting the innovators, problem-solvers, and visionaries driving our industry forward with cutting-edge solutions and breakthrough technologies.”
    Official site: https://www.procore.com/groundbreak

November 2025

  • Greenbuild International Conference + Expo
    Dates/Location: Nov 4–7, 2025 — Los Angeles, CA
    Description: The world’s largest annual event for green building professionals – Codes and standards updates, embodied carbon, electrification, healthy materials, and ESG—plus a broad product expo.
    Official site: https://informaconnect.com/greenbuild/

January 2026

  • World of Concrete
    Dates/Location: Exhibits: Jan 20–22, 2026; Education: Jan 19–22, 2026 — Las Vegas Convention Center, NV
    Description: WOC is the industry’s only annual international tradeshow dedicated to the commercial concrete and masonry construction industries and is the largest concrete/masonry event in North America.
    Official site: https://www.worldofconcrete.com/en/home.html

February 2026

  • AHR Expo
    Dates/Location: Feb 2–4, 2026 — Las Vegas Convention Center, NV
    Description: The AHR Expo brings the entire HVACR (Heating, Ventilation, Air Conditioning, and Refrigeration) industry together to showcase cutting-edge products and technologies, gain insights from industry leaders, foster cross-disciplinary collaboration, and drive business and career growth.
    Official site: https://www.ahrexpo.com/

  • NAHB International Builders’ Show (IBS) + KBIS
    Dates/Location: Feb 17–19, 2026 — Orlando, FL
    Description: NAHB International Builders’ Show® (IBS) and the NKBA Kitchen & Bath Industry Show® (KBIS) are co-locating during Design & Construction Week (DCW) at the Orange County Convention Center.
    Official site: https://www.buildersshow.com/design-and-construction-week

March 2026

  • CONEXPO-CON/AGG
    Dates/Location: Mar 3–7, 2026 — Las Vegas Convention Center, NV
    Description: With 2,000 exhibitors and 150 education sessions, this event is considered to be North America’s largest construction show.
    Official site: https://www.conexpoconagg.com/

  • New York Build
    Dates/Location: Mar 18-19, 2026 — New York, NY
    Description: With more than 40k attendees and 500+ exhibitors, this event is New York’s largest construction and design show.
    Official site: https://www.newyorkbuildexpo.com/

For more information on construction industry updates and business tips, stay connected with the HBW Blog.  To get ahead of construction activity and gain access to the latest permitting data in Florida, Texas, Georgia, Alabama and Oklahoma, contact HBW for more information on construction data reports and industry leads.

Notes on links & planning

All event names above are linked to their official websites after each listing so you can confirm details, register, and book housing directly. Dates and locations are current as of August 28, 2025; organizers occasionally adjust schedules, so check the event sites when finalizing travel.

Using Building Permit Data to Boost Content Marketing

We all know the saying: content is king. In fact, according to the Content Marketing Institute, 87% of B2B marketers reported that content marketing helped them create brand awareness in the last year. It drives SEO, builds trust, boosts engagement, and positions your business as the authority your customers turn to for reliable insights. But here’s the question: how do you keep your content not just consistent, but also relevant, timely, and uniquely valuable?

For construction professionals, the answer might be right in front of us—building permit data.

Why Content Marketing Matters in Construction

Content marketing in the construction industry isn’t just about promoting your services. It’s about providing thought leadership, educating your audience, and positioning your business at the forefront of industry knowledge. Whether you’re a builder, supplier, subcontractor, or service provider, content is your way to showcase your expertise while building trust.

Think of it like pouring the foundation for a building—without a strong base, nothing else holds. Content marketing serves as that base, creating the visibility and authority that keep your business competitive in a crowded marketplace.

The Untapped Value of Building Permit Data

As construction professionals, we already use permit data to evaluate market activity, track competitors, and identify new opportunities. But the value of this data extends far beyond internal strategy—it can become one of the most powerful tools in your content marketing arsenal.

Here’s how:

1. Spotting Market Trends

Building permit data reflects the pulse of construction activity in your area. Are more single-family homes being permitted this quarter compared to last? Is commercial construction slowing while pool construction is surging? These insights can fuel articles, blog posts, and even social media updates that position your company as the go-to resource for understanding local market dynamics.

Example: “Residential permits in [Your Region] are up 12% this quarter—here’s what it means for homebuyers and subcontractors.”

2. Creating Hyper-Local Content

One of the strongest SEO strategies is to produce content that speaks directly to your local market. Building permit data provides the raw material. If your region is seeing a boom in new residential communities, you can write about neighborhood development, infrastructure growth, or what this means for suppliers and contractors in that region.

This type of content is not only relevant but highly searchable, making it a powerful driver of organic traffic.

3. Educating Your Audience

Most homeowners, investors, and even small business owners don’t have access to or knowledge of how to interpret building permit reports. By breaking this information down into digestible, engaging content, you provide real value—whether you are explaining permitting trends, offering insight into construction cycles, or forecasting where demand is headed.

In other words, you become the translator between raw industry data and practical insights.

4. Demonstrating Authority and Expertise

Sharing data-driven insights shows that your business isn’t just following the market—you’re analyzing it. By weaving building permit statistics into your newsletters, blogs, or LinkedIn updates, you are essentially elevating your voice as a thought leader. And in a B2B environment, that kind of authority builds trust—and ultimately, business.

5. Supporting Visual Content

Data is perfect for infographics, charts, and quick-hit visuals that perform exceptionally well on social media. A graph showing year-over-year permit growth or a heat map of active regions can generate more engagement than a text-only post. Construction professionals (and most of us) are visual thinkers—so why not let the data tell a story?

Turning Data into Marketing Gold

The key is not to just present numbers, but to contextualize them. Numbers on their own are raw materials—much like concrete or steel. Content marketing is the design-build process that shapes those raw materials into a finished product your audience finds useful and compelling.

  • Blog Articles: “Top 5 Residential Growth Hotspots Based on New Permit Activity.”
  • Social Media Posts: “Did you know? Commercial permits in [City] grew by 20% last month.”
  • Newsletters: Market trend summaries with clear takeaways for clients or partners.
  • Whitepapers/Reports: Long-form content that establishes your brand as an industry authority.

While content marketing drives engagement, SEO, and business growth, building permit data is the key to providing unique insights that make your content stand out in a sea of generic marketing. By pairing marketing strategy with the deep market knowledge, you can create content that not only informs—but also inspires action.

In short, if content is king, then building permit data is the crown jewel you didn’t know you had right at your fingertips.

For more information on construction business marketing tips, stay connected with the HBW Blog.  To get ahead of construction activity and gain access to the latest permitting data in Florida, Texas, Georgia, Alabama and Oklahoma, contact HBW for more information on construction data reports and industry leads.

Florida’s Top Home Builders – July 2025

According to the latest construction data reports released by HBW, Florida experienced steady new residential construction activity in July 2025, with thousands of building permits added to the pipeline across its major metropolitan regions. The data, which reflects total new permits, overall construction value, and average value of residential construction projects, provides key insights into the homebuilding market throughout the state.

Below is a breakdown of the top-performing builders in each of the five major Florida regions: Southwest, Tampa, Orlando, Southeast, and Jacksonville.


Southwest Florida

In the southwestern region, there were 1,589 new residential construction permits on record for July, reflecting an average construction value of $346,150. Out of 370 contractors with new permits, the following builders held the highest total volume:

  • Lennar Homes – 198 permits | $47.63M total value | Avg. $240,567
  • Pulte Homes – 138 permits | $25.32M total value | Avg. $183,451
  • Taylor Morrison – 77 permits | $16.23M total value | Avg. $210,816
  • Stratos Construction – 50 permits | $9.15M total value | Avg. $183,026
  • M/I Homes – 43 permits | $8.51M total value | Avg. $197,853

Tampa

The Tampa market led the state in overall permit volume, with 1,981 new residential construction permits during July and an average value of $358,980. Out of nearly 240 builders on record, the following companies topped the list for total permits:

  • Lennar Homes – 469 permits | $171.36M total value | Avg. $365,369
  • D.R. Horton – 187 permits | $61.61M total value | Avg. $329,444
  • Pulte Homes – 109 permits | $50.92M total value | Avg. $467,125
  • Taylor Morrison – 102 permits | $41.50M total value | Avg. $406,846
  • The Villages of Lake Sumter – 76 permits | $13.30M total value | Avg. $175,000

Orlando

In the Orlando area, HBW reported 1,294 housing starts for July, with an average construction value of $382,255. Out of nearly 165 active contractors, the leading builders by permit volume included:

  • Pulte Homes – 144 permits | $61.89M total value | Avg. $429,806
  • Lennar Homes – 96 permits | $35.19M total value | Avg. $366,591
  • M/I Homes – 90 permits | $39.67M total value | Avg. $440,743
  • D.R. Horton – 83 permits | $23.25M total value | Avg. $280,178
  • Adams Homes – 59 permits | $23.34M total value | Avg. $395,590

Southeast Florida

The southeastern portion of the state carried 693 new residential construction permits in July, with the highest regional average value statewide at $480,370. Out of approximately 140 contractors, the following ranked at the top five for total new permits:

  • Lennar Homes – 185 permits | $26.53M total value | Avg. $143,418
  • GL Building Corporation – 115 permits | $92.66M total value | Avg. $805,717
  • Pulte Homes – 33 permits | $13.70M total value | Avg. $415,043
  • D.R. Horton – 32 permits | $7.43M total value | Avg. $232,218
  • KH East Coastal FL Homes – 28 permits | $10.91M total value | Avg. $389,714

Jacksonville

In the Jacksonville area, there were 715 new residential construction permits with an average value of $279,823. Out of the 105 builders with new permits on record, the leaders were:

  • Lennar Homes – 97 permits | $19.81M total value | Avg. $204,211
  • Dream Finders Homes – 78 permits | $14.77M total value | Avg. $189,329
  • Pulte Homes – 45 permits | $12.05M total value | Avg. $267,857
  • American Classic Homes – 35 permits | $3.83M total value | Avg. $109,429
  • Richmond American Homes – 30 permits | $7.65M total value | Avg. $255,097

Statewide Summary

Across the five major regions of Florida, there were more than 6,270 new residential construction permits issued in July 2025, reflecting billions in total construction value. Lennar Homes continued to dominate statewide, leading permit totals in nearly every region, while Pulte Homes, D.R. Horton, and Taylor Morrison held strong market shares across multiple areas. The highest average construction values were concentrated in the Southeast region, where luxury and custom developments drove project values upward. Meanwhile, the Tampa market was positioned as the most active in terms of sheer volume, recording nearly 2,000 permits in just one month.

To gain more information on the builders, homeowners and permits for the construction activity above, check out HBW for your copy of the latest construction data reports. To gain access to the HBW database and receive custom and detailed reports on the latest residential and commercial building activity in Florida, Georgia, Texas, Alabama, and Oklahoma, please contact HBW for details.

Top Home Builders in Texas – July 2025

According to the latest construction data reports from HBW, Texas exhibited a month-over-month dip but maintained some momentum in residential construction activity during July 2025. Across the four major metropolitan regions—Houston, Dallas, Austin, and San Antonio—more than 5,350 new residential construction permits were added to the HBW database for the month, with a total construction value in excess of $1.7 billion.

The leaders in volume reflect both national production builders and strong regional players, with D.R. Horton and Lennar Homes continuing to dominate statewide activity.

Houston

Houston remained the most active market statewide, accounting for just over 2,700 new residential permits with a combined construction value of approximately $797 million.

  • D.R. Horton led all builders with 473 permits valued at more than $116 million, averaging $246k per unit.
  • Lennar Homes followed closely with 439 permits and an aggregate value exceeding $106 million.
  • Perry Homes (125 permits; avg. $321k) and David Weekley Homes (103 permits; avg. $306k) also ranked prominently.
  • Taylor Morrison rounded out the top five with 81 permits, averaging $281k per home.

Houston’s high activity underscores its role as a significant housing market in the Lone Star State, with notable contributions from both national and regional builders.

Dallas

The Dallas area added 1,575 permits in July, with a total construction value of $596.8 million and an impressive average value of nearly $379k—the highest among major Texas metros.

  • D.R. Horton once again held the top spot with 173 permits valued at nearly $56 million.
  • Ranked second for the region was listed only as “Permit Office Will Not Provide” with 154 permits.
  • Lennar Homes (92 permits; avg. $287k), Meritage Homes (79 permits; avg. $177k), and First Texas Homes (60 permits; avg. $448k—the highest average out of the top five in Dallas for the month) completed the top five list.

Dallas continues to reflect higher per-unit construction values for the most part, consistent with demand for larger square footage and upgraded residential designs.

Austin

In Austin, nearly 80 builders contributed to 588 new permits, representing a total value of approximately $210 million and an average value of $357k.

  • KB Homes led with 49 permits, totaling nearly $16.8 million.
  • Chesmar Homes (41 permits; avg. $372k) and D.R. Horton (38 permits; avg. $243k) followed closely behind.
  • Brookfield Residential Texas Homes stood out with an average value of nearly $398k, the highest among Austin’s top builders for the month, and had 35 new permits on record for the one-month period.
  • Pulte Homes ranked fifth with 34 permits, averaging $362k.

The Austin market has demonstrated solid demand for mid- to upper-value homes, with a concentration of permits in the $340k–$400k range.

San Antonio

San Antonio reported more than 490 new residential construction permits in July, totaling approximately $110 million in value.

  • Lennar Homes dominated the market with 121 permits, followed by KB Homes with 59 permits.
  • Continental Homes of Texas (31 permits), M/I Homes (19 permits), and Perry Homes (18 permits, avg. $346k) rounded out the top five.

While San Antonio reflected the lowest average construction value among the major metros at $224k, the market remains active in entry-level and first-time buyers.

Statewide Perspective

Across all four metropolitan regions combined, the Texas residential construction market in July 2025 recorded:

  • 5,356 permits
  • $1.7+ billion total value
  • ~$320k average value

D.R. Horton and Lennar Homes were clear statewide leaders, maintaining significant presence in every major metro. Regional builders such as Highland Homes, Chesmar Homes, and Perry Homes also demonstrated strong market share, particularly in select markets.

Overall, Houston led in volume, Dallas in average value, Austin in balanced mid-to-upper tier demand, and San Antonio in affordability-driven activity. The statewide data on home builders reflects both national and regional builders strategically positioning themselves to capture demand across diverse product types and price points.

To gain more information on the builders, homeowners and permits for the construction activity above, check out HBW for your copy of the latest construction data reports. To gain access to the HBW database and receive custom and detailed reports on the latest residential and commercial building activity in Florida, Georgia, Texas, Alabama, and Oklahoma, please contact HBW for details.

Texas New Swimming Pool Construction – July 2025 Summary

According to the latest HBW construction data reports, there were more than 480 new swimming pool construction permits in Texas added to the HBW database for the month of July. The reports pull permit data recorded from the four major metro areas of Houston, Dallas, Austin, and San Antonio. Statewide, and the regional breakdown is as follows:

Houston

The Houston metropolitan area continued to lead the state in July, recording approximately 180 new swimming pool construction permits. These projects carried a total construction value of $17.4 million, resulting in an average value of $97,194 per pool—well above the statewide average. Harris County accounted for the majority of activity, with 124 new permits for the month.

Dallas

In the Dallas area, new pool construction mirrored Houston’s strong output, with 183 permits issued in July and a total construction value of nearly $11.6 million. The average value per project was $63,175, suggesting a more mid-range market profile compared to Houston. Activity was concentrated in Collin County (54 permits) and Denton County (55 permits), reflecting the ongoing suburban growth and residential development occurring north of the city.

Austin

The Austin metro market generated 84 new pool construction permits during the month, with a total value in excess of $5.2 million. The average value per pool was $62,452, aligning closely with Dallas in terms of project value. Travis County dominated the regional totals with 73 permits, indicative of strong residential demand within the city and its immediate suburbs.

San Antonio

San Antonio posted more modest figures, with nearly 35 new swimming pool permits valued at over $1.5 million in July. The average construction value was $46,061, marking the lowest among the four metros reviewed and suggesting a higher proportion of smaller-scale or more cost-conscious projects. Bexar County led the local market, contributing 26 permits for the month.

Market Outlook

Overall, July 2025 data reports reflect a lower level of new pool construction activity across Texas, similar to figures from the start of the year, with Houston and Dallas driving the majority of permit volume, while Austin and San Antonio maintain regionally driven demand. The variation in average construction values highlights distinct market profiles—Houston remains the leader in luxury-grade pool installations, while Dallas and Austin deliver strong volumes in the mid-to-upper range, and San Antonio caters to more budget-conscious projects.

To gain more information on the builders, homeowners and permits for the construction activity above, check out HBW for your copy of the latest construction data reports. To gain access to the HBW database and receive custom and detailed reports on the latest residential and commercial building activity in Florida, Georgia, Texas, Alabama, and Oklahoma, please contact HBW for details.

Texas Residential Construction Trends: Q2 2025 Market Overview

According to the latest HBW Building Activity Trend Report, new residential construction across Texas remained in positive territory through the second quarter of 2025, marking a steady continuation of growth from last year’s rebound. Statewide, 41,586 new residential construction permits were added to the books through Q2 — a 4% year-to-date (YTD) increase compared to the same period in 2024.

This pace represents a notable shift from the market volatility of recent years. After experiencing back-to-back annual declines in 2022 (-8%) and 2023 (-16%), the sector saw signs of recovery in 2024 with a 10% YTD increase by mid-year. The 2025 data indicates that while growth has slowed slightly compared to last year’s double-digit gains, market fundamentals remain stable.

Regional Performance

While the statewide market is up overall, growth is uneven across the four major metro regions tracked in the report. Dallas is the only metro to show double-digit gains this year, while Houston remains essentially flat, and Austin and San Antonio register modest YTD declines.

Dallas

  • Total Permits: 14,074 permits (+20% YTD)
  • Top Counties:
    • Collin County: 5,339 permits (-4.8% YTD)
    • Tarrant County: 3,427 permits (+299% YTD)
  • Higher Value Activity: In 2024, the Dallas metro issued 5,313 permits valued above $500K. Through the first half of 2025, 1,398 such permits were recorded in Q1, followed by 1,730 in Q2.

Dallas continues to lead the Texas market, fueled by a significant spike in Tarrant County activity, which more than tripled compared to the same time last year. Despite a small pullback in Collin County, the region’s sustained demand for new housing — particularly in higher value segments — possibly signals robust buyer confidence.

Houston

  • Total Permits: 19,846 permits (-1% YTD)
  • Top Counties:
    • Harris County: 9,172 permits (+1.7% YTD)
    • Montgomery County: 5,996 permits (+1.6% YTD)
  • Higher Value Activity: In 2024, the region saw 1,816 higher value permits. For 2025, 534 permits over $500K were issued in Q1 and 567 in Q2.

The Houston market is essentially flat compared to the same time in 2024, with small but positive gains in its highest-volume counties. Stable performance in the $500K+ segment suggests that while the pace has leveled off, the region remains a steady driver of statewide residential construction.

Austin

  • Total Permits: 3,929 permits (-5% YTD)
  • Top Counties:
    • Travis County: 1,603 permits (-18% YTD)
    • Williamson County: 1,580 permits (+18.5% YTD)
  • Higher Value Activity: In 2024, Austin recorded 833 higher value permits. In 2025, Q1 saw 138 such permits, with a sharp increase to 301 in Q2.

Austin’s overall activity is down slightly, largely due to a notable slowdown in Travis County. However, Williamson County is on the upswing, and the Q2 jump in luxury construction points to a potential mid-year shift toward higher-end residential projects.

San Antonio

  • Total Permits: 3,737 permits (-9% YTD)
  • Top Counties:
    • Bexar County: 2,547 permits (-9% YTD)
    • Guadalupe County: 737 permits (+1.1% YTD)
  • Higher Value Activity: In 2024, the region saw 444 permits valued above $500K. So far in 2025, there were 138 in Q1 and 122 in Q2.

San Antonio is experiencing the sharpest YTD decline among the major metros, with slower activity in its primary market of Bexar County. Modest growth in Guadalupe County provides a small offset, and higher value construction appears to be somewhat in line with last year’s figures.

Market Outlook

Through mid-2025, the Texas residential construction sector appears to be holding steady after last year’s solid rebound. The overall 4% YTD growth reflects resilience in the face of shifting market conditions, although the momentum is concentrated in select regions (most notably Dallas).

High-value residential construction remains a key driver across all metros, with luxury homebuilding exhibiting some gains in both Dallas and Austin during Q2. Houston’s consistency offers stability to the statewide market, while San Antonio’s ongoing slowdown warrants continued monitoring.

If current trends persist, Texas is on track to close out 2025 with another year of permit growth — a welcome contrast to the contraction seen earlier in the decade.

To gain more information on the builders, homeowners and permits for the construction activity above, check out HBW for your copy of the latest construction data reports. To gain access to the HBW database and receive custom and detailed reports on the latest residential and commercial building activity in Florida, Georgia, Texas, Alabama, and Oklahoma, please contact HBW for details.

Florida Swimming Pool Construction Trends: Q2 2025 Report

Permit activity increases 5% statewide through the first half of the year

According to HBW’s latest Florida Swimming Pool Construction Activity Trend Report, the state’s swimming pool construction market is seeing moderate growth through the first half of 2025. With a total of 14,487 new pool permits on record through Q2, Florida has experienced a 5% year-over-year increase in new swimming pool construction when compared to the same time period in 2024.

While the rate of growth varies by region, the overall upward trend suggests stable consumer demand and ongoing investment in residential amenities across the state. Here’s a closer look at regional performance based on HBW’s permitting data for the six major regions in Florida:

Southwest Florida

Total Permits: 4,239 | YTD Change: +3%

Southwest Florida continues to lead the state in volume, accounting for the highest number of new swimming pool permits through the second quarter. The region experienced a 3% increase year-over-year, with Lee County driving activity through 1,211 permits – a 12% rise from the same time last year. Sarasota County followed with 862 permits, showing a 3% increase compared to Q2 2024.

Southeast Florida

Total Permits: 2,924 | YTD Change: +13%

Southeast Florida posted the highest growth rate among all regions, with a 13% year-over-year increase in new pool construction. Palm Beach County led with 1,092 permits and a 14% YTD gain, while Miami-Dade County surged with 780 permits, marking a notable 26% increase from the same period last year. The data reflects healthy market momentum and homeowner investment in luxury outdoor living spaces.

West Florida

Total Permits: 2,575 | YTD Change: +7%

The West Florida region saw a solid 7% increase in swimming pool construction activity through Q2. Hillsborough County registered the highest number of permits (703 permits), although it experienced a 7% decline compared to Q2 2024. In contrast, Pasco County reported a dramatic 55% increase, issuing 617 new permits through June – a strong indicator of rising development in surrounding suburban areas.

Central Florida

Total Permits: 1,912 | YTD Change: 0%

Central Florida remained flat year-over-year with no notable change in overall permitting activity. The region’s top counties include Orange County (538 permits, -1% YTD change) and Lake County (400 permits, -1% YTD change). Although the market held steady, the slight declines in its leading counties point to a stabilization rather than expansion in demand during the first half of 2025.

Northeast Florida

Total Permits: 1,434 | YTD Change: -2%

Northeast Florida was the only region to experience a decline in permit activity through Q2, with a minor 2% decrease compared to last year. However, St. Johns County showed resilience with 558 permits and a 5% increase YTD. Duval County, on the other hand, saw a 13% drop with just 234 permits issued.

Northwest Florida

Total Permits: 1,403 | YTD Change: +7%

Northwest Florida posted a 7% year-over-year gain, supported by strong permitting figures in Bay County (256 permits, +11% YTD) and Walton County (259 permits, -5% YTD). Despite a slight dip in Walton, the overall region is maintaining solid activity in pool construction as new developments continue to emerge.

Florida’s swimming pool construction industry is holding strong through mid-2025, with total permit volume up 5% statewide. Market activity remains highest in the Southwest and Southeast regions, which together account for nearly half of all new permits issued. While Central and Northeast Florida have flattened or declined slightly, gains in West and Northwest Florida balance out the state’s performance.

As we move into the latter half of the year, permit activity will serve as a key indicator of consumer confidence, regional growth patterns, and ongoing investment in Florida’s robust construction market.

To gain more information on the builders, homeowners and permits for the construction activity above, check out HBW for your copy of the latest construction data reports. To gain access to the HBW database and receive custom and detailed reports on the latest residential and commercial building activity in Florida, Georgia, Texas, Alabama, and Oklahoma, please contact HBW for details.

Florida Residential Construction Update: Q2 2025

A Mid-Year Look at 2025 Trends and Regional Activity

As of the close of Q2 2025, Florida’s residential construction market remains active but shows mixed performance across regions. According to the latest HBW Building Activity Trend Reports, there were 55,311 new residential construction permits on record statewide from January through June of this year. While this figure reflects robust building activity, it also marks a modest 2% year-over-year (YTD) decrease compared to the same period in 2024 (56,175 permits).

To put this into context, Florida’s new home construction market experienced a 5% YOY dip in 2022, a steeper 14% decline in 2023, and stabilized with 0% change in 2024. This year’s mild contraction may indicate continued market normalization, with region-specific gains and losses shaping the statewide average.

Regional Breakdown: Growth in the Center, Contraction in the Northeast and Southwest

Despite the overall (and nominal) dip, several regions in Florida are seeing significant growth in new residential construction activity:

  • Central Florida is leading the charge with 8,478 new permits, reflecting an 18% increase over the same period last year. This surge suggests strong demand and developer confidence in the region.
  • West Florida also experienced healthy growth, with 14,451 permits pulled through Q2 — an 8% increase YTD.
  • Northwest Florida remained relatively stable with a 1% increase and a total of 6,366 permits.

Conversely, some regions posted notable declines:

  • Northeast Florida reported 9,147 permits, but this figure represents an 18% YTD decrease, making it the region with the sharpest decline in permit activity so far this year.
  • Southwest Florida saw 11,852 new permits, reflecting an 8% decrease YTD.
  • Southeast Florida held relatively steady, with 5,017 permits, reflecting a modest 2% decline.

The above listed regional differences highlight the nuanced shifts in housing demand, labor availability, land development, and market confidence across the state.

Spotlight on High-Value Construction

Luxury and higher-value construction (permits valued over $500,000) continues to represent a strong segment of the Florida housing market. While 2025 data only covers through Q2, several regions are already approaching or surpassing half of their 2024 totals:

  • West Florida leads the state so far in 2025 with 1,952 higher-value permits, nearing its 2024 total of 2,276.
  • Central Florida has logged 1,361 permits valued over $500k (2024 total: 2,295).
  • Southeast Florida is tracking strong with 1,140 high-value permits, already covering nearly 70% of its 2024 total (1,633 permits).

Other regions such as Southwest Florida, Northwest Florida, and Northeast Florida are also on pace to match or slightly exceed their prior year totals by the end of 2025.

This uptick in high-value homes is indicative of ongoing demand in mid-to-upper tier markets, and possibly a result of buyers seeking more space, custom features, or investing in long-term residences.

Top-Performing Counties for Residential Construction

On a county level, several key areas are driving Florida’s residential construction numbers. The following counties recorded the highest volume of new permits through Q2 2025:

  1. Lee County (SW): 4,772 permits | +5% YTD
  2. Pasco County (West): 4,040 permits | +39% YTD
  3. Polk County (West): 3,946 permits | -21% YTD
  4. Marion County (NE): 2,922 permits | -3% YTD
  5. Manatee County (SW): 2,289 permits | -30% YTD
  6. Sumter County (West): 2,288 permits | +36% YTD
  7. Hillsborough County (West): 2,266 permits | -7% YTD
  8. Duval County (NE): 2,185 permits | -12% YTD
  9. St. Johns County (NE): 1,951 permits | -29% YTD
  10. Orange County (Central): 1,877 permits | +6% YTD

Counties like Pasco and Sumter are experiencing significant gains, suggesting these areas may be benefiting from population growth, favorable development conditions, and proximity to metropolitan hubs. On the flip side, St. Johns, Manatee, and Polk Counties are showing double-digit declines, possibly due to shifting inventory cycles, permitting delays, and/or temporary market saturation.

A Balancing Market with Regional Momentum

While Florida’s statewide residential construction volume has slightly contracted compared to last year, the overall market remains strong, particularly in Central and West Florida. The rise in higher-value construction and the strong performance in key counties underscore ongoing demand — especially in suburban and semi-rural areas positioned for growth.

As we enter the second half of 2025, all eyes will be on whether emerging growth regions can maintain momentum and if previously declining markets will stabilize or rebound. Builders, investors, and stakeholders should continue to monitor regional trends and adjust strategies accordingly to align with evolving market conditions.

To gain more information on the builders, homeowners and permits for the construction activity above, check out HBW for your copy of the latest construction data reports. To gain access to the HBW database and receive custom and detailed reports on the latest residential and commercial building activity in Florida, Georgia, Texas, Alabama, and Oklahoma, please contact HBW for details.

Florida Pool Construction Report – June 2025

According to the latest HBW construction data reports, nearly 2,450 new swimming pool construction permits were added to the books across the state of Florida during the month of June 2025, reflecting more than an 18 percent month-over-month increase. With five key regions represented—Southwest, Southeast, Tampa, Orlando, and Jacksonville—the Sunshine State continues to experience steady demand in residential pool construction, with high activity levels in coastal counties and a healthy spread of top-performing contractors region-wide.

Southwest Florida Leads the State

The Southwest region led the state for new pool construction activity in June, with 830 new permits and a total construction value in excess of $67.3 million. The average value of construction for the region landed at $81,132, slightly above the state’s mid-range. Leading counties for the month included Sarasota (228 permits) and Lee (196 permits). With over 200 active builders, the region was anchored by three top-performing contractors:

  • Pinnacle USA pulled 71 permits with a total value of approximately $4.4 million.
  • Coast to Coast Pools closely followed with 69 permits totaling $6.36 million, resulting in the highest average value among the top three at $92,162.
  • Holiday Pools of West Florida secured 48 permits for a combined value of $2.89 million.

Tampa Maintains High Value Builds

The Tampa area reported 459 new swimming pool construction permits in June, with a total construction value in excess of $40.6 million and an average value of $88,482—placing it among the higher-value markets this cycle. The highest activity was recorded in Hillsborough County (158 permits), followed by Pasco County (80 permits) and Sumter County (79 permits). Among roughly 150 contractors were active in the area during the one-month period:

  • Tampa Bay Pools on the Gulf led with 26 permits and an impressive average value of $108,992.
  • Tropical Pools & Pavers took second with 20 permits valued at $1.76 million.
  • Cody Pools, although third in volume (19 permits), reported the highest average value out of the top three builders at $150,797 per project.

Southeast Florida

In the Southeast region, there were 572 new pool construction permits, totaling approximately $44.4 million in value and averaging $77,572 per project during the month of June. The region remains strong in volume, with Palm Beach County (230 permits), Miami-Dade County (131 permits), and St. Lucie County (89 permits) leading the way. Approximately 220 builders pulled permits in this region during the month, with the top three landing as follows:

  • Fountain Blue Pool Service, leading with 26 permits and a total value nearing $1.5 million.
  • Louden Bonded Pools, with 22 permits valued at more than $1.4 million.
  • Pughs Pools & Spas, also with 22 permits, but at a lower overall construction value, resulting in a more modest average value of $36,740.

Orlando Region

The Orlando region had 333 new pool permits on record for June, representing more than $23.3 million in total value and an average construction value of $69,989. Activity was heaviest in Orange County (83 permits) and Brevard County (73 permits). Among the 110+ builders with permits on record, the top three were as follows:

  • Dreamscapes Pools & Spas, with 36 permits and a combined value of $2.16 million.
  • Bob’s Pool Service, pulling 23 permits at a lower average value of $42,155.
  • Martin Pools & Spas, with 12 permits averaging nearly $84,000 per build.

Jacksonville Sees Higher Per-Permit Value

Although Jacksonville reported the fewest new pool permits in the state for June (241 total), the region had the highest average value at $89,975 per project—just ahead of Tampa’s top-tier pricing. Duval County (48 permits) and St. Johns County (121 permits) led in permit volume. Out of the 90+ active pool builders with new construction on record for the month, the leading companies were:

  • Anthony & Sylvan Pools, with 13 permits and an average value of $106,231.
  • Blue Haven Pools, following closely with 12 permits at an average of $74,307.
  • Old Town Custom Pools, with 8 permits and an average value of $58,125.

Overall, Florida’s swimming pool construction market continues to reflect strong regional demand, particularly in coastal and suburban areas. While volume continues to fluctuate month to month, average project values are holding somewhat steady or increasing in many regions—particularly in Tampa and Jacksonville, where luxury builds appear to be more prevalent. Leading contractors across the state remain consistent in their permit activity, indicating solid positioning and market share as we move into the second half of the year.

To gain more information on the builders, homeowners and permits for the construction activity above, check out HBW for your copy of the latest construction data reports. To gain access to the HBW database and receive custom and detailed reports on the latest residential and commercial building activity in Florida, Georgia, Texas, Alabama, and Oklahoma, please contact HBW for details.