FL New Swimming Pool Construction Permits Q1 2017 vs 2018
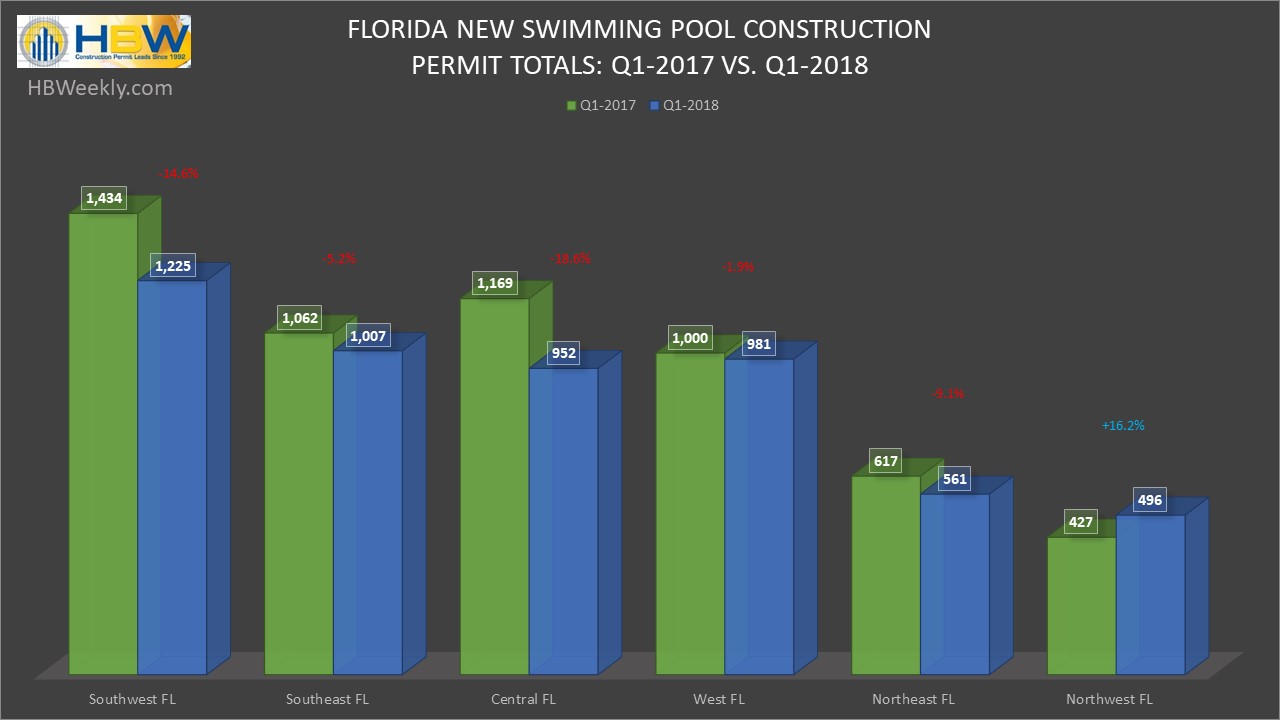
In comparison to last year, new swimming pool construction in Florida is at a slower pace in the first quarter of this year; statewide there has been an 8.5% year-over-year decrease in new pool construction with central (-18.6%) and southwest (-14.6%) Florida taking the greatest hits. Out of the six major regions reviewed (Central, West, Southeast, Southwest, Northeast, Northwest) there have been more than 5,200 pool starts in Q1-2018, with only one area experiencing gains in new pool construction – The northwestern region of the state (inclusive of two Alabama counties) had a running start in comparison to last year having more than a 16% year-over-year increase in pool starts resulting in nearly 500 new permits in Q1-2018.
Despite the decrease in construction overall in Florida, certain major counties have experienced some notable gains. For example, Charlotte County (SW) had 183 pool starts in the first quarter of this year which reflects more than a 46% boost in pool construction in comparison to Q1 of last year. Additionally, Hillsborough County (West) is ahead with a more than 18% year-over-year increase in pool starts resulting in 360 new pool construction permits in the first quarter. In the southeast, the counties of Palm Beach (384 permits) and Broward (115 permits) both experienced year-over-year gains of 6.5% and 20% respectively.
When looking at total new pool construction permits by area, the southwest ranked #1 for total starts having 1,225 new permits added to the HBW database in the first quarter of this year. The southeast region ranked second highest with more than 1,000 pool starts, and the western region was close behind and ranked third with 981 new swimming pool construction permits for the three-month period.
To gain more information on the builders, homeowners and permits for the construction activity above, check out HBW for your copy of the latest construction data reports. To gain access to the HBW database and receive custom and detailed reports on the latest residential and commercial building activity in Florida, Georgia, Texas, Alabama, and Oklahoma, please contact HBW for details.