Getting the Most Out of Instagram and Shoppable Posts

Sometimes it feels like there are just too many social media outlets and so little time to keep up with our own pages.  As a busy home builder, developing social media content can seem like an extra rather than a necessity, and the choice on which content to “tweet”, post on FaceBook or Instagram can become an annoyance when it should become a regular occurrence in your marketing schedule.

For the purpose of this post, we are taking a look at ways to maximize your company’s presence on Instagram, more specifically shoppable posts.  Instagram has reported more than 400 million people using “Instagram Stories” every day; this is significantly higher than Snapchat’s reported 191 million daily “stories” users.  And as of recently, Instagram has added features to its Stories products.  Instagram’s shoppable posts feature allows customers to make purchases without ever leaving the app, and it is one of the easiest ways to promote your products and increase sales on Instagram.  While this may not benefit your business if you are a service-only based business, you can utilize it if you are in a position to sell certain products (i.e. tile, light fixtures, countertops, interior/exterior décor).

With shoppable posts, Instagram users can go from inspiration to information and purchase your products in just a few short clicks.  When you post something “shoppable”, your image will include a small but noticeable shopping bag icon.  Users can tap on the photo to get information on the product including a description and price.  From there, they just need to tap the “shop now” button to be directly forwarded to your product catalog.  In this way, your Instagram post becomes less about “look at what we have” to “look at what you can have”.

Need a little guidance on getting started and posting your first shoppable post on Instagram?  No problem.  Instagram provides simple step-by-step instructions, and if you already have a catalog set up on FaceBook, you are almost halfway there.  Your business profile must be connected to a Facebook catalog. This can be created and managed directly on your business page on Facebook; you can simply go to business.facebook.com/products, and click “create catalog”.  From there, you can follow next steps as published by Instagram (Note: Make sure you have the latest version of the Instagram app.):

To enable product tagging:

  1. Tap the profile icon to go to your profile
  2. Tap the Get Started alert at the top of your profile
  3. If you don’t see the alert in the image above, tap the settings icon.
  4. Tap Shopping
  5. Tap Continue
  6. Select a product catalog to connect to your business profile.
  7. Tap Done


To tag products in your posts:

  1. Select a photo and add a caption, effects and filters
  2. Tap the products in the photo that you want to tag
  3. Enter the names of the products you want to tag, then select them as they appear in the search box
  4. Tap Done
  5. Tap Share

You can tag products in both new and existing posts from your Instagram business profile. You can tag up to 5 products per single-image post or 20 products per multi-image post.

As with anything new, it is easy to want to use it in everything you do, but shoppable posts should be used when you have already generated interest in a particular product and are prepared to meet those sales processed by the app.  While you won’t want to make every post shoppable, you should most certainly make every shoppable post count.

For more information on construction business and marketing tips, stay connected with the HBW Blog.  To get ahead of construction activity and gain access to the latest permitting data in Florida, Texas, Georgia, Alabama and Oklahoma, contact HBW for more information on construction data reports and industry leads.

Top Florida Pool Builders – May 2018

An HBW monthly report on leading pool builders and new permitting data in Florida for May 2018.

FL Pool Permits by Area – May 2018

Last month, there were approximately 1,660 new swimming pool permits with a total value of nearly $71M added to the HBW database for Florida.  Out of the five major regions (SW, SE, Tampa, Orlando, Jacksonville) reviewed, the southwestern region ranked highest for total pool starts (427 permits) while Tampa ranked highest for average value of new construction ($45,678).

Here is a look at Florida’s top pool builders by region for the month of May 2018:

Southwest Florida

Nothing quite compared to the southwestern region of Florida when it came to new pool construction.  The southwest portion of the state led for total new swimming pool construction permits having nearly 430 new permits with an average construction value of $42,412 last month; the majority of pool starts originated from Lee (183 permits) and Collier (123 permits) counties.

Out of the more than 100 active pool builders in the area last month, the top five for total new permits on file with HBW are as follows:

1-Coast to Coast Pools
2-Aragon Pools & Spas
3-Pinnacle USA
4-Aragon Pools & Spas
5-Waterscapes Pools & Spas


Southeast Florida

In the southeast region of the Sunshine State, new pool construction was strong, especially in Palm Beach (132 permits) and Miami (101 permits).  During the month of May, nearly 360 new pool permits were added to the HBW database and carried an average construction value of $41,282.

Out of the 137 active pool builders in the area last month, the top five for total new permits on file with HBW are as follows:

1-A&G Concrete Pools
2-Pools by Greg
3-Crystal Pools
4-Fountain Blue Pool Service
5-RHR Pools


Tampa

Tampa ranked third highest for pool starts last month where there were 335 new swimming pool construction permits.  The average value of construction was highest in Tampa in comparison to other regions reviewed coming in at nearly $45.7k, and the greatest concentration of pool starts originated from the larger county of Hillsborough (104 permits).

Out of the 115 active pool builders in the area last month, the top five for total new permits on file with HBW are as follows:

1-Olympus Pools
2-Gulfstream Pools & Spas
3-Tampa Bay Pools
4-Natural Springs Pools
5-Larsen’s Pool & Spa


Orlando

In Orlando, there were 325 swimming pool starts with an average value of construction just over $40.3k last month, and the highest concentration of new pool permits could be found in Orange County (113 permits).

Out of the 77 active pool builders in the area last month, the top five for total new permits on file with HBW are as follows:

1-All Seasons
2-Bob’s Pool Service
3-American Pools & Spas
4-Intercoastal Pool & Spa Builders
5-Premier Pools of Central FL


Jacksonville

Last month, there were approximately 215 pool starts with an average construction value of $43.5k in Jacksonville, and close to half of all new swimming pool construction took place in St. Johns County (90 permits).

Out of the 75 active pool builders in the area last month, the top five for total new permits on file with HBW are as follows:

1-Superior Design Pools
2-Pools by John Clarkson
3-Crystal Pools & Spas
4-Stanley Pools
5-Surfside Pools & Spas


To gain more information on the builders, homeowners and permits for the construction activity above, check out HBW for your copy of the latest construction data reports. To gain access to the HBW database and receive custom and detailed reports on the latest residential and commercial building activity in Florida, Georgia, Texas, Alabama, and Oklahoma, please contact HBW for details.

Five Tips for Improving Introductory Emails

Cleaning up your email approach may just be the thing you need to have your introductory emails get noticed rather than deleted…

First time communication with prospects can be an exercise in trial and error.  Sure, you may have a few tried-and-true sales techniques that have proven to be successful, but the truth is that what works for getting one contact to respond to an email may force another to flag you as “spam”.  When making initial (or even second) contact by email, first impressions are important, and there are a few key improvements that can be made to maximize this opportunity for engagement:

  1. Be Clear – It is easy for those of us who are in the industry to get technical and describe details that may not make sense to the consumer. When formulating an introductory email, your approach should be direct and serve as more of a lure for more information rather than a detailed guide or comprehensive list of your services.  Be clear on what you offer and how the lead can reach you and take next steps.
  2. Be Personal – It is easy to follow a template and create one email and “Bcc” hundreds of contacts, but that won’t make you stand out from the crowd. Take the time to look at the permitting data and history on file with HBW to truly assess what your lead needs and how you can offer products or services that provide solutions rather than unnecessary extras.
  3. Be Concise – Now that you have done your research, looked at their permitting data and know their needs, be concise on your offerings. Think of your first email as an upgraded elevator pitch.  Yes, you can add contact information and links to your website and social profiles, but try to limit the text to 20 seconds or less.
  4. Be Clean – While you may have several product sheets, brochures and color samples, adding them to your message as attachments makes for one bulky email. Many filters will flag unknown contacts that have large file attachments which will increase the likelihood of your email never even making it to the “inbox”.  Instead, consider using cloud-based storage for sharing links to your brochure or service list rather than attachments.  This also allows the recipient to easily share your information with other decision makers in the household or business.
  5. Be Focused – What products/services will speak most to this potential client? What is your call to action?  Do you want them to respond to the email, click on a link or call you directly?  The more focused you are on your offerings and next steps, the easier it will be for your lead to respond.

First time touchpoints usually have a level of uncertainty, but by making your approach more personal, concise and clear, you have a higher likelihood of engaging and opening the door to a new customer.

For more information on construction business and marketing tips, stay connected with the HBW Blog.  To get ahead of construction activity and gain access to the latest permitting data in Florida, Texas, Georgia, Alabama and Oklahoma, contact HBW for more information on construction data reports and industry leads.

Florida Home Building Report – May 2018

An HBW report on housing starts and home building activity in the Sunshine State during May 2018.

Last month, there were hundreds of active home builders throughout Florida contributing to the 6,030 new residential construction permits that have been added to the HBW database.  As always, we reviewed incoming permit activity for five major regions throughout the Sunshine State (Orlando, Tampa, Jacksonville, Southeast and Southwest), and the combined total value of new construction ran over $1.6B for the one-month period.  The area that ranked highest for total housing starts was Tampa (1,583 permits), while the southeast ranked highest for average value of construction ($306,203).

Here is a summary of new home construction activity by region in Florida last month:

Tampa

In Tampa, there were nearly 1,600 housing starts with a total value in excess of $426.5M last month.  The average value of new construction came in at approximately $269.5k, and the highest concentration of new permitting activity could be found in the larger county of Hillsborough (526 permits).

Out of the 215+ active home builders in Tampa last month, Lennar Homes was the leader for total housing starts with 330 new residential construction permits on file for the one-month period.  The top three builders for total housing starts are as follows:

Builder Total Permits
Lennar Homes 330
D.R. Horton 134
The Villages of Lake Sumter 99


Southwest

The southwestern region of Florida ranked second highest for new residential construction last month having approximately 1,330 housing starts with a total value of $321.5k.  The average value of construction was nearly $242k, and the highest concentration of housing starts originated from Lee County (442 permits).

Out of the 215+ active builders with permits on file for the month, Lennar Homes took top spot for total housing starts having 191 new residential construction permits; the top three home builders for total housing starts are as follows:

Builder Total Permits
Lennar Homes 191
Pulte Homes 183
D.R. Horton 162


Orlando

In the Orlando area, there were more than 1,315 housing starts with a total construction value of nearly $393M last month.  The average value of new residential construction was on the higher end of the spectrum at $298k+, and the greatest concentration of new construction took place in Orange County (536 permits)

Out of the 160+ active builders in the Orlando area last month, Lennar Homes ranked #1 for total housing starts with 135 new residential construction permits; the top three builders for total housing starts for the one-month period are as follows:

Builder Total Permits
Lennar Homes 135
D.R. Horton 128
Park Square Homes 93


Jacksonville

Last month, there were more than 1,050 housing starts with a total value of nearly $231M in Jacksonville.  The average value of new construction fell on the lower side of the spectrum at $219,113, and the majority of new construction took place in St. Johns (375 permits) and Duval (305 permits) counties.

Out of the 145 active builders in Jacksonville last month, D.R. Horton was the leader for total housing starts (210 permits); the top three builders for total permits on file with HBW are as follows:

Builder Total Permits
D.R. Horton 210
Lennar Homes 94
KB Homes 70


Southeast

While the Southeast had the fewest total housing starts last month (719 permits), it continued to land on the higher end of the spectrum for average value of construction (>$306k).  Based on new permits added to the HBW database, more than half of all new construction took place in the counties of Palm Beach (208 permits) and St. Lucie (201 permits).

Out of the 170+ active builders in the area, Lennar Homes ranked #1 in the southeastern region having approximately 125 housing starts on file for the month.  The top three home builders for total new permits are as follows:

Builder Total Permits
Lennar Homes 125
D.R. Horton 85
G.L. Homes 58


To gain more information on the builders, homeowners and permits for the construction activity above, check out HBW for your copy of the latest construction data reports. To gain access to the HBW database and receive custom and detailed reports on the latest residential and commercial building activity in Florida, Georgia, Texas, Alabama, and Oklahoma, please contact HBW for details.
Top Home Landscaping Trends for 2018

Recently, the American Society of Landscape Architects (ASLA) conducted the 2018 edition of the Residential Landscape Architecture Trends Survey, and the results were interesting, but not surprising.  Landscape architects (808 participants) were surveyed from February 22, 2018 through March 8, 2018 and asked to rate the popularity of and demand for certain residential outdoor designs.  A new addition to the survey included consideration of new types of outdoor features that are attractive to single-family and multifamily homeowners including the idea of flex space which has been growing in popularity.

Considering consumers’ ever-increasing dependency on technology and desire for more sustainable designs and lifestyles, it would make sense that low maintenance landscapes with yoga spaces and charging stations would top the list.

Based on the survey’s results, the following are the top ten landscape project types that are expected to be in greatest demand this year:

#1 – Native Plants (83.3%)

#2 – Native/adapted drought tolerant plants (83%)

#3 – Low-maintenance landscapes (80%)

#4 – Flexible use space (movie night areas, yoga space, etc. – 74.2%)

#5 – Permeable paving (74%)

#6 – Drip/water—efficient irrigation (72.4%)

#7 – Rain gardens (71.2%)

#8 – Reduced lawn area (70.8%)

#9 – Edible gardens (food, vegetables, orchards, vineyards – 70.5%)

#10 – Charging stations for tech and mobile devices (70%)

According to the report, the areas in demand have been consistent over the last year, with the exception of the new additions of flexible-use space and charging stations.  The top five outdoor features and popular design elements include:

  1. Firepits and outdoor fireplaces (66%)
  2. Outdoor lighting (65.4%)
  3. Seating/dining areas (64%)
  4. Outdoor furniture (59.1%)
  5. Outdoor kitchens (58.8%)


When looking at recreation and related amenities, dog-related recreation areas topped the list at 68%.  Not far behind, designated areas for other outdoor recreation ran a close second at 61.5%, and bocce courts ranked third at 42.5%.

As previously mentioned, ASLA made some revisions and additions to the survey which included questions addressing multi-family outdoor amenities.  The top three trends for multi-family outdoor amenities included flexible use space for yoga, movie nights, etc. (74.2%), charging stations (70%) and bike storage (69.9%).

For more details and results on the survey, read more here.  For more information on construction business and marketing tips, stay connected with the HBW Blog.  To get ahead of construction activity and gain access to the latest permitting data in Florida, Texas, Georgia, Alabama and Oklahoma, contact HBW for more information on construction data reports and industry leads.

Top Texas Pool Builders – May 2018

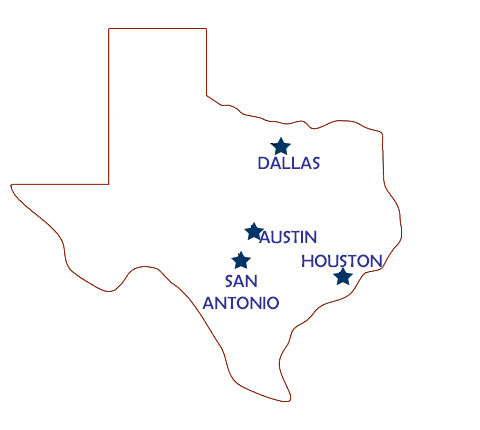
Last month, there was a combined total of 755 new swimming pool permits with a total value of approximately $38.5M added to the HBW database for Texas (Dallas, Houston, Austin, San Antonio).  Out of the four major metro areas reviewed, Dallas ranked #1 for total swimming pool starts (336 permits), while Austin took top spot for highest average value of construction at nearly $60k.

Here is a closer look at the new construction activity and the top ranked pool builders by area:

DALLAS

In Dallas, there were more than 335 swimming pool starts last month with a total value of nearly $15.4M.  The average value of construction was $45,823, and the bulk of new construction took place in Tarrant and Dallas counties.

Out of the 135 active builders in the area, the following ranked as the top three for total new permits:

1-Riverbend Pools
2-Claffey Pools Inc
3-Puryear Custom Pools


HOUSTON

Last month, there were approximately 260 new swimming pool permits with a total value in excess of $14M in Houston.  The average value of new pool construction was $54,663, and more than half of all new pool starts took place in Harris County.

Out of the 140 active builders in the area last month, the following ranked top three for total new permits on file:

1-Premier Pools
2-Cypress Custom Pools
3-Mckinney Custom Pools


AUSTIN

Austin ranked third for total swimming pool starts last month having 84 new permits with a total value in excess of $5M added to the HBW database.  The average value of construction in Austin was highest of the four metro areas reviewed coming in at nearly $60k, and the majority of new construction originated from Travis County.

Out of the 50+ active builders in the area, the following ranked top three for total new permits on file:

1-Cody Pools
2-Anthony & Sylvan Pools
3-Innovative Pools & Spas


SAN ANTONIO

Last month, there were just over 75 swimming pool starts with a total value in excess of $3.8M in San Antonio.  The average value of new pool construction was just over $50k, and nearly all new permits originated from Bexar County.

Out of the approximately 25 active builders on file for the area last month, the following ranked in the top three for total new pool permits:

1-Keith Zars Pools
2-Pool Concepts by Pete Ordaz
3-Blue Haven Pools


To gain more information on the builders and permits for the swimming pool construction activity above, check out HBW for your copy of the latest construction data reports. To gain access to the HBW database and receive custom and detailed reports on the latest residential and commercial building activity in Florida, Georgia, Texas, Alabama, and Oklahoma, please contact HBW for details.

Five Free Apps for Managing Contacts On-the-Go

If you subscribe to HBW, you’ve got construction leads, new leads every day – Now, it’s a matter of managing them.  While there are numerous options for contact management software and CRM (Customer Relationship Management) systems, from simple to robust, smaller business owners are often looking for something to easily manage and share contacts on the go.  The ultimate system will allow both, but for those just looking for a quick fix for their contacts that ensure them access to the latest information available on the contact from a phone or other mobile device, we found five noteworthy apps that may be worth checking out:

  1. Covve – This app offers a way to supercharge your current address book using search technology to complete data fields of your contacts including their company name, location, etc. It can run checks for any changes in contact information and automatically keep them up-to-date.  For better organization, you can tag and put contacts into groups, set reminders and annotate communications.  While entry to the app is free, there are premium subscription options that offer contact analytics and more.
  2. Cloze – Cloze takes basic address book management to the next level with something similar to an all-in-one contact list, social network and email center. It is a bit of a simplified CRM, having the ability to sync data about contacts from social networks and email so that their profiles are as complete and current as possible.  Users can also take actions including tweeting, updating status, liking and sharing content.  Cloze tracks interactions so that primary contacts (aka “Key People”) are identified and their tweets and status updates stay to the surface.
  3. Contacts Optimizer – Depending on how well you have transferred data from old phones to new ones, or even managed your email contacts, chances are you have duplicate contacts throughout your system. There is an on-the-go answer for that in the app “Contacts Optimizer”; it easily removes duplicate entries and finds similar contacts.  It can move different groups of contacts between accounts, identifies profiles with incomplete information and can even correct and reformat phone numbers.  Users can also merge and edit contacts anytime.  It is a quick answer to contact clean-up.
  4. Canvy – Canvy is a contact manager that provides the tools needed to layout contacts in a photo-style tile format that you can easily stream through and move recent and important interactions to the top. With its ability to have notification badges on each contact tile, it allows user a quick view of the contact notes.  By tapping on the app, users can view actions such as the last message or email received and one-click options for sending emails, instant messages or making calls.  The app also offers search capability with adjustable filters and settings to customize how contacts are displayed and viewed.  There are also options for including social media contacts.
  5. CamCard – OK, so this one isn’t free, but at less than a dollar ($0.99), it offers a quick solution for managing business cards. As much as we operate in mostly a digital age, many of us still have and share business cards as part of our networking efforts.  CamCard takes the time out of transferring contacts from paper to the digital world.  It is essentially a business card scanner and contacts manager where users can create contacts through the information on the scanned business card.  Additionally, the app offers the ability to track notes, reminders, contact updates and integrate company news.  Users can also share and sync card data across several devices.

While no one app will necessarily be the answer to managing all contacts and leads, there are a handful of solid apps that can help you keep track of new and shared contacts no matter where you are located.

For more information on construction business and marketing tips, stay connected with the HBW Blog.  To get ahead of construction activity and gain access to the latest permitting data in Florida, Texas, Georgia, Alabama and Oklahoma, contact HBW for more information on construction data reports and industry leads.

HBW does not endorse or receive compensation from any of the apps or related companies listed above.  This article serves as a starting point for readers to conduct their own research and find a contact management system that works best for them and their business.

Texas Home Building Report – May 2018

HBW’s report on Texas residential permitting activity for the month of May 2018.

Texas housing starts experienced a month-over-month dip in May having an approximate decrease of 8% since April. From the four major metro areas reviewed (Dallas, Houston, Austin, San Antonio), there were more than 6,600 new residential construction permits with a total value of nearly $1.7B added to the HBW database last month.  Houston had the greatest total number of housing starts (2,619 permits), while Dallas ranked #1 for average value of construction at nearly $311k.

As for the Lone Star State’s top home builders, it should come as no surprise that mega-builder D.R. Horton continues to reign supreme in three out of four major areas (all metro areas except San Antonio), having close to 700 new residential construction permits added to the HBW database for the one-month period.  In San Antonio, there were 100+ active builders in the area for the month with Continental Homes of Texas taking top spot for total new permits.

The average value of new residential construction varied across the state with Dallas ranking on the higher end of the spectrum (average value: $310,998) and Houston ranking on the lower end with an average value of $215,089 for the month.

Here is closer look at the total housing starts, construction values, top counties and top builders by area for the month of May:

To gain more information on the builders, homeowners and permits for the construction activity above, check out HBW for your copy of the latest construction data reports. To gain access to the HBW database and receive custom and detailed reports on the latest residential and commercial building activity in Florida, Georgia, Texas, Alabama, and Oklahoma, please contact HBW for details.

Preparing for Hurricane Season

source: wikipedia

Just this week, the Atlantic Hurricane Season officially began (June 1st), and it is essential that you and your crews are prepared for severe weather conditions.

As we all know, hurricanes can devastate areas for months, even years.  According to a recent article published by Reuters, Houston is still rebuilding from Hurricane Harvey that came barreling in last summer.  In the year since Hurricane Harvey caused fatalities and an estimated $125 billion in property damage, there are still approximately 25,000 households that are displaced (source: FEMA), and nearly 80,000 homes that were impacted by a minimum of 18 inches of floodwater during the storm.

While areas that were impacted by such severe conditions still repair from last year, it is time for you and your company to be prepared for hurricanes that may be coming this season.  To start, it is important to have an evacuation plan in place, and FEMA has helpful tools and information for forming evacuation plans as well as measures to take if evacuation is not an option.

According to OSHA, a thorough evacuation plan includes:

  1. Definition and guide for conditions that will activate the plan.
  2. A clear chain of command and reporting procedure.
  3. Emergency measures, functions and the responsible individual or team that will perform them.
  4. Evacuation procedures including exits and routes to be taken.
  5. Procedures for reporting location, status and accounting for personnel, customers and visitors.
  6. Safety equipment for all personnel.

After you have set your evacuation and severe weather safety plans, it is important that all workers have access to supply kits and receive the proper training to know how to assess severe weather and follow the appropriate course of action.  To learn more about preparing supplies and setting up basic disaster supply kits, you can easily review the CDC’s Hurricane Preparedness supplies planning guide, as well as Ready.gov’s Basic Disaster Supplies Kit Checklist.

When training your crews and teams, you can run through emergency weather scenarios and exercises.  Such practice should include ensuring that all workers know what to do in case of an emergency.  Running through evacuation plans and providing a chance for employees to ask questions is something that you should make a regular part of your safety training and review.  Additionally, any revisions or improvements that are needed based on what you and your team learn from the exercises should be used for updating plans and procedures to remain current.

Whether it comes to safety or technical knowledge, an informed crew is a successful crew.  It doesn’t take much time to keep crews current on safety procedure, but it does require a significant amount of time to recover from not having a plan for extreme weather.  Be prepared and safe, and help your crews understand and know how important their safety is to you and your business.

For more information on construction business and marketing tips, stay connected with the HBW Blog.  To get ahead of construction activity and gain access to the latest permitting data in Florida, Texas, Georgia, Alabama and Oklahoma, contact HBW for more information on construction data reports and industry leads.

Florida Swimming Pool Report – April 2018

An HBW review of new swimming pool construction permitting activity in Florida during the month of April 2018.

FL Pool Permits by Area – April 2018

In Florida, there were more than 2,060 swimming pool starts during the month of April.  Out of the five major regions reviewed (Orlando, Tampa, Jacksonville, Southeast, Southwest), the southwestern portion of the state ranked #1 for total pool starts (575 permits), while Tampa ranked highest for average value of new pool construction ($47,247).

Here is a closer look at new pool construction activity and leading pool builders by area last month:

Southwest Florida

As previously mentioned, the greatest total number of swimming pool starts took place in the southwestern region of Florida.  Last month, there were 575 new swimming pool permits with a total value in excess of $25M on file with HBW.  The average value of new construction in the area was $43,622, and more than 75% of all new permits originated from Lee and Collier counties.

Out of the 110 active builders in the area, the top three for total new permits on file are as follows:

#1 Aragon Pools & Spas
#2 Aquadoc Inc.
#3 Pinnacle USA


Southeast Florida

In the southeastern region of the Sunshine State, there were more than 430 pool starts with a total construction value in excess of $16.2M last month.  The average value of construction in the area was on the lower end of the spectrum at $37,709, and 70% of all new construction activity took place in Miami-Dade and Palm Beach counties.

Out of the 150+ active builders in the area last month, the top three for total new permits on file with HBW are as follows:

#1 Swimming Pool Contractors
#2 A & G Concrete Pools
#3 Champion Pools & Spas


Tampa

In Tampa, there were 410 pool starts with a total value of nearly $19.5M on file last month.  The average value of new pool construction was $47,247, and more than 60% of all new permitting activity took place in Hillsborough and Pasco counties.

Out of the approximately 115 active builders on file for the month, the top three for total new permits are as follows:

#1 Tampa Bay Pools Inc.
#2 Olympus Pools
#3 Challenger Pools


Orlando

In Orlando, there were nearly 400 new pool permits with a total construction value in excess of $17M added to the HBW database.  The average value of construction in the area was $43,381, and the highest concentration of new permits originated from Orange and Osceola counties.

Out of the 80+ active builders on file for the month, the top three for total new permits are as follows:

#1 All Seasons
#2 American Pools & Spas
#3 Bobs Pool Service Inc


Jacksonville

Last month, there were close to 250 pool starts with a total value in excess of $11M in the Jacksonville area.  The average value of construction was $45,532, and 65% of all new construction could be found in the counties of Duval and St. Johns.

Out of the 80+ active pool builders in the area, the top three for total new permits for the one-month period are as follows:

#1 Pools by John Clarkson
#2 Blue Haven Pools
#3 Surfside Pools & Spas


To gain more information on the builders, homeowners and permits for the construction activity above, check out HBW for your copy of the latest construction data reports. To gain access to the HBW database and receive custom and detailed reports on the latest residential and commercial building activity in Florida, Georgia, Texas, Alabama, and Oklahoma, please contact HBW for details.