Florida Top Home Builders – July 2019

An HBW report on new residential construction activity in Florida during the month of July 2019

Each month, HBW conducts a review of the latest construction permit data available from the HBW database for a given time period and area.  Based on the latest figures, last month there were approximately 6,835 new residential construction permits with a total construction value in excess of $1.8 billion added to the HBW database.  Out of the five major regions reviewed (Tampa, Southwest, Orlando, Jacksonville, Northeast), Tampa carried the highest concentration of new home construction (1,968 permits), and Orlando held the highest average value of new home construction (average value: $291,627).

When looking at the leading builders statewide, a few major players continue to lead the market, including D.R. Horton and Lennar Homes. That being stated, each region had its own lineup of top builders – Here is a look at the top home builders in Florida based on the total permits on file with HBW for the month of July 2019:

Tampa

In Tampa, there were approximately 1,970 housing starts with a total construction value of nearly $546 million.  The average value of new construction landed on the higher end of the spectrum ($277,399), and the county with the highest concentration of new permits was Hillsborough (643 permits).

Out of the 230 active home builders with construction activity on file for the month, the following ranked as the top five for total new permits:

Builder Total Permits
Lennar Homes 484
D.R. Horton 200
The Villages of Lake Sumter 125
Pulte Homes 94
Highland Homes 49


Southwest

The southwestern region ranked second for new residential construction activity, having 1,445 housing starts with a total construction value of more than $360 million on record for the month.  The average value of new construction was on the lower end of the spectrum in comparison to other regions reviewed (average value: $249,415), and the county with the highest concentration of housing starts was Lee (458 permits).

Out of the approximately 220 active home builders on record for the month, the following ranked as the top five for total new permits:

Builder Total Permits
Lennar Homes 236
Pulte Homes 177
D.R. Horton 131
Taylor Morrison 66
Neal Communities of SW FL 47


Orlando

Not far behind the southwestern region, Orlando ranked third and had 1,397 housing starts with a total construction value of nearly $407.5 million.  As previously mentioned, the average value of new construction was highest in Orlando (average value: $291,627) in comparison to other regions throughout the state, and the county with the greatest concentration of new construction activity was Orange (456 permits).

Out of the more than 200 active home builders with activity on record for the month, the following ranked as the top five for total new permits:

Builder Total Permits
D.R. Horton 104
Lennar Homes 83
Ryan Homes 56
M/I Homes 40
Park Square Homes 40


Jacksonville

In Jacksonville, there were more than 1,190 housing starts with a total construction value of nearly $276 million during the month of July.  The average value of new construction was lower in Jacksonville than other regions reviewed (average value: $231,679), and the bulk of all new residential construction activity took place in the counties of St. Johns (448 permits) and Duval (412 permits).

Out of the more than 150 active home builders in the area last month, the following ranked as the top five for total new permits on file with HBW:

Builder Total Permits
Lennar Homes 179
D.R. Horton 165
KB Homes 76
Mattamy Homes 68
David Weekley Homes 55


Southeast

Last month, there were approximately 835 housing starts with a total construction value of $218.5 million in Southeast Florida.  The average value of new construction was $261,993, and more than half of all housing starts originated from St. Lucie County (450 permits).

Out of the more than 175 active home builders in the area, the following ranked as the top five for total new permits on record for the one-month period:

Builder Total Permits
Lennar Homes 87
GL Building Corp 71
Maronda Homes 59
Pulte Homes 44
Kolter Signature Homes 40


To gain more information on the builders, homeowners and permits for the construction activity above, check out HBW for your copy of the latest construction data reports. To gain access to the HBW database and receive custom and detailed reports on the latest residential and commercial building activity in Florida, Georgia, Texas, Alabama, and Oklahoma, please contact HBW for details.

Florida Swimming Pool Construction Review – July 2019

An overview of the latest new swimming pool construction permit data added to the HBW database during the month of July 2019

When reviewing the latest construction permit data for Florida, we find approximately 2,110 new swimming pool permits with a total construction value of nearly $99 million added to the HBW database for the month of July 2019.  Out of the five major regions reviewed (Southwest, Tampa, Orlando, Southeast and Jacksonville), Southwest ranked #1 for total new permits for the month (684 permits), while Jacksonville held the highest average value of new construction (average value: $56,559).

Here is a breakdown of new swimming pool construction by Florida region for the month of July 2019:

Southwest Florida

The greatest amount of new pool swimming construction activity could be found in the southwestern portion of Florida last month as there were 684 new permits with a total construction value of nearly $31 million in the area.  The average value of new construction was $45,217, and the county with the highest concentration of new permits was Lee County (213 permits).

Tampa

Last month, Tampa ranked second highest for new pool construction having 457 new pool permits with a total construction value of nearly $22 million added to the HBW database.  The average value of new pool construction was $47,545, and the greatest amount of pool starts took place in Hillsborough County (148 permits).

Orlando

In Orlando, there were approximately 380 new swimming pool construction permits with a total value of nearly $18 million last month.  The average value of new construction was $47,328, and more than half of all new permits originated from the counties of Orange (126 permits) and Osceola (94 permits).

Southeast Florida

Last month, there were 367 new swimming pool permits with a total construction value of approximately $15.8 million added to the HBW database for the southeastern region of Florida.  The county with the highest concentration of swimming pool starts was Miami-Dade (152 permits), and the average value of new construction was lowest in the area in comparison to other regions reviewed (average value: $43,067).

Jacksonville

In Jacksonville, there were 222 new pool swimming permits with a total construction value in excess of $12.5 million added to the HBW database last month.  The average value of new construction was higher than other regions reviewed (average value: $56,559), and more than half of all new construction activity took place in St. Johns County (79 permits) and Duval County (63 permits).

To gain more information on the builders, homeowners and permits for the construction activity above, check out HBW for your copy of the latest construction data reports. To gain access to the HBW database and receive custom and detailed reports on the latest residential and commercial building activity in Florida, Georgia, Texas, Alabama, and Oklahoma, please contact HBW for details.

Texas Swimming Pool Construction Report – July 2019

An HBW review of new pool construction and leading builders in four major metro areas of Texas during the month of July 2019

Last month, there were nearly 900 new swimming pool permits added to the HBW database from the combined Texas metro areas of Houston, Dallas, Austin and San Antonio.  As could be expected, new construction activity ranged from low to high depending on the area, and leading builders varied widely by region.

Out of the four major metro areas reviewed, Dallas held the highest volume of new swimming pool permits (411 permits), and Austin held the highest average value of new construction (average value: $93,233).  Here is look at the leading builders by area as based on construction permit data reports for July 2019:

Dallas

Just about 46 percent of all new swimming pool permits in Texas last month originated from Dallas and its surrounding areas. During the month of July, there were 411 pool starts in Dallas with a total construction value in excess of $18.7 million.  Approximately half of all new construction took place in two counties: Collin (103 permits); Tarrant County (97 permits).

Out of the approximately 165 active pool builders in the area last month, the following ranked as the top five for total new permits on file with HBW:

#1 – Riverbend Pools
#2 – Premier Pools
#3 – Claffey Pools
#4 – Venture Custom Pools
#5 – Gold Medal Pools


Houston

Not far behind Dallas, Houston ranked second for total new swimming pool permits on file with HBW.  During the month of July, there were 314 pool starts with a total construction value in excess of $19 million for the area.  From a county-wide perspective, higher concentrations of new construction activity could be found in Harris County where more than half of all new construction took place (188 permits).

Out of the more than 150 active pool builders in the area last month, the following ranked as the top five for total new permits on file with HBW:

#1 – Southern Charm Pools
#2 – Regal Pools
#3 – Anthony & Sylvan Pools
#4 – C3 Building Solutions
#5 – Supreme Pools & Spas


Austin

Last month, there were approximately 110 swimming pool starts with a total construction value in excess of $10 million in the Austin area.  Nearly all new permitting activity took place in Travis County where there were 85 new swimming pool permits added to the HBW database.

Out of the 60 active pool builders in the area last month, the following ranked as the top five for total new permits:

#1 – Cody Pools
#2 – Anthony & Sylvan Pools
#3 – Texas Pools & Patios
#4 – Edgewater Pools
#5 – Majestic Poolscape


San Antonio

In San Antonio, there were nearly 60 swimming pool starts last month with a total construction value in excess of $2 million.  The majority of new construction could be found in one county (Bexar County) where there were 44 new pool permits for the one-month period.

Out of the nearly 30 active pool builders in the area last month, the following ranked as the top five for total new permits on file with HBW:

#1 – Keith Zars Pools
#2 – Cody Pools
#3 – Blue Haven Pools
#4 – Gary Pools
#5 – Alamo Pool Builders

To gain more information on the builders, homeowners and permits for the construction activity above, check out HBW for your copy of the latest construction data reports. To gain access to the HBW database and receive custom and detailed reports on the latest residential and commercial building activity in Florida, Georgia, Texas, Alabama, and Oklahoma, please contact HBW for details.

Texas Residential Construction Report – July 2019

An HBW review of the latest residential construction permits for Texas during the month of July 2019

Last month, there were more than 6,460 new residential permits added to the HBW database for Texas.  From the four major metro areas reviewed (Dallas, Houston, Austin, San Antonio), more than 42 percent of new construction activity originated from Houston (2,805 permits), while the highest average value of new construction was found in Dallas (average value: $294,993).

Here is a closer look at new residential construction permit data from Texas, and the leading builders by area, for the month of July 2019:

Houston

As previously mentioned, Houston ranked #1 out of the four major metro areas reviewed for total new residential construction permits last month.  There were more than 2,800 housing starts with a total construction value in excess of $577 million in the Houston area, and more than half took place in Harris County (1,411 permits).  The average value of construction landed on the lower end of the spectrum in comparison to the other metro areas reviewed, coming in at $205,712.

Out of the nearly 345 active home builders in the area, the following ranked as the top five for total permits on file with HBW for the month:

Builder Total Permits
D.R. Horton 198
Lennar Homes 194
K Hovnanian Homes 159
Perry Homes 136
KB Homes 116


Dallas

While Dallas held the highest average value of new home construction last month (average value: $294,993), it ranked second for total new permits on file with HBW; during the month of July, approximately 2,010 new permits with a total construction value of nearly $593 million were added to the HBW database, and more than half of all new construction originated from Tarrant County (720 permits) and Collin County (422 permits).

Out of the nearly 275 active home builders in the area last month, the following ranked as the top five for total new permits on file with HBW:

Builder Total Permits
D.R. Horton 266
Pulte Homes 117
First Texas Homes 85
Highland Homes 66
Bloomfield Homes 65


Austin

Austin ranked third for new home construction last month as there were 1,115 new permits with a total construction value of approximately $290.5 million added to the HBW database.  Nearly all new construction took place in the counties of Travis (631 permits) and Williamson (411 permits), and the average value of construction was $260,592.

Out of the more than 115 active home builders in the area, the following ranked as the top five for total new permits:

Builder Total Permits
Pulte Homes 116
D.R. Horton 98
Lennar Homes 92
Gehan Homes 83
Milestone Community Builders 74


San Antonio

Last month, there were more than 530 housing starts with a total construction value in excess of $107 million in San Antonio.  The average value of new home construction was lower in San Antonio than other Texas metro areas reviewed (average value: $201,827), and the majority of all new permits originated from Bexar County (433 permits).

Out of the approximately 110 active home builders on file for the month, the following ranked as the top five for total new permits added to the HBW database:

Builder Total Permits
LGI Homes 62
KB Homes 42
Rausch Coleman Homes 41
Lennar Homes 40
New Leaf Homes 23


To gain more information on the builders, homeowners and permits for the construction activity above, check out HBW for your copy of the latest construction data reports. To gain access to the HBW database and receive custom and detailed reports on the latest residential and commercial building activity in Florida, Georgia, Texas, Alabama, and Oklahoma, please contact HBW for details.

Quarterly Report: Florida Swimming Pool Construction Q2-2019

A review of new swimming pool permits in Florida and on file with HBW through the second quarter of 2019

FL New Swimming Pool Construction Permits by Area Q2-2018 vs. Q2-2019

When you think of Florida, you can’t help but think of sun, beaches and swimming pools.  Over the past five years, the Sunshine State has experienced annual gains in new swimming pool construction year after year, and there appears to be no signs of slowing.  From January through June of this year, there has already been a 3 percent year-over-year increase in new pool construction, resulting in approximately 12,420 new swimming pool permits added to the HBW database.

Similar to and in line with Florida’s new residential construction through the second quarter, the western regions (West, Northwest, Southwest) of the state have demonstrated the greatest annual gains in new pool construction ranging from 5 percent (Southwest) to 10 percent (West).  When reviewing volume of permits, the western region as a whole maintained its lead in the market as it held more than half of all new permits (6,920 permits) in Florida for the six-month period.

When moving to the central portion of the state, including Orlando and surrounding areas, we find that while overall the area is off to a slower start than last year (8 percent year-over-year decrease), Orange and Volusia County have demonstrated year-over-year gains ranging from 9 percent to 10 percent.  Out of the more than 1,940 new pool permits in Central Florida through June of this year, more than half originated from Orange (377 permits) and Volusia (275 permits), while the other half were sourced primarily from the counties of Osceola (442 permits) and Brevard (442 permits).

Finally, in the eastern regions of Florida, there have been gains of 2%-3% in comparison to last year.  In the southeast, there have been 2,280 pool starts, reflecting a 2 percent year-over-year increase, and in the northeast there has been a 3 percent year-over-year increase in new pool construction, resulting in 1,277 new permits on file with HBW.

To gain more information on the builders, homeowners and permits for the construction activity above, check out HBW for your copy of the latest construction data reports. To gain access to the HBW database and receive custom and detailed reports on the latest residential and commercial building activity in Florida, Georgia, Texas, Alabama, and Oklahoma, please contact HBW for details.
Florida New Home Construction Holding Steady

A review of HBW’s Building Activity Trend Report for new residential construction in Florida through the second quarter of 2019

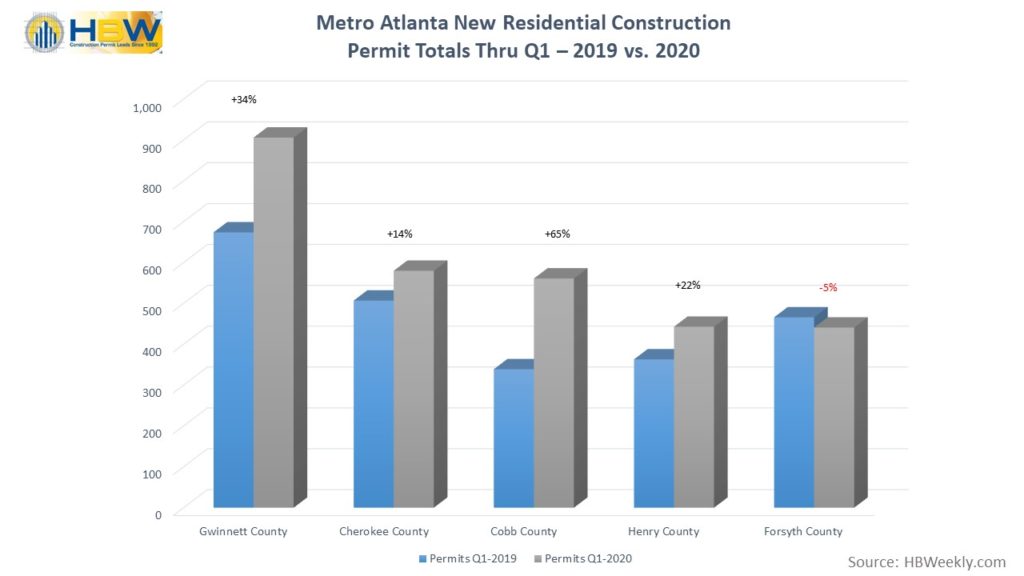
Based on the latest “Building Activity Trend Report” available from HBW and covering new residential construction permits, overall new home construction in Florida has been holding steady since the start of this year (in comparison to 2018).  Since January 2019 (thru June 2019), there have been approximately 40,600 new residential construction permits added to the HBW database for the Sunshine State, which is in line with figures from the previous year.  And while there were year-over-year decreases in residential construction for most regions reviewed, the growth in West and Southeast Florida pulled statewide figures up to be somewhat even with last year.

Out of the six major regions reviewed (Central, West, Southeast, Southwest, Northeast, Northwest), West Florida appears to be booming in new home construction and exceeding the norms.  Over the past five years, the area has experienced annual increases in residential construction ranging from as low as 6 percent to as high as 23 percent, and the growth pattern has continued so far this year.  From January through June, there have been 9,678 housing starts in West Florida, reflecting a 14 percent increase in comparison to last year.  Growth and high concentrations of new home construction permits could be found in Hillsborough County (2,821 permits) which is up 6 percent in comparison to last year, and Polk County (2,636) where there has been an 18 percent year-over-year increase in new residential construction permits.

Continuing in the western region, Southwest Florida ranked #2 for total new permits, having 7,425 new permits added to the HBW database through the second quarter. While the area is on track and in line with last year’s figures, the southwest region of Florida has experienced annual spikes in residential construction year after year since 2015, and for this reason, it will certainly be an area to watch over the next six months.

Here is a look at all six regions reviewed, total permits added to the HBW database for the given period and changes (%) in comparison to last year:

FL New Residential Construction Permits Q2 2018 vs. 2019

To gain more information on the builders, homeowners and permits for the construction activity above, check out HBW for your copy of the latest construction data reports. To gain access to the HBW database and receive custom and detailed reports on the latest residential and commercial building activity in Florida, Georgia, Texas, Alabama, and Oklahoma, please contact HBW for details.

Florida’s Top Spots for New Home Construction – June 2019

A review of the top three spots in Florida for new residential construction permits during the month of June 2019

In June, more than 5,300 new permits were added to the HBW database for residential construction in Florida.  Out of the five major regions reviewed (Orlando, Tampa, Jacksonville, Southeast, Southwest), three areas came out on top when reviewing total volume of housing starts as they held nearly 70 percent of all new residential construction activity in the state for the month:

  1. Tampa – 1,523 permits
  2. Southwest Florida – 1,119 permits
  3. Orlando – 1,028 permits


Here is a look at the breakdown of new permitting activity for the top three Florida regions in June 2019:

Tampa

The Tampa area ranked #1 for total housing starts, having 1,523 new permits with a total construction value in excess of $429 million.  The average value of new construction was $281,702, and nearly all new permits originated from the counties of Hillsborough (542 permits), Polk (462 permits) and Pasco (305 permits).

Out of the more than 200 active builders with new permits in the area for the one-month period, the following ranked as the top five for total new permits on record with HBW:

Builder Total Permits
Lennar Homes 254
Pulte Homes 92
The Villages of Lake Sumter 79
D.R. Horton 74
M/I Homes 46


Southwest Florida

The Southwest region ranked #2 for total new residential construction permits, having 1,119 permits with a total construction value of approximately $281 million added to the HBW database.  The average value of new construction was $251,107, and nearly half of all new construction took place in Sarasota County (278 permits) and Lee County (263 permits).

Out of the approximately 225 active home builders on file for the month, the following ranked as the top five for total new permits:

Builder Total Permits
Lennar Homes 195
Pulte Homes 138
Neal Communities of SW FL 61
D.R. Horton 59
Taylor Morrison 38


Orlando

During the month of June, the Orlando area gained 1,028 housing starts with a total construction value in excess of $324 million.  The average value of new home construction was highest in Orlando (average value: $315,422) in comparison to other regions reviewed, and nearly half of all new construction activity took place in the counties of Orange (291 permits) and Volusia (202 permits).

Out of the approximately 170 active home builders in the area for the month, the following ranked as the top five for greatest total amount of new permits on file with HBW:

Builder Total Permits
D.R. Horton 123
Lennar Homes 68
Mattamy Homes 51
Ryan Homes 47
Pulte Homes 29


To gain more information on the builders, homeowners and permits for the construction activity above, check out HBW for your copy of the latest construction data reports. To gain access to the HBW database and receive custom and detailed reports on the latest residential and commercial building activity in Florida, Georgia, Texas, Alabama, and Oklahoma, please contact HBW for details.

Texas Quarterly Home Construction Review: Q2-2019

A review of the latest construction permits on record with HBW from January 2019 through June 2019

Since the start of this year, new residential construction in Texas has been off to a slower start than anticipated.  Overall, and in the four major metro areas of Dallas, Houston, Austin and San Antonio, there has been a 5% decrease in housing starts in comparison to the same time last year (Q2-2019).  From January to June of 2019, there have been approximately 36,550 new residential construction permits added to the HBW database for Texas, with more than 40 percent of those permits originating from the Houston area.  While Austin is the only metro area that has exhibited a year-over-year increase in housing starts (+4%), all other metro regions reviewed have experienced notable drops in new home construction ranging from as low as 3 percent (Houston) to as high as 11 percent (Dallas).

Here is a closer look at the details from HBW’s latest building activity trend report for new residential construction in Texas through the second quarter of 2019:

Houston

Houston continues to be a powerhouse metro area when it comes to high volume in new residential construction.  From January to June of this year, there have been approximately 15,635 housing starts in Houston, with more than 2 percent representing higher value properties (construction value in excess of $500k).  While the area has demonstrated a pattern of growth in housing starts since 2017, so far this year new home construction is slower and reflective of a 3 percent decrease in new permits in comparison to the same time last year.  From a county-wide perspective, Harris County is holding steady with last year’s figures and carries more than half of all new permits for the Houston area (8,358 permits).

Dallas

While the Dallas area has exhibited significant annual growth in its housing market year after year since 2015, new residential construction permits are down by 11 percent (compared to 2018) through the second quarter of this year.  Dallas ranks second-highest for volume of new home construction, having approximately 11,590 housing starts on file with HBW. More than 5 percent of all new home construction in the Dallas area represented higher value properties (construction value > $500k), and the majority of all new permits originated from Tarrant County (3,521 permits) and Collin County (2,638 permits).

Austin

Last year, Austin demonstrated healthy growth in new residential construction, and based on figures through the second quarter of this year, its growth pattern has continued.  Through Q2-2019, there have been approximately 6,035 new permits added to the HBW database for the Austin area, reflecting a 4 percent year-over-year increase.  More than half of all new construction took place in Travis County (3,972 permits), where there has been more than a 15 percent increase in new home construction in comparison to the same time last year.

San Antonio

Since the start of this year (through Q2-2019) there have been close to 3,300 housing starts in the San Antonio area, reflecting a 7 percent year-over-year decrease in new home construction from the combined counties of Bexar, Comal and Guadalupe.  In contrast to the overall drop in new residential construction activity, the majority of new home construction took place in Bexar County (~2,100 permits) where there has been more than a 7 percent increase in total residential construction permits in comparison to the same time last year.

To gain more information on the builders, homeowners and permits for the construction activity above, check out HBW for your copy of the latest construction data reports. To gain access to the HBW database and receive custom and detailed reports on the latest residential and commercial building activity in Florida, Georgia, Texas, Alabama, and Oklahoma, please contact HBW for details.

Texas Swimming Pool Construction Quarterly Report

An HBW review of swimming pool construction permit data for Texas through Q2-2019

During the first half of this year, Texas has experienced a healthy dose of new swimming pool construction.  In the four major metro areas of Dallas, Houston, Austin and San Antonio, there has been a combined total of 4,187 swimming pool starts, reflecting a 2 percent year-over-year increase in new pool construction permits on record with HBW.

Out of the four major metro areas reviewed, Dallas ranked #1 for total swimming pool starts (2,135 permits), and the Austin area took the lead for the greatest annual growth with a 19 percent year-over-year increase in new swimming pool permits.

Here is a closer look at the latest new pool construction activity by area from January 2019 through June 2019:

Dallas

It’s no secret that Dallas is a hot housing market, and when it comes to swimming pools, the area continues to grow.  Last year, Dallas experienced a 9 percent annual increase in new pool construction, and this year (Q2-2019) the growth pattern has continued.  Since January (through June), there have been 2,135 pool starts in Dallas, reflecting a 2 percent year-over-year increase.  Nearly half of all new construction took place in the counties of Dallas (518 permits) and Tarrant (512 permits), and the greatest percentage of growth could be found in Denton County (+16%).

Houston

Houston has been consistent to say the least when it comes to new pool construction – Through the second quarter of this year, new swimming pool permits have remained steady and in line with figures from the same time last year.  From January through June 2019, there have been 1,193 new pool permits added to the HBW database for Houston, with the majority of new construction taking place in Harris County (702 permits).

Austin

Out of the four metro areas reviewed, Austin has experienced the greatest amount of growth in pool construction in comparison to the same time last year.  Since January, there have been 540 new swimming pool permits added to the HBW database for Austin, reflecting a 19 percent year-over-year increase.  Nearly all new permits originated from Travis County (415 permits) and Williamson County (116 permits), with both counties exhibiting an 18 percent year-over-year increases in new pool permits.

San Antonio

While San Antonio has demonstrated an annual growth pattern in new pool construction since 2015, there have been some signs of slowing since the start of this year.  As of the second quarter of 2019, there has been a seven percent decline in new pool construction in comparison to last year, resulting in nearly 320 new pool permits on record with HBW, most of which originated from Bexar County (261 permits).

To gain more information on the builders, homeowners and permits for the construction activity above, check out HBW for your copy of the latest construction data reports. To gain access to the HBW database and receive custom and detailed reports on the latest residential and commercial building activity in Florida, Georgia, Texas, Alabama, and Oklahoma, please contact HBW for details.

Texas Home Building Report – June 2019

An HBW report on the top home builders for new residential construction permits on file in Texas for the month of June 2019

Home builders in Texas are certainly busy as of late – In a recent report published by Dallas Morning News, the Dallas-Fort Worth homebuilding market ranks #1 in the U.S. (as of Q1-2019), and Houston ranks second.  Home construction in the Dallas area totaled more than 34,500 units on an annualized basis and 30,000 in Houston according to the data shared by Metrostudy, Inc.

When looking at the latest residential construction permit data from HBW for the month of June 2019, both Houston and Dallas continue to lead Texas metro areas.  Last month, Houston ranked #1 for total housing starts with more than 2,600 new residential construction permits added to the HBW database, and Dallas ranked #1 for average value of new home construction (average value: $296,988).

Here is a closer look at new residential construction permits and the leading home builders for Houston, Dallas, Austin and San Antonio during the month of June 2019:

Houston

As previously stated, Houston held the greatest total amount of new permits in comparison to other Texas metro areas.  Last month, there were 2,612 housing starts with a total construction value of approximately $531.7 million.  The average value of new construction was on the lower end of the spectrum at $203,570, and more than half of all new permits originated from Harris County (1,382 permits).

Out of the approximately 345 active home builders on file for the month, the following ranked as the top five for total new permits:

Builder Total Permits
K Hovnanian Homes 184
Lennar Homes 174
Perry Homes 132
D.R. Horton 113
Taylor Morrison Homes 109


Dallas

Last month, Dallas ranked second highest for new home construction having nearly 1,850 housing starts with a total construction value in excess of $548 million.  The average value of new construction was highest in Dallas (average value: $296,988) in comparison to the other areas reviewed, and the greatest amount of new construction activity could be found in the counties of Tarrant (488 permits) and Collin (484 permits).

Out of the more than 270 active home builders on file, the following rank as the top five for total new residential construction permits for the month:

Builder Total Permits
D.R. Horton 285
Highland Homes 96
Beazer Homes 71
First Texas Homes 68
Pulte Homes 60


Austin

In Austin, there were 915 housing starts with a total construction value of more than $237.8 million last month.  The average value of construction was $259,921, and more than half of all new permits originated from Travis County (542 permits).

Out of the 125 active home builders on record last month, the following ranked as the top five for total new permits:

Builder Total Permits
Lennar Homes 116
KB Homes 76
Pulte Homes 66
D.R. Horton 54
Gehan Homes 48


San Antonio

In San Antonio, there were approximately 450 housing starts with a total construction value of nearly $88 million during the month of June. The average value of new construction was lower in San Antonio (average value: $196,861) in comparison to other metro areas reviewed, and the bulk of all new home construction activity took place in Bexar County (338 permits).

Out of the 85 active home builders in the area last month, the following ranked as the top five for total new permits:

Builder Total Permits
KB Homes 49
LGI Homes 44
AHV Vertical 30
Bella Vista CMI 28
M/I Homes 24


To gain more information on the builders, homeowners and permits for the construction activity above, check out HBW for your copy of the latest construction data reports. To gain access to the HBW database and receive custom and detailed reports on the latest residential and commercial building activity in Florida, Georgia, Texas, Alabama, and Oklahoma, please contact HBW for details.