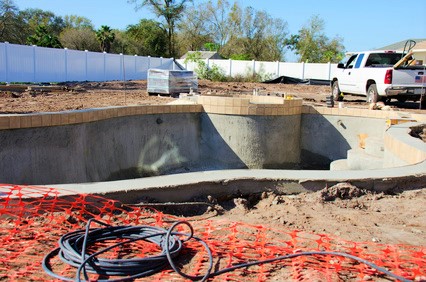
Florida Quarterly Residential Construction Review: Q1-2020

A review of permit data on record with HBW for new residential construction in Florida during the first quarter of 2020

Over the last five years, new residential construction has been soaring in Florida year-after-year, with annual increases ranging from 2 percent to 14 percent.  At the start of this year, gains in Florida’s residential construction market are already evident, as there has been a 22 percent year-over-year in housing starts from January through March 2020, resulting in 23,930 new permits on record with HBW.

Out of the six major regions reviewed (Central, West, Southeast, Southwest, Northeast, Northwest), West Florida held the highest concentration of new residential construction activity (5,684 permits), while the northwestern region of the state exhibited the highest increase in new permits (48%+) in comparison to the same time last year.

Here is a closer look at the total permits, leading counites and YTD % change in new permits during Q1-2020:

West Florida

As previously mentioned, West Florida is currently the leading region for new residential construction as there were 5,684 housing starts since the start of this year (thru March 2020), reflecting a significant 29 percent increase in new home construction in comparison to the same time last year.  Out of the seven area counties reviewed, three counties carried the bulk of new construction activity: Polk County (1,640 permits); Hillsborough County (1,623 permits); Pasco County (1,310 permits).

Southwest Florida

In the southwestern region of the Sunshine State, there were more than 4,800 housing starts in the first quarter of this year, reflecting just over a 29 percent increase in new home construction in comparison to last year.  Out of the five counties reviewed, both Lee (1,573 permits) and Sarasota (1,018 permits) carried the bulk of new residential construction permits, with year-over-year increases (YTD-Q1) of 44 percent and 33 percent respectively.

Northeast Florida

In the northeastern region of Florida, there were 3,880 housing starts in the first quarter of this year, reflecting a 22 percent year-over-year increase in new permits on record with HBW.  Out of the eight area counties reviewed, more than half of all new residential construction permits originated from Duval (1,308 permits) and St. Johns (1,009).  While Duval County is significantly ahead of last year’s figures for new home construction (+58%), St. Johns is falling just behind with a 7 percent decrease in new permits in comparison to the same time last year.

Central Florida

Since the start of this year (thru March 2020), there have been 3,580 housing starts in the Orlando area, reflecting just over an 8 percent increase in new home construction in comparison to the same time last year.  Out of the six major counties reviewed, Orange County held the highest concentration of new residential construction activity (1,094 permits), despite the fact that it experienced a 19 percent year-over-year decrease in new home construction.  On the opposite end of the spectrum, Lake County is currently exhibiting a major spike in new home construction with a 213 percent year-over-year increase in new residential construction activity (Q1-2020), resulting in approximately 725 new permits on record with HBW for the three-month period.

Northwest Florida

In the northwest, there were more than 3,360 housing starts during Q1-2020, reflecting approximately a 48 percent year-over-year increase in new home construction.  For the northwestern region of Florida, 18 counties were reviewed, including two neighboring counties in Alabama (Mobile and Baldwin), and more than half of all new construction took place in the three counties of Baldwin (699 permits), Santa Rosa (613 permits) and Escambia (445 permits).

Southeast Florida

During Q1-2020, there were approximately 2,620 housing starts in the southeastern region of Florida, reflecting a 3 percent decrease in new home construction in comparison to the same time last year.  Out of the seven counties reviewed, St. Lucie County carried the highest volume of housing starts (1,009 permits) and surged ahead of the previous year with a 21 percent year-over-year increase in new home construction.

To gain more information on the builders, homeowners and permits for the construction activity above, check out HBW for your copy of the latest construction data reports. To gain access to the HBW database and receive custom and detailed reports on the latest residential and commercial building activity in Florida, Georgia, Texas, Alabama, and Oklahoma, please contact HBW for details.

New Swimming Pool Construction in Texas on a High in Q1-2020

A review of the latest permit data for new swimming pool construction in Texas during the first quarter of 2020

Based on the latest construction permit data available from HBW, new swimming pool construction has started out strong in Texas early this year.  From the combined metropolitan areas of Dallas, Houston, San Antonio and Austin, new swimming pool construction in Q1-2020 was up by 14 percent in comparison to the same time last year, resulting in more than 2,060 new permits on record with HBW for the three-month period.  Every metro area (with the exception of Dallas) exhibited year-over-year increases in new pool construction ranging from 27 percent to 34 percent, with the highest concentration of construction activity taking place in the Dallas area (950 permits).

Here is a closer look at new swimming pool construction permit totals, and leading counties by Texas metro area from January through March of this year:

Dallas

New swimming pool construction in the Dallas area appears to be holding steady since the start of this year (thru March 2020), as there were 950 pool starts in the first quarter, reflecting a nominal 1 percent year-over-year decrease in new pool construction.  Out of the six Dallas metro area counties reviewed, more than half of all new construction originated from two counties: Collin County (271 permits) and Tarrant County (244 permits); both counties demonstrated year-over-year increases in new pool construction ranging from 9 percent (Tarrant) to 21 percent (Collin).

Houston

Behind Dallas, the Houston area ranked #2 for new swimming pool construction as there were 635 pool starts in Q1-2020.  Out of the four major Texas metro areas reviewed, Houston demonstrated the greatest percentage of growth in pool construction over the previous year, as there was a 34 percent year-over-year increase in new swimming pool permits on record with HBW.  Out of the five Houston area counties reviewed, Harris County carried the highest concentration and the bulk of all new pool construction activity, having 410 new permits on record for the three-month period.

Austin

In the Austin area, there were approximately 300 pool starts in the first quarter of this year, reflecting a 27 percent year-over-year increase in new swimming pool construction. Out of the four counties reviewed in the Austin metro area, nearly all new pool construction permits originated from Travis County (228 permits) where there has been a 24 percent increase (Q1-2020) in pool starts in comparison to the same time last year.

San Antonio

In San Antonio, there were 180 new swimming pool construction permits added to the HBW database in the first quarter of this year, reflecting a 27 percent year-over-year increase in pool starts.  Out of the three counties reviewed in the San Antonio area, the bulk of all new pool construction took place in Bexar County where there were nearly 120 pool starts from January through March of this year.

To gain more information on the builders, homeowners and permits for the construction activity above, check out HBW for your copy of the latest construction data reports. To gain access to the HBW database and receive custom and detailed reports on the latest residential and commercial building activity in Florida, Georgia, Texas, Alabama, and Oklahoma, please contact HBW for details.

HBW Report: Florida Residential Construction – March 2020

A review of permit data for new home construction in Florida during the month of March 2020

During the month of March, there were more than 7,400 housing starts with a total construction value of approximately $2 billion in Florida.  Based on the latest permit data available from the HBW database, out of the five major regions reviewed (Southwest, Tampa, Orlando, Southeast, Jacksonville), Southwest Florida ranked #1 for highest concentration of new residential construction (1,899 permits), while Orlando led for highest average value of new home construction (average value: $315,585).

As for builders, the major players in the Florida market remain Lennar Homes (1,024 permits) and D.R. Horton (1,018 permits), as both held the greatest total amount of housing starts in Florida in comparison to other home builders with new permits on record with HBW for the one-month period.

Here is a breakdown of total permits, leading counties and top home builders for each Florida region reviewed during the month of March 2020:

Southwest

Total permits: 1,899

Average Value of Construction: $255,567

Top County for Total Permits: Lee County – 614 permits

Top three home builders based on total new permits for March 2020:

Builder Total Permits
Lennar Homes 289
D.R. Horton 229
Pulte Homes 205


Tampa

Total permits: 1,858

Average Value of Construction: $284,350

Top County for Total Permits: Polk County – 661 permits

Top three home builders based on total new permits for March 2020:

Builder Total Permits
D.R. Horton 273
Lennar Homes 269
Pulte Homes 98


Orlando

Total permits: 1,389 permits

Average Value of Construction: $315,585

Top County for Total Permits: Orange County – 462 permits

Top three home builders based on total new permits for March 2020:

Builder Total Permits
Lennar Homes 219
D R Horton Inc 156
Taylor Morrison 103


Jacksonville

Total permits: 1,149

Average Value of Construction: $233,016

Top County for Total Permits: Duval County – 482 permits

Top three home builders based on total new permits for March 2020:

Builder Total Permits
D.R. Horton 214
Dream Finders Home 133
Lennar Homes 125


Southeast

Total permits: 1,109

Average Value of Construction: $297,565

Top County for Total Permits: St. Lucie – 454 permits

Top three home builders based on total new permits for March 2020:

Builder Total Permits
GL Building Corp 149
D.R. Horton 146
Lennar Homes 122


To gain more information on the builders, homeowners and permits for the construction activity above, check out HBW for your copy of the latest construction data reports. To gain access to the HBW database and receive custom and detailed reports on the latest residential and commercial building activity in Florida, Georgia, Texas, Alabama, and Oklahoma, please contact HBW for details.

Texas Quarterly Residential Construction Report – Q1-2020

A review of permit data for new home construction in Texas during the first quarter of 2020

New residential construction in Texas has started out on a significant high in the first quarter of this year, with new permit data reflecting an impressive 29 percent increase in housing starts in comparison to the same time last year.  In the combined areas of Dallas, Houston, Austin and San Antonio there have been more than 21,400 new residential construction permits added to the HBW database from January through March of this year alone.  Out of the four major metro regions reviewed, Dallas and Austin have demonstrated the highest year-over-year spikes in housing starts at 34 percent each.  When looking at volume, more than 75 percent of all new permits on record for Texas for the three-month period originated from Houston (8,897 permits) and Dallas (7,168 permits).

Here is a closer look at permit data in Texas and leading counties for new residential construction since the start of this year:

Houston

Houston ranked #1 for volume of housing starts in Q1-2020 as there were nearly 8,900 new residential construction permits added to the HBW database for the area, reflecting a 27 percent year-over-year increase. The county with the greatest amount of new residential construction activity was Harris County (4,131 permits), followed by Fort Bend County (1,920 permits) and Montgomery County (1,868 permits).

Dallas

While new residential construction in Dallas was on a low last year (2019), since the start of this year, things appear to be looking up in the form of a 34 percent year-over-year increase in new residential construction permits.  From January through March 2020, there have been approximately 7,170 new residential construction permits added to the HBW database for the Dallas area, with the highest concentration of new home construction activity taking place in Tarrant County (2,305 permits).

Austin

In the first quarter of this year, new home construction in Austin has been climbing, as there has been a 34 percent increase in housing starts in comparison to the same time last year.  Since the start of this year (thru March 2020), there have been approximately 3,470 new residential construction permits added to the HBW database for the Austin area, and nearly all new construction activity has taken place in two counties: Travis County (1,939 permits), Williamson County (1,152 permits).

San Antonio

Through the first quarter of this year, the San Antonio area has exhibited a 15 percent year-over-year increase in new home construction, resulting in approximately 1,870 new residential construction permits added to the HBW database.  The county with the highest concentration of new construction activity is Bexar County where there have been more than 1,210 housing starts in the first quarter of the year, reflecting a 24 percent year-over-year increase in new residential construction permits.

To gain more information on the builders, homeowners and permits for the construction activity above, check out HBW for your copy of the latest construction data reports. To gain access to the HBW database and receive custom and detailed reports on the latest residential and commercial building activity in Florida, Georgia, Texas, Alabama, and Oklahoma, please contact HBW for details.

Texas Swimming Pool Construction Report – March 2020

A review of the latest new swimming pool construction permits added to the HBW database for Texas during the month of March 2020

Last month, there were approximately 830 swimming pool starts in Texas, reflecting a 38 percent month-over-month increase in new pool construction.  Out of the four major metro areas reviewed (Dallas, Houston, Austin, San Antonio), Dallas held the highest concentration of new pool construction (396 permits), while Austin carried the highest average value of new swimming pool construction (average value: $64,226).

Here is a closer look at the total permits, construction values, leading counties and contractors in Texas for new swimming pool construction during the month of March 2020:

Dallas

Out of the four major metro areas reviewed, Dallas carried the highest volume of swimming pool starts, having nearly 400 new permits with a total construction value of approximately $19 million added to the HBW database last month.  The average value of new pool construction landed mid-range in comparison to other metro areas reviewed (average value: $47,673), and just over half of all new construction took place in the counties of Tarrant (102 permits) and Collin (102 permits).

Out of the more than 140 pool builders with new construction activity on record last month, the following ranked as the top three for total new permits:

Builder
1-Gold Medal Pools
2-Riverbend Pools
3-Foley Custom Pools


Houston

The Houston area ranked #2 for new pool construction last month, having approximately 240 pool starts with a total construction value in excess of $14.6 million.  The average value of new pool construction landed on the higher end of the spectrum in relation to other metro areas reviewed (average value: $61,768), and the bulk of new permits originated from Harris County (162 permits).

Out of the more than 120 pool contractors with starts on record last month, the following ranked as the top three for total new permits:

Builder
1-Platinum Pools
2-Anthony & Sylvan Pools
3-McKinney Custom Pools


Austin

Last month, there were approximately 120 new swimming pool construction permits with a total value in excess of $7.6 million on record for the Austin area. As previously mentioned, the average value of new pool construction was highest in Austin in comparison to other Texas metro areas reviewed (average value: $64,226), and nearly all construction activity took place in the County of Travis (89 permits).

Out of the 60 active pool contractors in the Austin area last month, the following ranked as the top three for total new permits on record with HBW:

Builder
1-Cody Pools
2-Anthony & Sylvan Pools
3-Texas Pools & Patios


San Antonio

From San Antonio, there were 77 new swimming pool permits with a total construction value of nearly $2.5 million added to the HBW database last month.  The average value of new pool construction was lowest in San Antonio in comparison to other metro areas reviewed (average value: $31,829), and the majority of new construction activity took place in Bexar County (53 permits).

Out of the 25 pool builders with new construction activity on record last month, the following ranked as the top three for total new permits:

Builder
1-Keith Zars Pools
2-Cody Pools
3-Blue Haven Pools


To gain more information on the builders, homeowners and permits for the construction activity above, check out HBW for your copy of the latest construction data reports. To gain access to the HBW database and receive custom and detailed reports on the latest residential and commercial building activity in Florida, Georgia, Texas, Alabama, and Oklahoma, please contact HBW for details.

Texas Top Home Builders – March 2020

A review of the leading home builders in the Lone Star State based on total new residential construction permits on file with HBW during the month of March 2020

Earlier this week, we reported on new residential construction activity in Texas, where we identified and revealed a 40 percent month-over-month increase in new home construction throughout the combined four major metro areas of Houston, Dallas, Austin and San Antonio.  As published in the post, this remarkable boost in new home construction resulted in approximately 8,620 new residential construction permits added to the HBW database for Texas during the one-month period.

Today, we are taking a closer look behind the figures to recognize the leading companies driving the latest monthly surge in new home construction. Across the state, D.R. Horton (~1,210 permits) and Lennar Homes (~600 permits) continue to be the front-runners in the residential construction market, with both mega builders landing at the top of the leaderboard in Houston, Dallas and Austin.

Here is a breakdown, by metro area, of the top home builders based on total new residential construction permits added to the HBW database last month:

Houston

In Houston, there were nearly 370 active contractors with new residential construction permits on file with HBW during the month of March 2020, and the following ranked as top five for total new permits for the one-month period:

Builder Total Permits
D.R. Horton 430
Lennar Homes 278
K Hovnanian Homes 206
Perry Homes 189
LGI Homes 143


Dallas

Last month, there were more than 270 home builders in the Dallas area with new home construction activity on record with HBW, and the following ranked as the top five for total new residential construction permits:

Builder Total Permits
D.R. Horton 587
Highland Homes 113
Lennar Homes 97
First Texas Homes 94
Pulte Homes 91


Austin

In Austin, there were more than 125 active home builders with new residential construction activity on record last month, and the following ranked as the top five for total new permits for the one-month period:

Builder Total Permits
D.R. Horton 191
Lennar Homes 170
Pulte Homes 106
KB Homes 103
Pacesetter Homes 78


San Antonio

Last month, there were 125 home builders with new construction permits on record with HBW for the San Antonio area, and the following ranked as the top five for highest volume of new permits:

Builder Total Permits
Continental Homes of Texas 56
Fieldstone Communities SA 54
Lennar Homes 53
Meritage Homes 42
KB Homes 41


To gain more information on the builders, homeowners and permits for the construction activity above, check out HBW for your copy of the latest construction data reports. To gain access to the HBW database and receive custom and detailed reports on the latest residential and commercial building activity in Florida, Georgia, Texas, Alabama, and Oklahoma, please contact HBW for details.

Texas Residential Construction Review – March 2020

An HBW report of the latest residential construction permit data for Texas during the month of March 2020

During the month of March, Texas exhibited a 40 percent month-over-month increase in new residential construction, resulting in approximately 8,620 new residential construction permits with a total construction value in excess of $2 billion.  Out of the four major metro areas reviewed (Houston, Dallas, Austin, San Antonio), Houston ranked #1 for greatest volume of housing starts (3,583 permits), while Dallas continued to carry the highest average value of new home construction (average value: $270,315).

To gain better insight on these figures and new home construction activity in each metro area, here is a breakdown of the total permits, construction value and leading counties in Texas last month:

Houston

As previously noted, Houston ranked #1 for total housing starts in comparison to other Texas metro areas reviewed. Last month, there were approximately 3,585 new residential construction permits with a total value in excess of $730.5 million on record for the Houston area. The average value of new home construction was lowest in Houston in comparison to other areas reviewed (average value: $203,900), and more than half of all new permits originated from Harris County (1,866 permits).

Dallas

In Dallas, there were approximately 2,890 housing starts with a total construction value in excess of $780 million last month. The average value of construction was highest in Dallas in comparison to other Texas metro areas reviewed (average value: $270,315), and the majority of all new permits originated from the counties of Tarrant (900 permits) and Collin (713 permits).

Austin

Last month, there were more than 1,570 housing starts with a total construction value in excess of $399 million in the Austin area. The average value of new home construction was $253,967, and nearly all of the new permits on record with HBW for the one-month period originated from the counties of Travis (856 permits) and Williamson (586 permits).

San Antonio

In San Antonio, there were 575 housing starts with a total construction value in excess of $138 million last month. The average value of new home construction landed mid-range in comparison to other Texas metro areas reviewed (average value: $240,173), and the bulk of all new construction activity took place in Bexar County (443 permits).

To gain more information on the builders, homeowners and permits for the construction activity above, check out HBW for your copy of the latest construction data reports. To gain access to the HBW database and receive custom and detailed reports on the latest residential and commercial building activity in Florida, Georgia, Texas, Alabama, and Oklahoma, please contact HBW for details.

Atlanta Swimming Pool Construction Report – Q1-2020

A review of the quarterly construction permit data on record with HBW for new swimming pool construction in the Metro Atlanta area from January through March 2020

Earlier this week, we reviewed the quarterly figures for new residential construction in the Metro Atlanta area, which reflected a 10 percent increase in housing starts in comparison to the same time last year.  And while the 10 percent increase reflects a strong start for new homes in the Atlanta area this year, new swimming pool construction is off to an even more impressive start.

Since the start of this year (thru March 2020), there has been a 28 percent year-over-year increase in new swimming pool construction throughout the Metro Atlanta area, resulting in more than 550 new permits on record with HBW. Out of the 24 counties reviewed, the top three for total new swimming pool permits include Fulton County, Cobb County and Cherokee County, all of which have demonstrated year-over-year spikes in pool starts ranging from 28 percent to 81 percent.

In Fulton County, there were nearly 100 new swimming pool permits added to the HBW database for Q1-2020, reflecting a 44 percent year-over-year increase. Considering the dip that new pool construction took in Fulton County last year (-8%), this increase in new pools could be a sign of things to come, especially in Q2 and Q3 when new swimming pool construction has customarily been at its highest.

Another Metro Atlanta area county that is proving to be “one to watch” when it comes to new pool construction is Cobb County. Last year, Cobb County exhibited a 6 percent year-over-year increase in new pool construction, and this year the area is ahead of Q1-2019 figures by 28 percent. Since the start of this year (thru March 2020), there have been 95 new swimming pool construction permits added to the HBW database for Cobb County, ranking it #2 for new pool construction based on volume in comparison to the other counties reviewed.

Finally, Cherokee County ranked #3 in the first quarter of this year for total new swimming pool permits on record. The county has demonstrated an 81 percent increase in new pool construction during Q1-2020 (vs. Q1-2019), resulting in 65 new pool permits added to the HBW database. Just as with the other counties reviewed, it is still too early in the year to determine if this increase is indicative of an overall and upcoming  annual increase in new swimming pool construction in the Metro Atlanta area, but HBW will continue to monitor patterns, add new permits as they are available and offer subscribers immediate access to the latest construction permit data available.

Information utilized for the above listed figures for Metro Atlanta swimming pool construction was directly derived from HBW construction data reports. To gain access to the HBW database and receive custom and detailed reports on the latest residential and commercial building activity in Florida, Georgia, Texas, Alabama, and Oklahoma, please contact HBW for details.

Metro Atlanta Residential Construction Quarterly Review: Q1-2020

A review of permit data based on the latest HBW building activity trend report for new home construction in the Metro Atlanta area

ATL Top 5 Counties for New Residential Construction Permits Q1-2020

For the first time since 2017, the Atlanta area is demonstrating year-over-year increases in new home construction during the first quarter of the year.  Based on the latest HBW “Building Activity Trend Report” for new residential construction in the Metro Atlanta area, there has been a 10 percent year-over-year increase in housing starts in Q1-2020, resulting in 5,825 new residential construction permits on record with HBW for the three-month period.

When reviewing the report to identify where the bulk of new home construction is taking place, the top three counties for highest volume of new permits are Gwinnett County (906 permits), Cherokee County (580 permits) and Cobb County (561 permits).  All three counties have demonstrated a strong start to 2020, reflecting year-over-year increases in new residential construction ranging from 14 percent to a whopping 65 percent.

While current conditions and limitations posed by the pandemic will most likely affect new construction figures going forward, Gwinnett County is certainly exhibiting growth in the residential construction market.  Not since 2017 has the area exhibited annual increases in housing starts, but if the first quarter of 2020 is at all a foreshadowing of things to come, new home construction in Gwinnett County will be back on the rise.  From January through March 2020, there has been a 34 percent year-over-year increase in housing starts in Gwinnett County, resulting in the highest volume of new residential construction permits (906 permits) out of all Metro Atlanta area counties reviewed.

Ranking second for volume of housing starts is Cherokee County.  Through the third quarter of this year, there have been 580 housing starts in Cherokee County, reflecting a 14 percent increase in new permitting activity in comparison to Q1-2019.

Not far behind Cherokee County is Cobb County with more than 560 housing starts from January through March of this year.  While Cobb County had experienced a significant annual dip (-23%) in new home construction last year (2019), the county is off to a major upward trajectory in the first quarter of this year, with a 65 percent increase in housing starts in comparison to the same time last year.

Other Metro Atlanta area counties that held higher concentrations of new residential construction permits in the first quarter of this year include: Henry County (443 permits); Forsyth County (441 permits); and Fulton County (431 permits).

Information utilized for the above listed figures for Metro Atlanta residential construction was directly derived from HBW construction data reports. To gain access to the HBW database and receive custom and detailed reports on the latest residential and commercial building activity in Florida, Georgia, Texas, Alabama, and Oklahoma, please contact HBW for details.

“Spring Cleaning” for Your Marketing Strategy

If you are like most businesses right now, you are in a holding pattern of some sort, surviving through and waiting for this pandemic to pass.  This is most likely opening space in your schedule to focus on some of the items you have not had time to get to in the past.  Much like spring cleaning in a home, down time (or springtime) in a business can provide an opportunity to “clean up” and tighten some action items that have made their way to the lower priority bin.

More specifically, marketing efforts may need a little “tidying up” and focus.  For this reason, here are few areas to review in order to tighten your game so that you can be ready to hit the ground running when business begins picking back up again:

  1. Competition – Have you checked on your competition lately? Assess their market share, branding, as well as their positioning and approach to the market.  This is a great time to gather intelligence and see if your competitive advantages remain intact.
  2. Sales – While weekly, monthly and quarterly sales reports have most likely been defining your efforts up to this point, it can be beneficial to use this down time to review your lead sources to ensure that you are receiving new reports and refreshing leads regularly; services like HBW provide the latest data and reports for construction permits, so make sure you have accessed the cloud and/or downloaded the latest to your CRM platform.
  3. Website – Have you reviewed your traffic statistics (Google Analytics, host stats) lately? While closer monitoring of such data is important during your campaigns, it is also important to review stats over time to get an overall picture of the ebb and flow of traffic patterns.
  4. Product & Service Review – Have your services or primary products been evolving/changing over time? The answer is most likely “yes” but there is a chance that your promotions and customer initiatives could be outdated and not inclusive of the products and services that are in highest demand.  Take the time to review and place new products and services front and center of existing and perhaps new markets.
  5. Branding – Between brochures and flyers to websites and social media profiles, you have probably had a few different hands touching the face of your brand. For this reason, it is important to review your brand and online presence to ensure that all of your marketing materials and representation are in sync and reflecting the same image and voice of your company.
  6. Online Review – The online world is far from a perfect world, so it is worth cutting away some extra time to ensure that your websites, landing pages, social media profiles, links and videos are up-to-date and functioning. Few things are as frustrating as clicking on a link and receiving an error message or being directed to the wrong website or page.
  7. Advertising – Which advertising efforts are providing significant ROI, and which ones are on their way out? By reviewing your media, print, online (banners, directories, pay-per-click) and broadcast (TV, radio) advertising initiatives, you can identify what should stay, and what should go.

Although this down time can be challenging for businesses that are ready to get back to their usual operations, you can still be productive by using it to review and improve the marketing efforts you have in place so that you can be stronger than ever when your doors open again.

For more information on construction business and marketing tips, stay connected with the HBW Blog.  To get ahead of construction activity and gain access to the latest permitting data in Florida, Texas, Georgia, Alabama and Oklahoma, contact HBW for more information on construction data reports and industry leads.