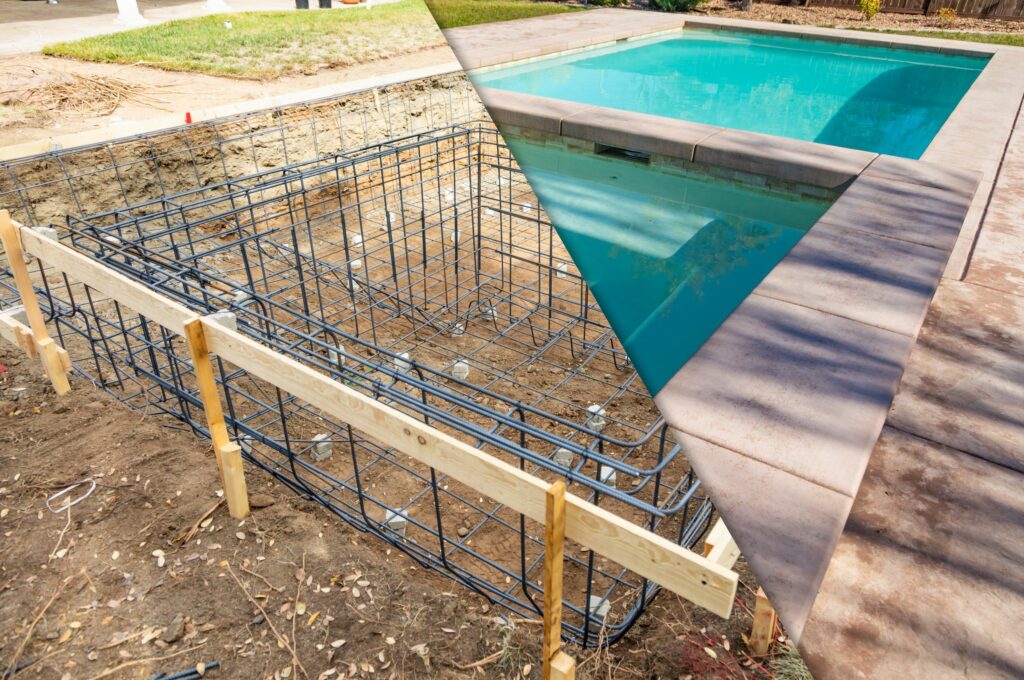
Florida Swimming Pool Construction Report – May 2023

Last month, Florida experienced a 2.5 percent month-over-month increase in new swimming pool construction, resulting in 2,360 new permits with a total construction value of nearly $172M on record with HBW.  Out of the five major regions reviewed (Southwest, Tampa, Orlando, Southeast, Jacksonville), the southwestern region ranked #1 for the greatest amount of new construction (734 permits), while the highest average value of new swimming pool construction projects could be found in the Jacksonville area (average value: $98,382).

Here is a closer look at new swimming pool construction permit totals by area, along with average value of construction and leading counties in each region:

Southwest

In the Southwest, there were 734 new swimming pool construction permits with a total value of approximately $55M.  The average value of new pool construction was $74,787, and the county with the highest concentration of new construction activity was Collier County (222 permits).

Southeast

Last month, the southeastern region of Florida ranked #2 for new pool construction, having just over 525 new permits with a total construction value of nearly $35M on record with HBW.  The average value of new swimming pool construction was $66,143, and more than half of all new permits originated from the two counties of Palm Beach (139 permits) and Miami-Dade (134 permits).

Tampa

In Tampa, there were more than 490 new swimming pool construction permits with a total value in excess of $38M during the month of May.  The average value of construction was $78,047, and the county with the greatest concentration of new pool construction activity was Hillsborough (190 permits).

Orlando

Last month, there were nearly 400 new swimming pool construction permits with a total value of approximately $22.5M added to the HBW database for Orlando.  The average value of new pool construction was lowest in the Orlando area (average value: $57,182) in comparison to other regions reviewed, and more than half of all new permits originated from the two counties of Orange (160 permits) and Brevard (75 permits).

Jacksonville

In Jacksonville, there were more than 215 new swimming pool construction permits with a total value of nearly $21.3M on record last month.  The average value of new pool construction was highest in Jacksonville (average value: $98,382) in comparison to other Florida regions reviewed, and nearly half of all new permits originated from St. Johns County (99 permits).

To gain more information on the builders, homeowners and permits for the construction activity above, check out HBW for your copy of the latest construction data reports. To gain access to the HBW database and receive custom and detailed reports on the latest residential and commercial building activity in Florida, Georgia, Texas, Alabama, and Oklahoma, please contact HBW for details.

Top Texas Home Builders – May 2023

As published on the HBW blog last week (Texas Residential Construction Report – May 2023), there were 9,000 new residential construction permits with a total construction value in excess of $2.5 billion on record for Texas last month.  While the previous post highlighted the total number of permits available in the HBW database for the given period, this week we are reviewing the leading home builders driving the latest construction figures in the four major metro areas of the Lone Star State (Dallas, Houston, Austin, San Antonio).

Month after month, D.R. Horton has led new home construction in Texas.  During the month of May, the mega-builder had approximately 925 new permits on record from the combined areas of Dallas, Houston, Austin and San Antonio, and it landed as the leading builder in two out of four areas reviewed.

Another top-ranked home builder that consistently makes its mark in Texas is Lennar Homes.  Last month, Lennar Homes had nearly 885 new residential construction permits on record with HBW from the four Texas areas reviewed, and it landed on the top five list in all four regions.

As each area of Texas has its own unique construction patterns and local contractors, the volume of new residential construction permits varies for each contractor and region.  For this reason, here is a look at the top five home builders by metro area (based on total # of new permits) last month:

Dallas

BuilderTotal Permits Average Value
1-D.R. Horton344 $      191,235.00
2-Lennar Homes280 $      197,811.00
3-Perry Homes167 $      459,583.00
4-Meritage Homes163 $      257,726.00
5-Trophy Signature Homes147 $      336,343.00

Houston

BuilderTotal Permits Average Value
1-D.R. Horton519 $      161,522.00
2-Lennar Homes405 $      175,420.00
3-K Hovnanian Homes226 $      157,858.00
4-Perry Homes190 $      384,084.00
5-Chesmar Homes140 $      207,972.00

Austin

BuilderTotal Permits Average Value
1-KB Homes71 $      285,861.00
2-Perry Homes70 $      529,317.00
3-D.R. Horton61 $      207,651.00
4-Lennar Homes52 $      150,387.00
5-Taylor Morrison Homes49 $      393,294.00

San Antonio

BuilderTotal Permits Average Value
1-Lennar Homes146 $      151,165.00
2-LGI Homes68 $      158,019.00
3-Continental Homes of Texas45 $      163,212.00
4-KB Homes44 $      205,819.00
5-Century Communities41 $      174,790.00

To gain more information on the builders, homeowners and permits for the construction activity above, check out HBW for your copy of the latest construction data reports. To gain access to the HBW database and receive custom and detailed reports on the latest residential and commercial building activity in Florida, Georgia, Texas, Alabama, and Oklahoma, please contact HBW for details.

Texas Residential Construction Report – May 2023

Last month, Texas demonstrated a 25 percent month-over-month increase in new residential construction.  Based on HBW’s latest construction data reports for the four major metro areas of the Lone Star State (Dallas, Houston, Austin, and San Antonio), there were 9,000 new residential construction permits with a total construction value in excess of $2.5 billion on record for the one-month period.  Out of the four areas reviewed, Houston (4,084 permits) ranked #1 for highest volume of new residential construction, while Austin held the highest average value of housing starts (average value: $334,617).

Here is a closer look at the total new permits, construction values and leading counties in each of the Texas metropolitan areas reviewed for the month of May 2023:

Houston

As previously noted, Houston ranked #1 for new home construction last month, having approximately 4,085 new permits with a total construction value of nearly $990 million on record for the one-month period.  The average value of new home construction has continued to remain on the lower end of the spectrum in Houston (average value: $242,382) in comparison to the other areas reviewed, and more than half of all new permitting activity took place in Harris County (2,125 permits).

Dallas

The Dallas area ranked #2 for new home construction as there were 3,430 new permits with a total construction value in excess of $1.1 billion added to the HBW database during the month of May.  The average value of construction landed on the higher end of the spectrum in Dallas (average value: $330,941) in comparison to the other Texas areas reviewed, and more than 65 percent of new construction activity took place in the counties of Collin (1,247 permits) and Tarrant (1,004 permits).

Austin

In Austin, there were 790 new residential construction permits with a total construction value in excess of $264.3 million last month. The average value of construction was highest in the Austin area (average value: $334,617) in comparison to other Texas areas reviewed, and approximately half of all new permits originated from Travis County (391 permits).

San Antonio

Last month, there were 695 new residential construction permits with a total value of $150 million in the San Antonio area.  The average value of construction was lowest in San Antonio (average value: $215,890) in comparison to the other areas reviewed, and the bulk of new permits originated from Bexar County (514 permits).

To gain more information on the builders, homeowners and permits for the construction activity above, check out HBW for your copy of the latest construction data reports. To gain access to the HBW database and receive custom and detailed reports on the latest residential and commercial building activity in Florida, Georgia, Texas, Alabama, and Oklahoma, please contact HBW for details.

Texas Swimming Pool Construction Review – May 2023

The latest and greatest HBW reports are in and ready for review. Based on construction data reports for the month of May, there have been approximately 895 new swimming pool construction permits added to the HBW database for Texas; this figure reflects a 23 percent month-over-month increase in new pool construction.

Out of the four metro areas included in the report (Dallas, Houston, Austin, San Antonio), the greatest concentration of new permits could be found in Dallas (360 permits), while the highest average value of new pool construction projects could be found in Houston (average value: $83,453).

Here is breakdown of the total permits, average value of construction, and leading counties and contractors for new swimming pool construction in the Lone Star State during the month of May:

Dallas

Total # of Permits: 360

Average Value of Construction: $57,417

Top county for pool construction (based on total permits): Dallas – 128 permits

Top three swimming pool builders (based on total permits):

BuilderTotal Permits
1-Riverbend Pools25
2-Gold Medal Pools13
3-Puryear Custom Pools12

Houston

Total # of Permits: 312

Average Value of Construction: $83,453

Top county for pool construction (based on total permits): Harris County – 171 permits

Top three swimming pool builders (based on total permits):

BuilderTotal Permits
1-Cypress Custom Pools25
2-Platinum Pools24
3-Blue Haven Pools10

San Antonio

Total # of Permits: 119

Average Value of Construction: $39,701

Top county for pool construction (based on total permits): Bexar County – 82 permits

Top three swimming pool builders (based on total permits):

BuilderTotal Permits
1-Cody Pools15
2-Keith Zars Pools14
3-Aquamarine Pools of DFW8

Austin

Total # of Permits: 103

Average Value of Construction: $46,480

Top county for new pool construction (based on total permits): Travis County – 85 permits

Top three swimming pool builders (based on total permits):

BuilderTotal Permits
1-Cody Pools12
2-Denali Pools10
3-Majestic Poolscape5

To gain more information on the builders, homeowners and permits for the construction activity above, check out HBW for your copy of the latest construction data reports. To gain access to the HBW database and receive custom and detailed reports on the latest residential and commercial building activity in Florida, Georgia, Texas, Alabama, and Oklahoma, please contact HBW for details.
Tips for Boosting Social Media Profiles

Whether you are new to social media, just launched a page on a new platform or consider yourself to be an experienced pro, a little refresher can always help start and keep social media marketing strategies on track. The truth is that social media management often changes hands in a company; whether due to turnover in the marketing department, or a change to third-party management, your social media profiles may have a few loose ends to tie along the way.

No matter the status of your social media efforts, here are three easy things that you can do right now to improve your profiles and company pages on various social media platforms:

1. Update Profile – From new addresses and contact information to added services and mission statements, chances are that you have some updates that could be made to the contact information and descriptions within your company profile. Is contact information up to date? Have you linked your website, newsletter, and other social profiles? Have you checked previously used links to ensure that they are still active (and not 404 pages)? Are team members and contacts the latest and greatest? Check and check again because one outdated click can lead to a disengaged visitor.

2. Confirm Admins – While your company’s social media page admins should be limited to just a select few people, you may have experienced turnover that has left some admins that may no longer be with your company. For this reason, it is critical that you check who has access to posting and managing your account, remove any outdated contacts, and add those who are currently responsible for social media management. Keep in mind, even if the company owner is not overseeing or contributing to content creation, he/she should be the primary account holder and master admin for all profiles.

3. Get Creative – It is easy to get in a posting slump – sharing the same type of content or format every single time. This can get old for both the creator, and more importantly, the follower. For this reason, work with your team to develop a social media strategy that is designed to diversify your content and provide variety for your viewers. Don’t be afraid to get creative and try something new; you may be surprised by which content gets the most views and shares, and new data on follower interest can serve as a helpful guide in content development going forward.

For more information on construction business marketing tips, stay connected with the HBW Blog.  To get ahead of construction activity and gain access to the latest permitting data in Florida, Texas, Georgia, Alabama and Oklahoma, contact HBW for more information on construction data reports and industry leads.

Upcoming Industry Trade Shows & Expos

From July through November, industry-related trades shows and expos are in full force and happening across the country; these events enable attendees to gain the latest industry insights with opportunities to hear from leading experts, view the latest equipment and products, and access networking events.

For this reason, we have gathered a few industry events that you may want to consider in the coming months.  Here are five upcoming industry conventions and trade shows that are on the calendar for 2023:

FWCCA Trade Show and Convention

Date: July 5-9, 2023

Location: Trump Doral Golf Resort & Spa – Miami, Florida

Details: The Florida Wall & Ceiling Contractors Association is the voice of the Florida wall and ceiling industry. Made up of contractors and industry allies, FWCCA represents the needs and concerns of wall and ceiling contractors. 

Website: https://fwcca.com/tradeshow-1-22/

Southeast Building Conference (SEBC)

Date: July 19-20, 2023

Location: Orange County Convention Center – Orlando, Florida

Details: The Southeast Building Conference (SEBC), hosted by the Florida Home Builders Association (FHBA), is the largest building industry trade show in the southeast. This year’s programming will include two days of education, the region’s largest building industry trade show, networking opportunities and more.

Website: https://sebcshow.com/

FBMA Convention & Trade Show

Date: September 27-29, 2023

Location: Rosen Shingle Creek – Orlando, Florida

Details: The Florida Building Material Alliance Convention and Trade Show includes industry-wide exhibitors, hundreds of attendees, guest speakers, educational executive panel discussions and the opportunity to network.

Website: https://fbma.org/product/2023-trade-show-convention-3/

METALCON

Date: October 18-20, 2023

Location: Las Vegas Convention Center – Las Vegas, NV

Details: METALCON is the only global event dedicated exclusively to the application of metal in construction and design. It features innovative metal construction products and solutions, while connecting visitors with metal construction industry vendors and thought leaders.

Website: https://www.metalcon.com/

RoofCON

Date: November 9-11, 2023

Location: Orange County Convention Center – Orlando, Florida

Details: RoofCON is a conference for “Legacy-Focused Leaders in the Roofing & Solar Industry”. From brand building to leadership strategies, the event features leaders to provide knowledge, insight, and training.

Website: https://roofcon.com/

For more information on construction industry updates and business tips, stay connected with the HBW Blog.  To get ahead of construction activity and gain access to the latest permitting data in Florida, Texas, Georgia, Alabama and Oklahoma, contact HBW for more information on construction data reports and industry leads.

Florida Top Home Builders – April 2023

Earlier this week, we reviewed and reported on the latest permit data on record with HBW for new home construction in the Sunshine State. In the post, we noted that there had been approximately 8,445 new residential construction permits added to the HBW database for Florida during the month of April.

Today, we are utilizing the same HBW construction data reports to identify the leading home builders that are driving new construction throughout the state. Last month, there were two contractors that have continued to lead when it comes to new residential construction permits. Just over 30 percent of all new permits on record in Florida last month were under the following leading home builders:

  1. Lennar Homes (1,327 permits)
  2. D.R. Horton (1,212 permits)

While the above listed builders were ranked within the top three on the leaderboard in every region reviewed, there were several other standout contractors that were leading new residential construction – Here are the top five builders in each Florida region during the month of April 2023:

Tampa

Last month, there were more than 235 home builders with new construction activity on record with HBW in the Tampa area, and the following ranked as the top five for total new permits:

BuilderTotal Permits
1-Lennar Homes391
2-D.R. Horton369
3-The Villages of Lake Sumter110
4-Ryan Homes97
5-Highland Homes84

Southwest

In the southwestern region of the state there were nearly 410 contractors with new residential construction permits on record with HBW last month, and the following ranked as the top five for total new permits:

BuilderTotal Permits
1-Lennar Homes309
2-D.R. Horton245
3-Pulte Homes178
4-Neal Communities of SW FL121
5-Taylor Morrison119

Orlando

In the Orlando area, there were approximately 200 home builders with new construction activity on record last month, and the following ranked as the top five for total new permits:

BuilderTotal Permits
1-D.R. Horton257
2-Lennar Homes248
3-Pulte Homes109
4-Meritage Homes86
5-Summit Construction Group71

Jacksonville

Last month, there were approximately 135 home builders with new construction activity on record in the Jacksonville area, and the following ranked as the top five for total new permits:

BuilderTotal Permits
1-D.R. Horton258
2-Lennar Homes214
3-Dream Finders Homes62
4-Pulte Homes57
5-Richmond American Homes36

Southeast

In the southeastern region of Florida, there were more than 130 contractors with new home construction on record with HBW last month, and the following ranked as the top five for total new permits:

BuilderTotal Permits
1-Lennar Homes165
2-GL Building Corp.126
3-D.R. Horton83
4-Pulte Homes68
5-LGI Homes44

To gain more information on the builders, homeowners and permits for the construction activity above, check out HBW for your copy of the latest construction data reports. To gain access to the HBW database and receive custom and detailed reports on the latest residential and commercial building activity in Florida, Georgia, Texas, Alabama, and Oklahoma, please contact HBW for details.
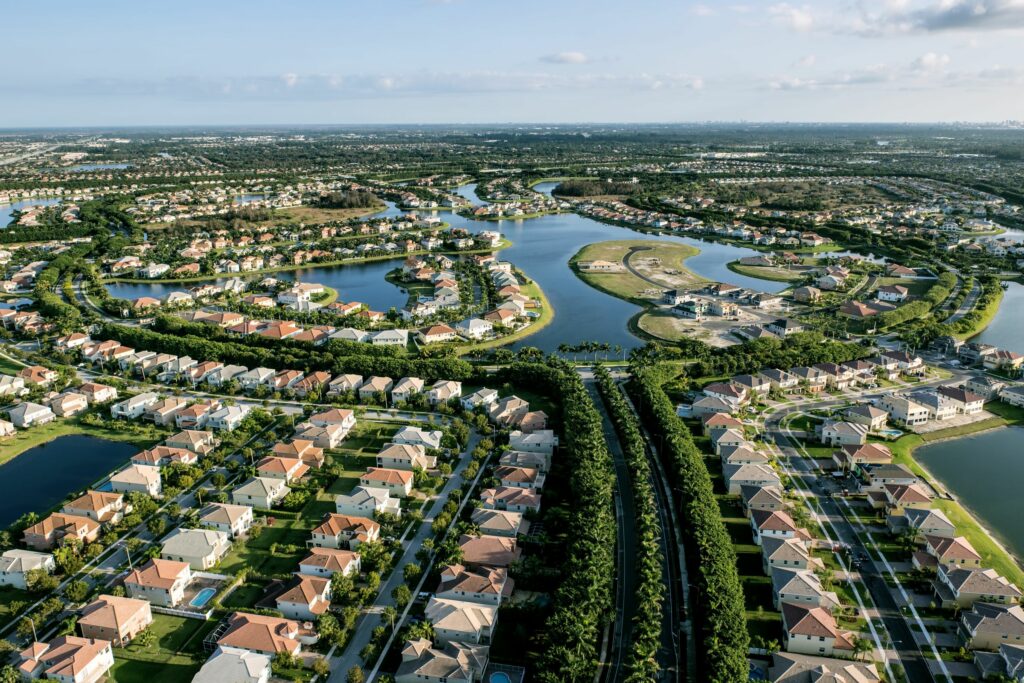
Florida Residential Construction Review – April 2023

Last month, there were approximately 8,445 new residential construction permits added to the HBW database for Florida; this figure reflects nearly double the number of permits on record for the Sunshine State in March.

Out of the five regions included in the report (Southwest, Tampa, Orlando, Southeast, Jacksonville), the greatest concentration of new construction took place in the Tampa area (2,462 permits), while the highest average value of construction could be found in the southeastern region of the state (average value: $349,983).

Here is a breakdown of new residential construction permit data on record with HBW for Florida (and by region) during the month of April 2023:

Tampa

Total # of Permits: 2,462

Average Value of Construction: $272,075

Top Counties for New Home Construction: Polk County (662 permits); Pasco County (653 permits)

Southwest

Total # of Permits: 2,166

Average Value of Construction: $308,766

Top Counties for New Construction: Lee County (764 permits); Manatee County (448 permits)

Orlando

Total # of Permits: 1,802

Average Value of Construction: $327,051

Top Counties for New Construction: Brevard County (554 permits); Orange County (511 permits)

Jacksonville

Total # of Permits: 1,109

Average Value of Construction: $280,632

Top Counties for New Construction: St. Johns County (362 permits); Duval County (326 permits)

Southeast

Total # of Permits: 905

Average Value of Construction: $349,983

Top Counties for New Construction: St. Lucie County (344 permits); Palm Beach County (237 permits)

To gain more information on the builders, homeowners and permits for the construction activity above, check out HBW for your copy of the latest construction data reports. To gain access to the HBW database and receive custom and detailed reports on the latest residential and commercial building activity in Florida, Georgia, Texas, Alabama, and Oklahoma, please contact HBW for details.

HBW Report: Florida Swimming Pool Construction – April 2023

An overview of permit data for new pool construction in Florida during the month of April

Last month, there were approximately 2,300 new swimming pool construction permits with a total value in excess of $164M added to the HBW database for Florida.

Out of the five regions reviewed (Tampa, Southwest, Orlando, Southeast, Jacksonville), the greatest volume of new pool construction could be found in the southwestern region of the state (671 permits), while the highest average value of construction took place in the Jacksonville area (average value: $91,749).

From total permits and average value of construction to leading counties and contractors, here is a closer look at the latest permit data on record with HBW for new swimming pool construction in the Sunshine State last month:

Total Permits

As previously mentioned, Southwest Florida held the highest concentration of new pool construction activity last month in comparison to other regions reviewed. Total permits by regions are as follows:

Southwest – 671 permits

Southeast – 523 permits

Tampa – 482 permits

Orlando – 427 permits

Jacksonville – 198 permits

Top Counties

Across the state, there were five counites that carried approximately 36 percent of all new pool construction, and those counties are as follows:

  1. Lee County (Southwest) – 214 permits
  2. Hillsborough (Tampa) – 163 permits
  3. Palm Beach County (Southeast) – 160 permits
  4. Orange County (Orlando) – 155 permits
  5. Miami-Dade (Southeast) – 145 permits

Construction Value

The average value of new pool construction in Florida last month ranged from a high of $91,749 (Jacksonville) to a low of $66,332 (Southeast). The average value of new swimming pool construction permits by region is as follows:

  1. Jacksonville (average value: $ 91,749)
  2. Tampa (average value: $ 74,714)
  3. Southwest (average value: $ 69,179)
  4. Orlando (average value: $ 67,717)
  5. Southeast (average value: $ 66,332)

Top Pool Builders

Out of the hundreds of pool contractors with new permits on record last month, the following ranked as the #1 builder in each region based on the total number of new swimming pool construction permits on record for the one-month period:

  • Southwest: Aragon Pools & Spas (45 permits)
  • Southeast: Fountain Blue Pool (44 permits)
  • Tampa: T&D Pool & Spa Construction (42 permits)
  • Orlando: Dreamscapes Pools & Spas (38 permits)
  • Jacksonville: Agua Pools & Spas (14 permits)

To gain more information on the builders, homeowners and permits for the construction activity above, check out HBW for your copy of the latest construction data reports. To gain access to the HBW database and receive custom and detailed reports on the latest residential and commercial building activity in Florida, Georgia, Texas, Alabama, and Oklahoma, please contact HBW for details.
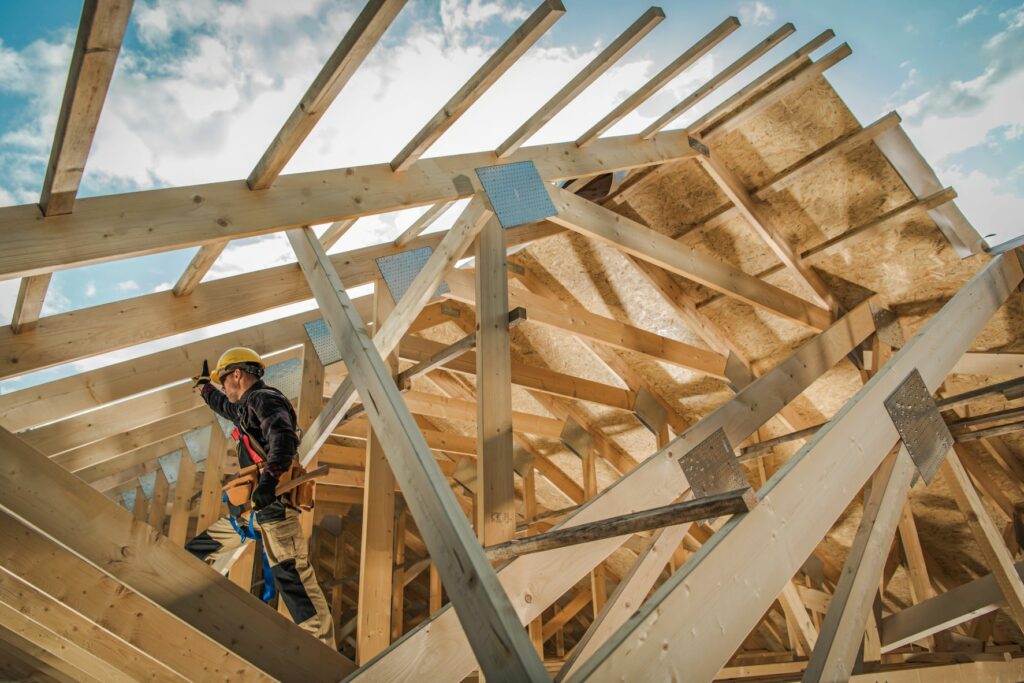
Texas Swimming Pool Construction Review – April 2023

An overview of new swimming pool construction activity in Texas based on new permits on record with HBW during the month of April

The latest and greatest construction data reports are in and based on permit data for new swimming pool construction in Texas, there were approximately 725 new permits with a total construction value of nearly $48.4M added to the HBW database last month.  Out of the four metro areas covered in the report (Dallas, Houston, Austin, San Antonio), the greatest amount of new pool construction took place in Dallas (320 permits), while the highest average value of construction could be found in Austin (average value: $100,640).

Here is a closer look at the total permits, leading counties, and top ranked contractors for new swimming pool construction in the Lone Star State last month:

Dallas

In Dallas, there were 320 new swimming pool construction permits with a total value in excess of $18M on record with HBW last month. The average value of construction was $56,651, and well more than half of all new permits originated from the two counties of Dallas (109 permits) and Tarrant (102 permits).

Out of approximately 150 pool builders with new construction activity on record in the Dallas area last month, the following ranked as the top five for total new permits:

Builder
1-Claffey Pools
2-Riverbend Pools
3-Venture Custom Pools
4-Puryear Custom Pools
5-BMR Pools

Houston

Last month, there were 211 new swimming pool construction permits with a total value of approximately $16M on record for the Houston area. The average value of construction was $75,438, and more than half of all new permits originated from Harris County (133 permits).

Out of approximately 130 builders with new swimming pool construction activity on record in the area last month, the following ranked as the top five for total new permits:

Builder
1-Platinum Pools
2-Premier Pools
3-Cypress Custom Pools
4-Richard’s Total Backyard
5-McKinney Custom Pools

Austin

In Austin, there were 110 new swimming pool construction permits with a total value in excess of $11M on record with HBW last month. As previously noted, the average value of construction was highest in Austin (average value: $100,640) in comparison to other Texas areas reviewed, and the majority of all new pool construction took place in Travis County (85 permits).

Out of more than 70 contractors with new swimming pool construction permits on record in the area last month, the following ranked as the top five for total new permits:

Builder
1-Cody Pools
2-Denali Pools
3-Aquamarine Pools
4-KB Custom Pools
5-Premier Pools & Spa North Austin

San Antonio

Last month, there were more than 80 new swimming pool construction permits with a total value of nearly $3.3M on record for San Antonio. The average value of construction was lowest in the San Antonio area (average value: $39,600) in comparison to the other metro areas reviewed, and the bulk of all construction activity could be found in Bexar County (60 permits).

Out of nearly 40 pool builders with new permit data on record last month, the following ranked as the top five for total new permits:

Builder
1-Backyard Vacation Oasis
2-Cody Pools
3-Keith Zars Pools
4-Gary Pools
5-Mission Custom Pools

To gain more information on the builders, homeowners and permits for the construction activity above, check out HBW for your copy of the latest construction data reports. To gain access to the HBW database and receive custom and detailed reports on the latest residential and commercial building activity in Florida, Georgia, Texas, Alabama, and Oklahoma, please contact HBW for details.