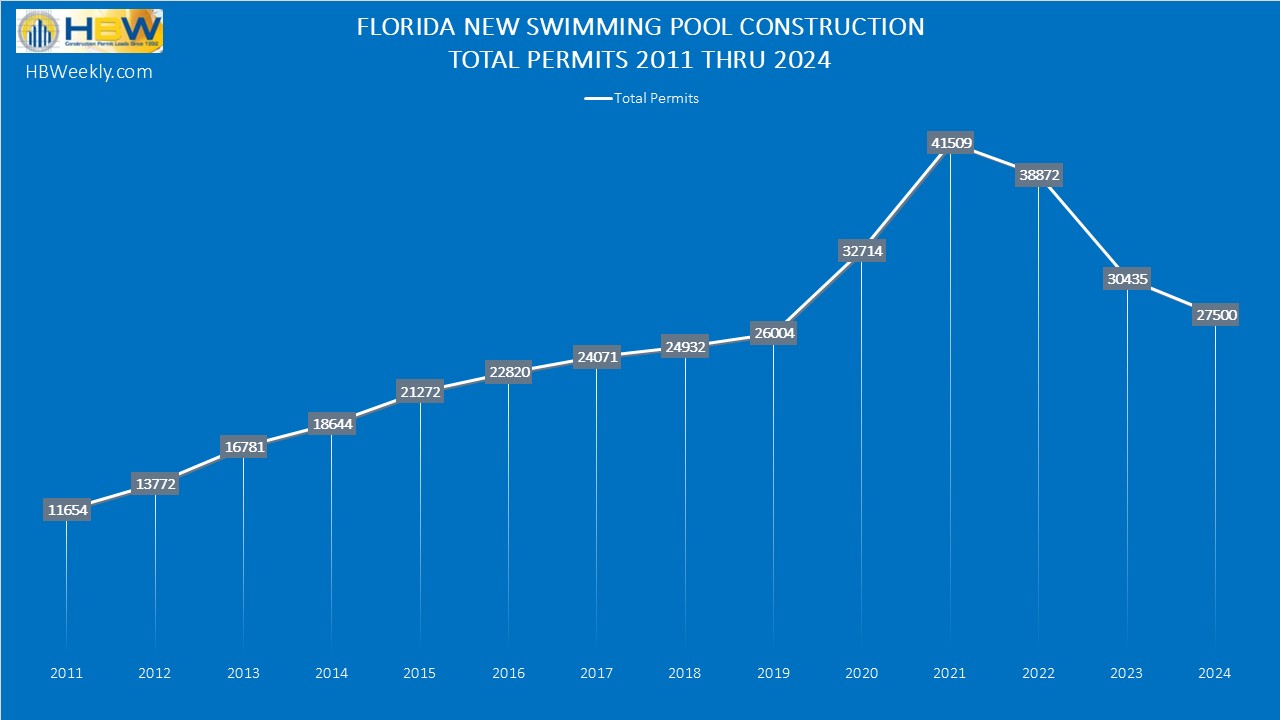
Across the state, swimming pool construction has been steadily declining throughout Florida since 2022. While swimming pools usually come to mind when thinking of Florida, in 2024 the volume of new construction permits was the lowest it has been since 2019; that being stated, there were a handful of counties that actually landed ahead of last year’s figures and exhibited some potential for improvement in the market (Palm Beach, Sarasota, and more).
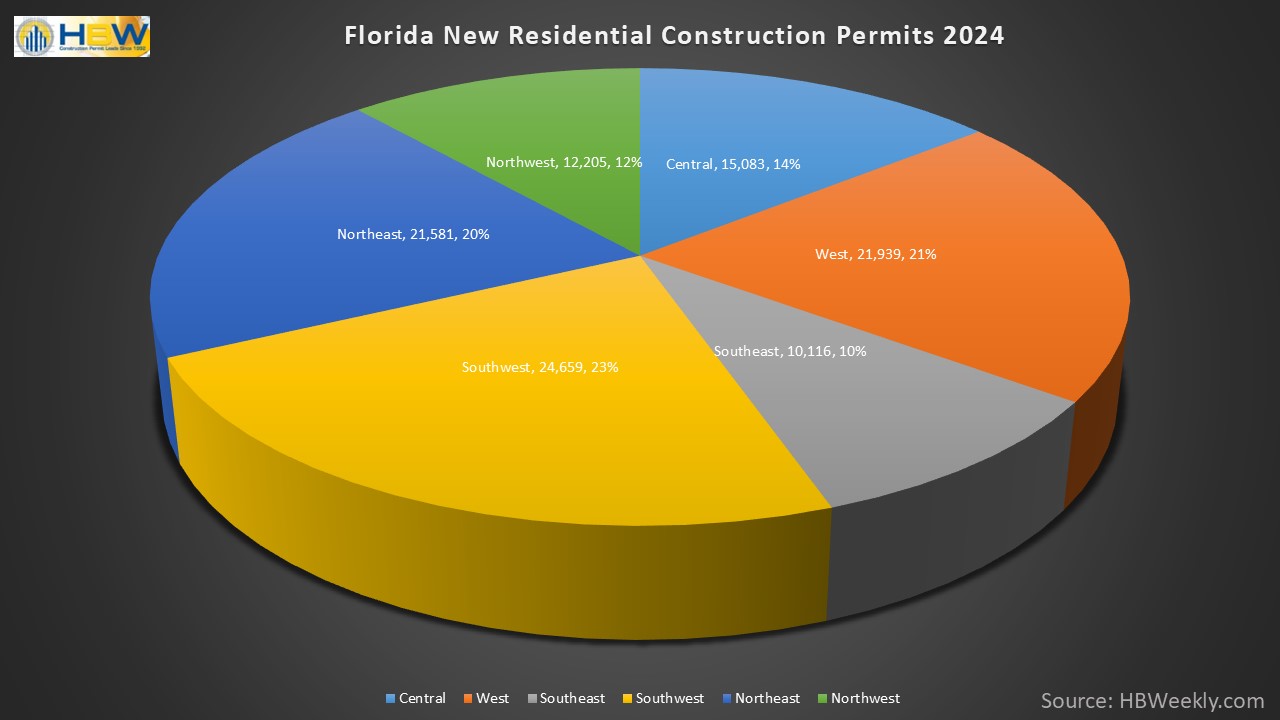
Based on the latest HBW Swimming Pool Construction Activity Trend Reports for Florida, last year there was an 11 percent year-over-year decrease in new pool construction, resulting in 27,500 new permits on record with HBW. Out of the six regions included in the report (Southeast, Southwest, Northeast, Northwest, Central and West), the highest concentration of new permits could be found in Southwest Florida (8,364 permits); in comparison to other Florida areas reviewed, the southwestern region also reflected the lowest annual rate of change with just a 4 percent year-over-year decrease in new permits.
Here is a breakdown of the total permits, year-over-year rates of change and leading counties for new swimming pool construction throughout the Sunshine State last year:
Southwest
Total Permits in 2024: 8,364
Annual % Change (YOY): -4 percent
Leading Counties for new permits: Lee County (2,435 permits, -10% YOY); Sarasota County (1,676 permits, +23% YOY); Collier County (1,597 permits, -14% YOY)
Southeast
Total Permits in 2024: 5,266
Annual % Change (YOY): -13 percent
Leading Counties for new permits: Palm Beach County (2,051 permits, +6% YOY); Miami-Dade County 1,186 permits, -3% YOY)
West
Total Permits in 2024: 4,198
Annual % Change (YOY): -21 percent
Leading Counties for new permits: Hillsborough County (1,471 permits, -14% YOY); Sumter County (712 permits, -3% YOY);
Central
Total Permits in 2024: 4,008
Annual % Change (YOY): -13 percent
Leading Counties for new permits: Orange County (1,068 permits, -33% YOY); Lake County (961 permits, +35% YOY)
Northeast
Total Permits in 2024: 2,976
Annual % Change (YOY): -7 percent
Leading Counties for new permits: St. Johns County (1,045 permits, -7% YOY); Duval County (565 permits, -11% YOY)
Northwest
Total Permits in 2024: 2,688
Annual % Change (YOY): -11 percent
Leading Counties for new permits: Walton County (538 permits, -7% YOY); Bay County (437 permits, -9% YOY); Santa Rosa County (435 permits, -19% YOY)
To gain more information on the builders, homeowners and permits for the construction activity above, check out HBW for your copy of the latest construction data reports. To gain access to the HBW database and receive custom and detailed reports on the latest residential and commercial building activity in Florida, Georgia, Texas, Alabama, and Oklahoma, please contact HBW for details.