Texas Residential Construction Review – April 2024

Based on the latest construction data reports available from HBW, there were more than 7,900 new residential construction permits with a total value of nearly $2.5 billion added to the HBW database for Texas last month.  Out of the four major Texas Metro areas reviewed (Dallas, Houston, Austin, San Antonio), the greatest volume of housing starts could be found in the Houston area where there were 4,022 new permits, while the highest average value of construction could be found in Dallas (average value: $389,557).

Here is a closer look at the total permits, construction values, and leading counties for new home construction in Texas during the month of April:

Houston

As noted above, Dallas carried the greatest volume of new home construction in comparison to other Texas areas reviewed last month, having 4,022 new permits with a total construction value in excess of $1.1 billion added to the HBW database. The average value of new residential construction projects was $285,718, and the majority of all new permits originated from the counties of Harris (1,667 permits) and Montgomery (1,074 permits).

Dallas

Last month, Dallas ranked #2 for new home construction having 2,085 new residential construction permits with a total value in excess of $812 million on record with HBW.  The average value of construction was highest in Dallas (average value: $389,557) in comparison to other Texas areas reviewed, and more than half of all new permits originated from Collin County (1,155 permits).

San Antonio

Last month, there were just over 910 new residential construction permits with a total value of approximately $194 million in San Antonio.  The average value of new home construction was lowest in San Antonio (average value: $212,685) in comparison to other metro areas reviewed, and well more than half of all new construction took place in Bexar County where there were 646 permits on record for the one-month period.

Austin

In Austin, there were approximately 890 new residential construction permits with a total value of nearly $297 million during the month of April. The average value of new home construction was $334,197, and half of all new construction took place in Travis County where there were 444 new permits on record for the one-month period.

To gain more information on the builders, homeowners and permits for the construction activity above, check out HBW for your copy of the latest construction data reports. To gain access to the HBW database and receive custom and detailed reports on the latest residential and commercial building activity in Florida, Georgia, Texas, Alabama, and Oklahoma, please contact HBW for details.

New Home Construction in Florida Q1-2024

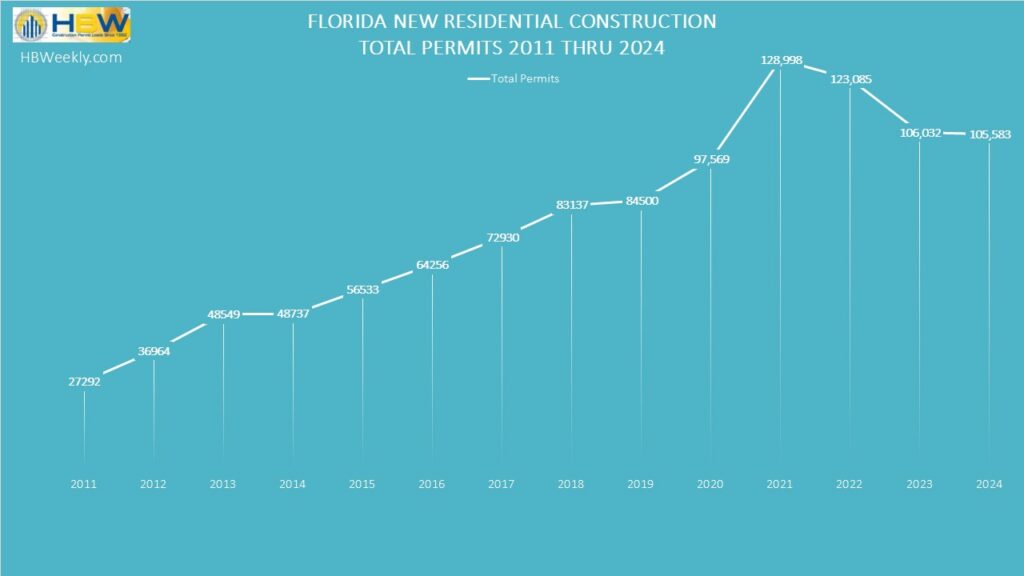
Florida’s residential construction market has started off strong in the first quarter of this year.  From January through March, there have been approximately 26,840 new residential construction permits recorded by HBW, reflecting an impressive 31 percent increase in comparison to the same time last year.  Across nearly all regions reviewed, there have been significant spikes in new home construction ranging from 8 percent (Northwest) to more than 52 percent (West).  Out of the six regions reviewed (Northeast, Northwest, Central, Southwest, Southeast, West), the greatest volume and year-over-year growth in new home construction could be found in West Florida (7,020 permits) where there has been a 52+ percent increase in new construction in comparison to the same period last year.

Here is a breakdown of the total permits, leading counties, and year-over-year rate of change/growth in the six regions included in the latest HBW Building Activity Trend Report for new home construction in the Sunshine State:

West

As previously noted, the western region of Florida held the highest volume of new permits in the first quarter of this year; the region experienced a 52.4 percent increase in new home construction in comparison to the same time last year, resulting in 7,020 new permits on record with HBW.  Out of the seven counties reviewed in the area, the greatest amount of new home construction activity could be found in Polk County and Pasco County where there were 2,690 and 1,488 permits respectively.

Southwest

In the first quarter of this year, there have been 6,246 new residential construction permits on record for the southwestern region of Florida, reflecting approximately a 36 percent year-over-year increase in new home construction.  Out of the five counties that make up the area, the greatest concentration of new home construction activity could be found in Lee County where there was close to a 72 percent year-over-year increase in new home construction, resulting in 2,683 new permits on record.

Northeast

As of the start of this year, new home construction has been on the rise in the northeastern region of Florida; in the first quarter, there have been 5,345 new permits recorded for the area, reflecting more than a 50 percent year-over-year increase in new home construction.  Out of the eight counties that make up the region, more than half of all new permits originated from St. Johns (1,487 permits) and Marion (1,474 permits).

Central

In Q1-2024, there have been 3,150 new residential construction permits added to the HBW database for the Central Florida region, reflecting a 7 percent year-over-year decrease in new home construction.  Out of the six counties that make up Central Florida, nearly half of all new permits originated from the two counties of Brevard and Orange where there were 790 and 708 new permits respectively.

Northwest

From January through March of this year there have been approximately 2,800 new residential construction permits recorded for the northwestern region of Florida, reflecting an 8 percent increase in new home construction in comparison to the same time last year.  The regional report for the northwest included 16 Florida counties, in addition to two counties along the Alabama border; out of the 18 counties reviewed, the highest concentration of new home construction could be found in Bay County and Santa Rosa County where there were 632 and 379 new permits respectively.

Southeast

Since the start of this year (thru March) there have been nearly 2,280 new permits added to the HBW database for the southeastern region of Florida, reflecting a 25 percent year-over-year increase in new home construction.  Out of the seven counties that make up the region, St. Lucie County and Palm Beach County carried the greatest volume of new home construction having 856 and 518 new permits on record with HBW respectively.

To gain more information on the builders, homeowners and permits for the construction activity above, check out HBW for your copy of the latest construction data reports. To gain access to the HBW database and receive custom and detailed reports on the latest residential and commercial building activity in Florida, Georgia, Texas, Alabama, and Oklahoma, please contact HBW for details.
Florida Swimming Pool Construction: Q1-2024

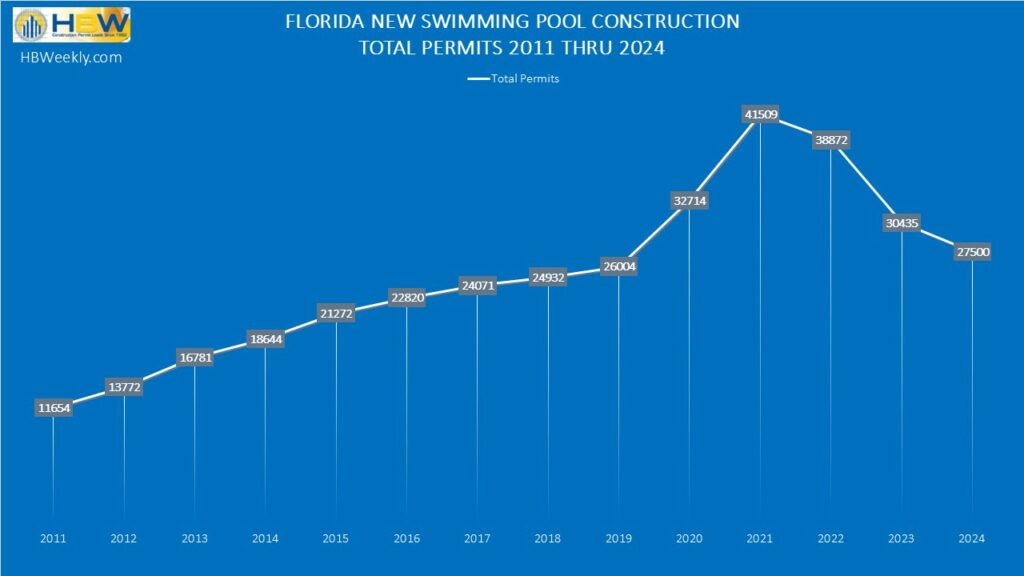
Since the start of this year (thru March 2024), there have been 6,462 new swimming pool permits added to the HBW database for Florida, reflecting approximately a 3 percent year-over-year decrease in new pool construction.  In HBW’s latest “Swimming Pool Construction Activity Trend Report”, six major Florida regions were reviewed (Central, West, Southeast, Southwest, Northeast, Northwest), and nearly half of all new swimming pool construction activity could be found in the southwestern and southeastern sections of the state where there were 1,836 and 1,280 new permits on record for the three-month period respectively.

Here is a closer look at the total permits and leading counties for new pool construction throughout the Sunshine State from January through March of this year:

Southwest Florida

Total Permits thru Q1-2024: 1,836 permits

% Change in Permits (YTD – 2023 vs. 2024): +2.8 percent

Leading County for Total Permits: Lee County (569 permits)

Southeast Florida

Total Permits thru Q1-2024: 1,280 permits

% Change in Permits (YTD – 2023 vs. 2024): -1 percent

Leading County for Total Permits: Palm Beach County (531 permits)

West Florida

Total Permits thru Q1-2024: 1,205 permits

% Change in Permits (YTD – 2023 vs. 2024): -4.3 percent

Leading County for Total Permits: Hillsborough County (334 permits)

Central Florida

Total Permits thru Q1-2024: 853 permits

% Change in Permits (YTD – 2023 vs. 2024): -14.7 percent

Leading County for Total Permits: Orange County (237 permits)

Northeast Florida

Total Permits thru Q1-2024: 709 permits

% Change in Permits (YTD – 2023 vs. 2024): +5.8 percent

Leading County for Total Permits: St. Johns County (255 permits)

Northwest Florida

Total Permits thru Q1-2024: 579 permits

% Change in Permits (YTD – 2023 vs. 2024): -13.8 percent

Leading County for Total Permits: Bay County (123 permits)

To gain more information on the builders, homeowners and permits for the construction activity above, check out HBW for your copy of the latest construction data reports. To gain access to the HBW database and receive custom and detailed reports on the latest residential and commercial building activity in Florida, Georgia, Texas, Alabama, and Oklahoma, please contact HBW for details.
Texas Swimming Pool Construction Quarterly Review (Q1-2024)

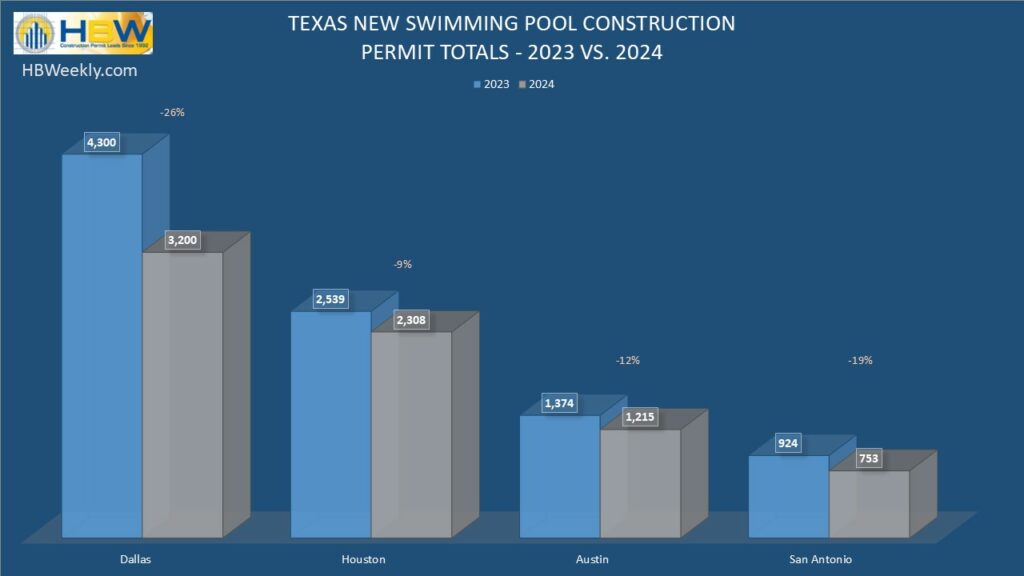
After last year’s significant drop in the market, new swimming pool construction appears to still be on a slow decline in Texas while showing signs of improvement.  In the first quarter of this year, there have been more than 1,700 new swimming pool construction permits added the HBW database from the combined areas of Dallas, Houston, Austin and San Antonio; this reflects an 8 percent decrease in new pool construction in comparison to the same time last year. 

All areas reviewed (with the exception of Dallas) have demonstrated slight gains in new pool construction activity, with year-over-year increases ranging from 3 percent (San Antonio) to 6 percent (Austin). 

Here is a closer look at the total permits and leading counties for new swimming pool construction in Dallas, Houston, Austin and San Antonio during Q1-2024: 

Dallas 

In the first quarter of this year, Dallas carried the highest concentration of new swimming pool construction permits, having 717 new permits on record with HBW; this reflects a 21 percent year-over-year decrease in permits. Out of the six counties reviewed in the Dallas area, the greatest amount of new pool construction activity could be found in Dallas County where there were more than 240 new permits that resulted from a 2 percent year-over-year decrease in new swimming pool construction. 

Houston 

The Houston area demonstrated a 5 percent year-over-year increase in new swimming pool construction which resulted in approximately 495 new permits on record with HBW in the first quarter of this year.  Out of the five counties reviewed in the Houston area, the greatest volume of new swimming pool construction could be found in Harris County where there was an 11 percent year-over-year increase resulting in more than 325 new permits on record for the three-month period. 

Austin 

In the first quarter of this year, new swimming pool construction in the Austin area was ahead of last year’s figures by 6 percent, resulting in 320 new pool permits on record with HBW.  Out of the four counties reviewed, the majority of all construction took place in Travis County where there were 265 new permits on record for the three-month period. 

San Antonio 

From January through March of this year, there have been nearly 180 new swimming pool construction permits that have originated from San Antonio, reflecting a 3 percent increase in comparison to the same time last year.  Out of the three counties reviewed, well more than half of all new pool construction activity took place in Bexar County where there were 138 new swimming pool construction permits in the first quarter of this year. 

To gain more information on the builders, homeowners and permits for the construction activity above, check out HBW for your copy of the latest construction data reports. To gain access to the HBW database and receive custom and detailed reports on the latest residential and commercial building activity in Florida, Georgia, Texas, Alabama, and Oklahoma, please contact HBW for details. 

Quarterly Report: Texas Residential Construction Q1-2024

Based on HBW’s latest Building Activity Trend Report for new residential construction in Texas, the Lone Star State experienced an impressive 64 percent year-over-year increase in new home construction during Q1-2024.  From the combined metro areas of Dallas, Houston, San Antonio and Austin there were more than 18,530 new residential construction permits added to the HBW database during the first quarter.  Out of the four areas reviewed, the bulk of permits originated from Houston and Dallas, where there were 8,882 and 6,131 new permits respectively, and all regions have demonstrated year-over-year growth ranging from 16 percent (Austin) to a high of 93 percent (San Antonio). 

Here is a closer look at the total permits, leading counties, and rate of growth for residential construction in Houston, Dallas, Austin and San Antonio as based on reports from HBW for Q1-2024: 

Houston 

Houston ranked #1 for volume of housing starts, having 8,882 new residential construction permits on record in the first quarter of this year; this reflects a 76 percent increase in new home construction in comparison to the same time last year.  Out of the five counties that make up the Houston area, the majority of new permits originated from Harris (4,006 permits) and Montgomery (2,711 permits) where there were year-over-year increases in new home construction of 44 percent and 129 percent respectively. 

Dallas 

In the first quarter of this year, Dallas experienced a 59 percent year-over-year increase in new residential construction, resulting in 6,131 new permits on record with HBW.  Out of the six counties that make up the Dallas area, Collin County was a standout as it carried the highest volume of new home construction (2,994 permits) and exhibited a massive 247 percent year-over-year increase in new permits. Additionally, the Dallas area held well more than half of all higher value (>$500k) housing starts on record statewide. 

San Antonio 

During the first quarter of this year, there were 1,835 new residential construction permits added to the HBW database for the San Antonio area, reflecting a 93 percent year-over-year increase in new home construction.  More than half of all residential construction took place in Bexar County where there has been a significant 115 percent year-over-year increase resulting in nearly 1,200 new permits during the three-month period. 

Austin 

In Austin, there were 1,683 new residential construction permits on record for the first quarter of this year, reflecting a 16 percent increase in new home construction in comparison to the same time last year.  Out of the four counties reviewed, more than half of all new construction took place in Travis where there were 849 new permits on record for the first quarter of this year. 

To gain more information on the builders, homeowners and permits for the construction activity above, check out HBW for your copy of the latest construction data reports. To gain access to the HBW database and receive custom and detailed reports on the latest residential and commercial building activity in Florida, Georgia, Texas, Alabama, and Oklahoma, please contact HBW for details.
HBW Report: Florida Swimming Pool Construction – March 2024

Based on the latest HBW construction data reports, there were 1,865 new swimming pool construction permits added to the HBW database for Florida last month.  Out of the five Florida regions reviewed (Southwest, Tampa, Orlando, Jacksonville, Southeast), the greatest volume of new pool construction took place in the southwestern portion of the state (731 permits), while the highest average value of construction could be found in Jacksonville (average value: $102,408).

Here is a closer look at the total permits, average value of construction, leading counties and contractors in each of the five regions of Florida during the month of March:

Southwest

Total Permits: 731

Average Value of Construction: $81,075

Top Counties for Total Permits: Sarasota County (210 permits); Lee County (178 permits)

Out of more than 175 pool contractors with new construction activity on record in the area last month, the following ranked as the top three for total new permits:

BuilderTotal Permits
1-Pinnacle USA62
2-Coast to Coast Pools60
3-Aragon Pools & Spas33

Southeast

Total Permits: 379

Average Value of Construction: $77,964

Top Counties for Total Permits: Palm Beach County (165 permits); Miami-Dade (86 permits)

Out of the 165 pool contractors with new permits on record in Southeast Florida last month, the following ranked as the top three for total new permits:

BuilderTotal Permits
1-Fountain Blue Pool Service21
2-Louden Bonded Pools18
3-Sunsational Pools & Spa13

Tampa

Total Permits: 330

Average Value of Construction: $89,144

Top Counties for Total Permits: Hillsborough County (103 permits)

Out of the approximately 130 pool builders with new construction on record in the Tampa area last month, the following ranked as the top three for total new permits:

BuilderTotal Permits
1-T&D Pool & Spa Construction28
2-Cody Pools17
3-Gulfstream Pools & Spas13

Orlando

Total Permits: 267

Average Value of Construction: $67,274

Top Counties for Total Permits: Orange County (73 permits); Brevard County (60 permits)

Out of nearly 100 pool builders with new construction on record with HBW in the Orlando area last month, the following ranked as the top three for total new permits:

BuilderTotal Permits
1-Dreamscapes Pools & Spas39
2-Bob’s Pool Service23
3-Premier Pools of Central FL9

Jacksonville

Total Permits: 158

Average Value of Construction: $102,408

Top County for Total Permits: St. Johns County (70 permits)

Out of the 65 pool contractors with new construction on record in the Jacksonville area last month, the following ranked as the top three for total new permits:

BuilderTotal Permits
1-Epic Pools & Hardscape Construction9
2-Tier 1 Pools And Spas7
3-Agua Pools & Spas7

To gain more information on the builders, homeowners and permits for the construction activity above, check out HBW for your copy of the latest construction data reports. To gain access to the HBW database and receive custom and detailed reports on the latest residential and commercial building activity in Florida, Georgia, Texas, Alabama, and Oklahoma, please contact HBW for details.
Florida Residential Construction Review – March 2024

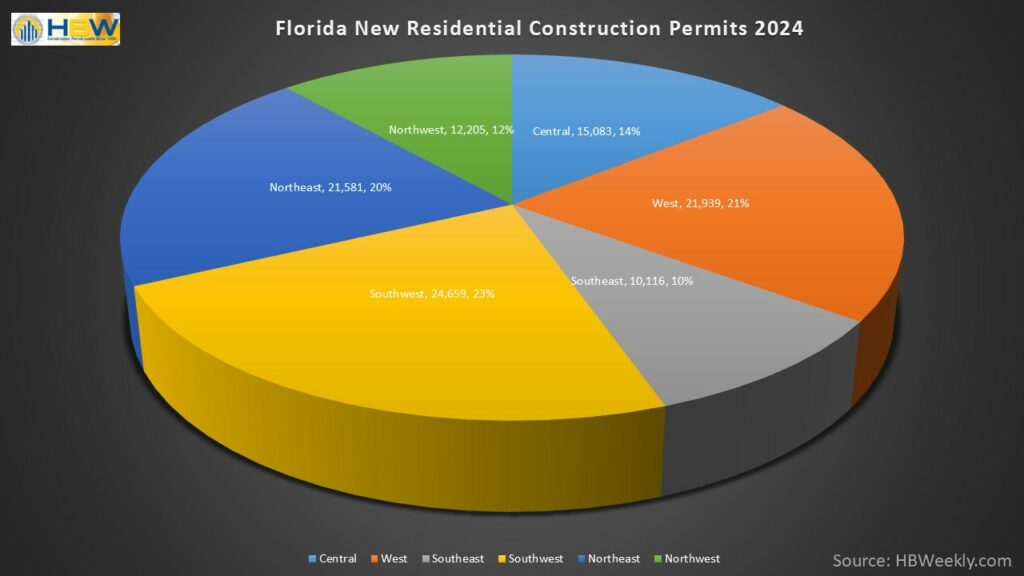
Last month, there were more than 6,555 new residential construction permits with a total construction value of $2.1+ billion in the Sunshine State. Out of the five regions reviewed (Tampa, Southwest, Orlando, Southeast, Jacksonville), the greatest volume of new home construction could be found in the southwestern region (2,261 permits), while the highest average value of construction took place in the Southeast (average value: $414,618).

Here is an overview of permit data by Florida region for new home construction during the month of March 2024:

Southwest

As previously noted, there were more than 2,260 new permits with a total construction value of $691.5 million in the southwestern region of Florida last month. The average value of new home construction was $305,872, and the majority of all new construction activity took place in the counties of Lee (747 permits) and Sarasota (559 permits).

Tampa

In Tampa, there were 1,770 new residential construction permits with a total value of $586 million on record last month.  The average value of new home construction was $331,108, and the majority of permits originated from the counties of Polk (682 permits) and Pasco (471 permits).


Jacksonville

Last month, there were 1,084 new residential construction permits with a total value of approximately $281.4 million in the Jacksonville area.  The average value of new home construction was lowest in Jacksonville (average value: $259,581) in comparison to other Florida regions reviewed, and the bulk of all new residential construction permits originated from the counties of St. Johns (460 permits) and Duval (275 permits).

Orlando

Last month, there were nearly 800 new permits with a total construction value in excess of $306 million in the Orlando area.  The average value of new home construction was $385,266, and more than half of all new construction activity took place in Brevard County (225 permits) and Orange County (192 permits).

Southeast

In the southeast, there were close to 650 new permits with a total construction value of approximately $268 million on record last month.  The average value of new home construction was highest in the area (average value: $414,618) in comparison to other Florida regions reviewed, and more than half of all new permits originated from St. Lucie County (370 permits).

To gain more information on the builders, homeowners and permits for the construction activity above, check out HBW for your copy of the latest construction data reports. To gain access to the HBW database and receive custom and detailed reports on the latest residential and commercial building activity in Florida, Georgia, Texas, Alabama, and Oklahoma, please contact HBW for details.

Atlanta Residential Construction Starts Strong in Q1

Based on the latest HBW quarterly “Building Activity Trend Report” for new residential construction in the Metro Atlanta area, new home construction is on the rise as of Q1-2024.  After a consistent pattern of annual decline since 2022, the Metro Atlanta area may be climbing out of the residential construction market slump with a strong start this year in the form of a 39 percent year-over-year increase in new permits (Q1-2024).

From January through March of this year, there have been 4,985 new residential construction permits added to the HBW database for Metro Atlanta, and nearly 40 percent of all new home construction activity took place in three out of the twenty-four counties reviewed.  Those counties are as follows:

Gwinnett County – Last quarter, Gwinnett County carried the highest concentration of new home construction activity, having 940 new permits on record with HBW for the three-month period; this reflects a 71 percent increase in residential construction in comparison to the same time last year.

Cherokee County – Cherokee County ranked #2 for new home construction during the first quarter of this year as there were 477 new permits on record with HBW for the three-month period.  After last year’s 19 percent decline in new home construction, there appears to be potential for the Cherokee County area to strengthen this year as new home construction is already 48 percent ahead of figures from the same time last year.

Fulton County – In Fulton County, there were nearly 470 new residential construction permits added to the HBW database in the first quarter of this year, reflecting a 45 percent increase in new home construction in comparison to the same time last year.

As far as higher value residential construction (>$500k) is concerned, there have been approximately 550 new residential construction projects throughout the Metro Atlanta area added to the HBW database in Q1-2024.  Nearly half of all higher value permits in the first quarter of this year have originated from Cherokee County and Fulton County where there have been 176 permits and 86 new permits added to the HBW database respectively.

Information utilized for the above listed figures for Metro Atlanta residential construction was directly derived from HBW construction data reports. To gain access to the HBW database and receive custom and detailed reports on the latest residential and commercial building activity in Florida, Georgia, Texas, Alabama, and Oklahoma, please contact HBW for details.
Texas Top Home Builders – March 2024 

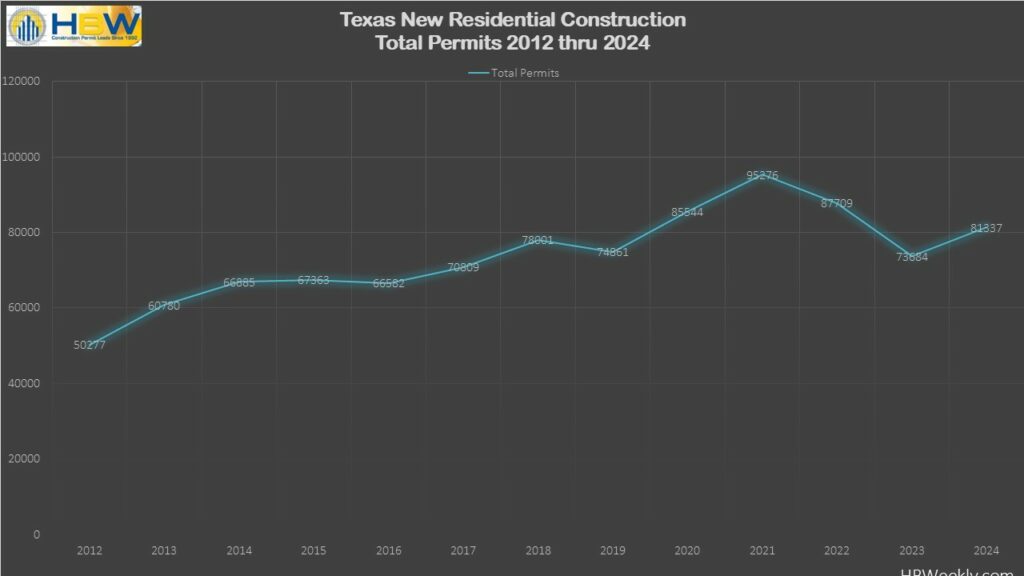
Since the release of HBW’s latest construction data reports, we have reviewed new residential construction permits in Texas to identify where the highest concentration of new home construction activity was taking place last month.  As a result, we found approximately 6,290 new residential construction permits with a total value of $1.9B. 

When diving deeper into the permit data, we are able to take a closer look at the contractors driving construction figures from a statewide and regional perspective.  Today, we are looking at the leading home builders in the four major metro regions of Texas (Houston, Dallas, Austin, San Antonio) based on the total number of new permits on record with HBW for the month of March 2024. 

Lennar Homes continues to be a leader in the market; with a combined total of 735 new permits from the four major metro areas reviewed, Lennar Homes held the top spot last month for new residential construction in the Lone Star State.  Here is a look at the top three contractors in each of the four regions based on total new permits added to the HBW database last month: 

Houston 

In Houston, there were more than 320 contractors with new residential construction activity on record with HBW last month, and the following ranked as the top three for total new permits: 

1-Lennar Homes – 315 permits

2-D.R. Horton – 279 permits

3-David Weekley Homes – 181 permits

Dallas 

Last month, there were more than 225 contractors with new residential construction activity in the Dallas area, and the following ranked as the top three for total new permits: 

1-Lennar Homes – 210 permits 

2-D.R. Horton – 129 permits 

3-Pulte Homes – 84 permits

Austin 

In Austin, there were more than 85 contractors with new residential construction activity on record with HBW last month, and the following ranked as the top three for total new permits: 

1-KB Homes – 55 permits 

2-D.R. Horton – 41 permits

3-Taylor Morrison Homes – 35 permits

San Antonio 

Last month, there were nearly 75 contractors with new residential construction activity in the San Antonio area, and the following ranked as the top three for total new permits: 

1-Lennar Homes – 188 permits

2-Continental Homes of Texas – 60 permits

3-Meritage Homes – 39 permits

To gain more information on the builders, homeowners and permits for the construction activity above, check out HBW for your copy of the latest construction data reports. To gain access to the HBW database and receive custom and detailed reports on the latest residential and commercial building activity in Florida, Georgia, Texas, Alabama, and Oklahoma, please contact HBW for details.

Texas Swimming Pool Construction Review – March 2024

The latest HBW construction data reports are in and ready for review. Based on permit data currently available, there were 520 new swimming pool construction permits with a total value of approximately $38 million added to the HBW database for Texas last month.  Out of the four major metro areas reviewed (Dallas, Houston, Austin, San Antonio), Dallas carried the greatest volume of new swimming pool construction permits (225 permits) for the month, while the highest average value of construction could be found in the Houston area (average value: $89,260).

Here is a closer look at the total permits, average value of construction, the leading counties and top pool builders in Texas during the month of March:

Dallas

As previously noted, Dallas carried the highest volume of new pool construction activity in comparison to other Texas areas reviewed, having 225 new permits with a total construction value of nearly $15 million last month.  The average value of new pool construction was $66,166, and 60 percent of all new permits originated from the two counties of Dallas (73 permits) and Collin (64 permits).

Out of nearly 120 contractors with new swimming pool construction activity on record with HBW in Dallas last month, the following ranked as the top three for total new permits:

BuilderTotal Permits
1-Riverbend Pools30
2-Foley Custom Pools10
3-Gold Medal Pools9

Houston

Last month, Houston ranked #2 for new swimming pool construction, having 145 new permits with a total construction value of nearly $13 million on record with HBW.  The average value of construction was highest in Houston (average value: $89,260) in comparison to other regions reviewed, and the majority of all new construction activity took place in Harris County (94 permits).

Out of nearly 85 contractors with new swimming pool construction permits on record in Houston last month, the following ranked as the top three for total new permits:

BuilderTotal Permits
1-Platinum Pools10
2-Avree Pools7
3-Cypress Custom Pools6

Austin

In Austin, there were nearly 100 new swimming pool permits with a total construction value in excess of $7.4 million added to the HBW database last month.  The average value of new pool construction landed on the higher end of the spectrum (average value: $75,587) in relation to other Texas areas reviewed, and nearly all new permits originated from Travis County (73 permits).

Out of approximately 60 pool builders with new construction activity on record last month, the following ranked as the top three for total new permits:

BuilderTotal Permits
1-Cody Pools17
2-Fun N Sun Pools of Austin8
3-Denali Pools6

San Antonio

Last month, there were just over 50 new swimming pool permits with a total construction value of approximately $2.7 million in the San Antonio area.  The average value of new pool construction was lowest in San Antonio (average value: $51,696) in comparison to other Texas regions reviewed, and more than half of all construction activity took place in Bexar County (36 permits).

Out of nearly 30 contractors with new swimming pool construction on record in the area last month, the following ranked as the top three for total new permits:

BuilderTotal Permits
1-Cody Pools8
2-Keith Zars Pools7
3-Gary Pools4

To gain more information on the builders, homeowners and permits for the construction activity above, check out HBW for your copy of the latest construction data reports. To gain access to the HBW database and receive custom and detailed reports on the latest residential and commercial building activity in Florida, Georgia, Texas, Alabama, and Oklahoma, please contact HBW for details.