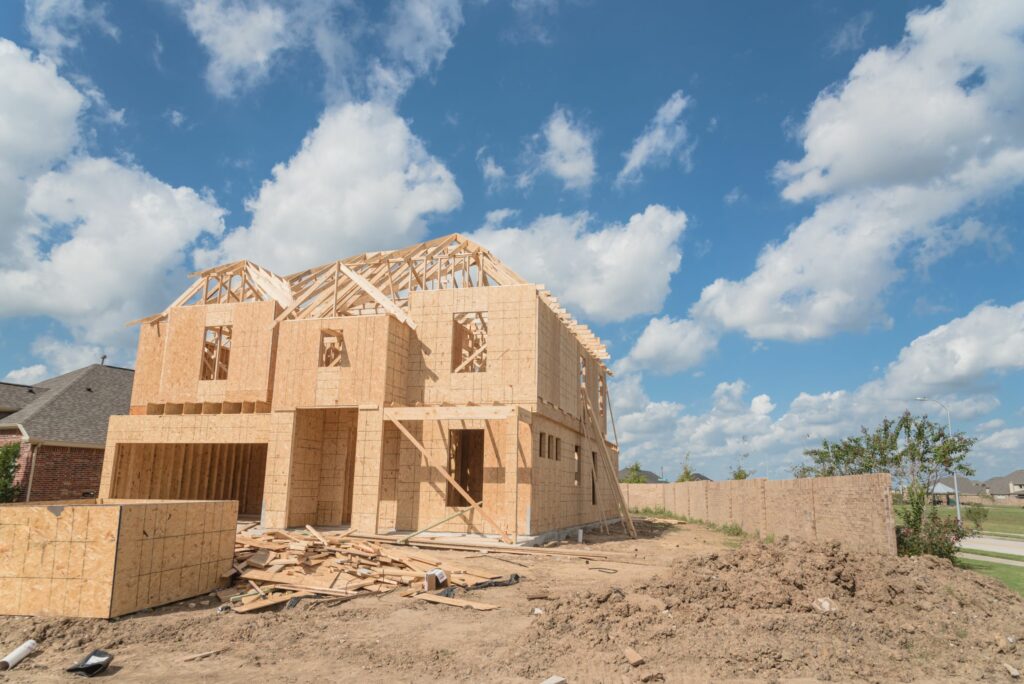
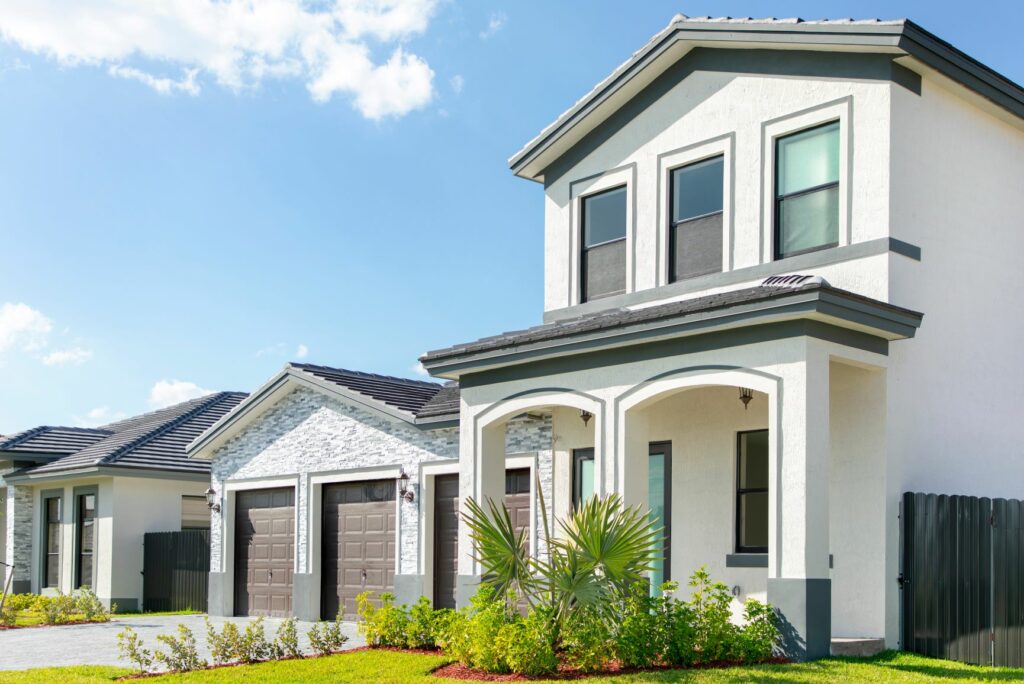
Based on HBW’s latest construction data reports, there were nearly 7,000 new residential construction permits added to the HBW database for Florida during the month of November. Out of the five major regions reviewed (Tampa, Orlando, Jacksonville, Southeast, Southwest), the Southwest ranked #1 for total new permits (1,864 permits), while also holding the highest average value of new home construction (average value: $395,490).
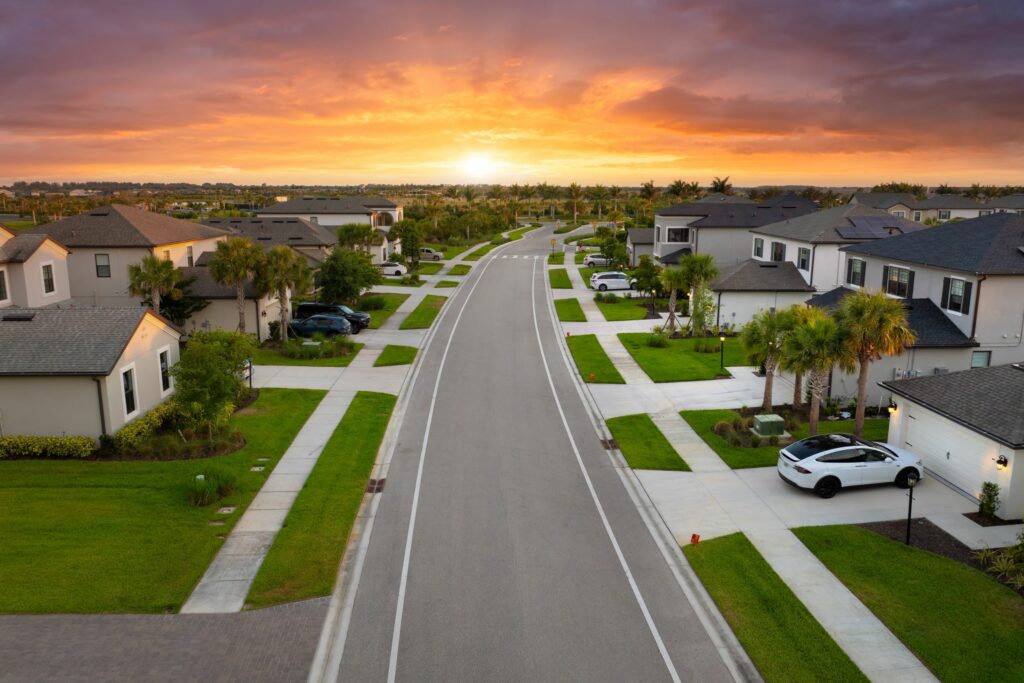
When taking a look at residential construction from a county-by-county perspective, activity was somewhat spread across the state with the most permits originating from the southwestern and northeastern regions. Upon closer review, it is evident that more than 20 percent of all new home construction in Florida originated from three counties last month.
Here is a closer look at the three leading counties for new residential construction during the month of November 2024:
Lee County
As Florida’s eighth-most populous county (population estimates – 2022: 822,453), Lee County carried the highest concentration of new home construction out of all counties in Florida last month. There were 610 new permits with a total construction value of approximately $149.2 million in Lee County during the month of November, reflecting more than 30 percent of all new residential construction in the southwestern region for the one-month period.
Sarasota County
Sarasota County ranked second-highest last month for new residential construction activity. While Sarasota is not the largest county in the southwestern region (population estimates – 2022: 462,286), the county has exhibited higher levels of new home construction. Last month, there were 477 new residential construction permits with a total value in excess of $203.7 million.
St. Johns County
In the Jacksonville area, St. Johns County ranked #3 for new residential construction last month. The County has been rapidly growing over the years, with 2022 population estimates coming in at 306,841. Last month, there were 425 new permits with a total construction value in excess of $111 million added to the HBW database for St. Johns County.
Other counties in Florida that held higher concentrations of new home construction last month were Manatee (Southwest) and Polk (Tampa) with 369 new permits each and Brevard (Orlando) with 325 new permits.
To gain more information on the builders, homeowners and permits for the construction activity above, check out HBW for your copy of the latest construction data reports. To gain access to the HBW database and receive custom and detailed reports on the latest residential and commercial building activity in Florida, Georgia, Texas, Alabama, and Oklahoma, please contact HBW for details.
When reviewing HBW’s latest construction data reports for Florida, we found that there were nearly 7,000 new residential construction permits in Florida last month, reflecting approximately a 15 percent month-over-month increase in new home construction.
HBW’s reports have a multitude of purposes – From identifying areas with the greatest demand for new construction to keeping an eye on the competition, permit data is useful for any construction professional seeking to improve business development. Today, we are using reports to identify the contractors that carried the greatest amount of new residential construction activity during the month of November.
While many home builders have a regional focus, there are two industry leaders that continue to stand out by having high levels of new construction activity in all regions across the Sunshine State – Both Lennar Homes and D.R. Horton were responsible for more than 22 percent of new home construction in Florida last month, having 924 and 658 new permits on record with HBW respectively.
Here is a closer look at the top five home builders in each of the five regions of Florida (Southwest, Tampa, Orlando, Southeast, Jacksonville) based on total number of permits on record for the month of November 2024:
Tampa
Builder
Total Permits
Average Value
1-Lennar Homes
145
$ 373,646.00
2-D.R. Horton
117
$ 273,960.00
3-Certified General Contractors
42
$ 175,000.00
4-KB Homes
41
$ 314,062.00
5-The Villages of Lake Sumter
40
$ 175,000.00
Southwest
Builder
Total Permits
Average Value
1-Lennar Homes
198
$ 241,052.00
2-D.R. Horton
193
$ 238,040.00
3-Pulte Homes
155
$ 220,172.00
4-Taylor Morrison
124
$ 159,923.00
5-BB Living Management
89
$ 407,751.00
Orlando
Builder
Total Permits
Average Value
1-Lennar Homes
270
$ 363,596.00
2-Pulte Homes
181
$ 375,241.00
3-D.R. Horton
101
$ 310,094.00
4-KB Homes
54
$ 281,859.00
5-Stanley Martin Homes
46
$ 370,647.00
Jacksonville
Builder
Total Permits
Average Value
1-D.R. Horton
222
$ 230,250.00
2-Lennar Homes
209
$ 235,747.00
3-Dream Finders Construction
132
$ 215,453.00
4-Mattamy Homes
70
$ 253,692.00
5-Pulte Homes
43
$ 177,214.00
Southeast
Builder
Total Permits
Average Value
1-Lennar Homes
102
$ 314,580.00
2-Minto Communities
72
$ 238,056.00
3-Pulte Homes
50
$ 386,504.00
4-Mattamy Homes
49
$ 179,196.00
5-GL Building Corporation
44
$ 389,607.00
To gain more information on the builders, homeowners and permits for the construction activity above, check out HBW for your copy of the latest construction data reports. To gain access to the HBW database and receive custom and detailed reports on the latest residential and commercial building activity in Florida, Georgia, Texas, Alabama, and Oklahoma, please contact HBW for details.
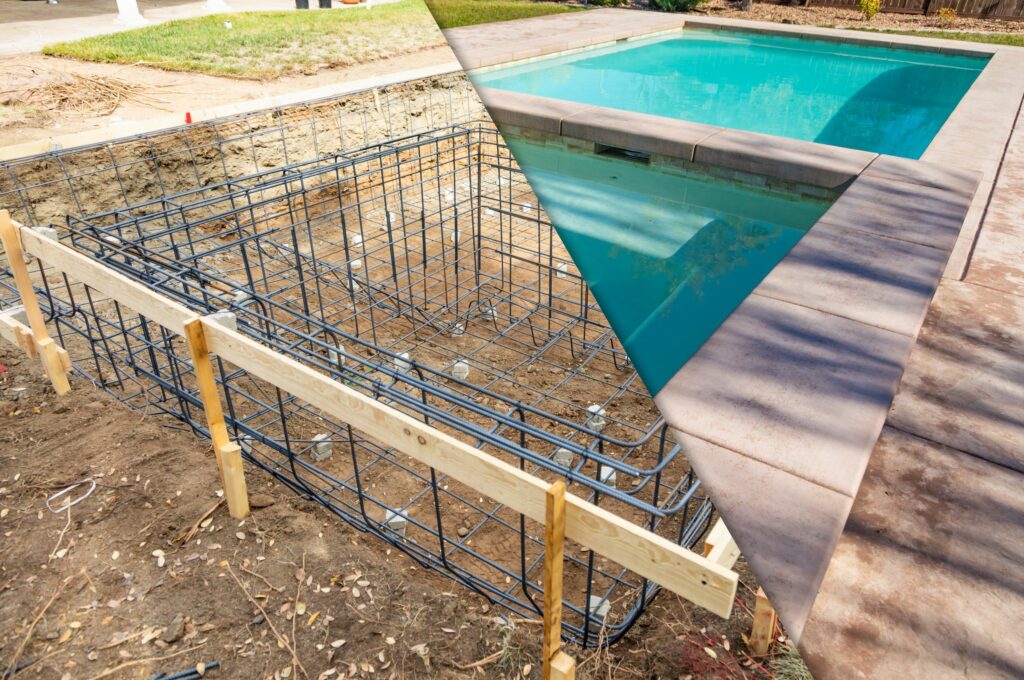
Last month, there were 1,725 new swimming pool construction permits with a total value in excess of $141.3 million added to the HBW database. Out of the five regions reviewed (Southwest, Southeast, Tampa, Orlando, Jacksonville), the greatest concentration of new pool construction took place in the southwestern region of the state (703 permits), while the highest average value of new pool construction projects could be found in the Jacksonville area (average value: $104,388).
Here is a closer look at permit data pulled from the HBW database for new swimming pool construction in Florida during the month of November:
Southwest
As noted above, the southwestern region of Florida carried the highest volume of new pool construction activity last month, having 703 new permits with a total value of approximately $55.4 million. The average value of new pool construction landed on the lower end of the spectrum (average value: $78,737) in comparison to other Florida regions reviewed, and more than half of all new permits originated from the counties of Lee (217 permits) and Sarasota (170 permits).
Out of 200 contractors with new pool construction activity on record in the southwestern region of Florida last month, the following ranked as the top three for total new permits:
Builder
Total Permits
1-Coast to Coast Pools
63
2-Pinnacle USA
55
3-Aragon Pools & Spas
43
Southeast
The southeastern region of Florida ranked #2 for new pool construction, having approximately 345 new permits with a total value of $25 million. The average value of construction was lowest in the southeast (average value: $72,737) in comparison to other regions reviewed, and the bulk of permits originated from the two counties of Palm Beach (130 permits) and Broward (68 permits).
Out of 155 contractors with new swimming pool construction on record for the southeastern region last month, the following ranked as the top three for total new permits:
Builder
Total Permits
1-Fountain Blue Pool Service
23
2-Apex Pavers & Pools
13
3-Van Kirk Construction
13
Orlando
Last month, there were more than 300 new swimming pool construction permits with a total value of approximately $25.4 million on record for the Orlando area. The average value of new pool construction was $83,551, and 54 percent of all permits originated from the counties of Orange (97 permits) and Brevard (65 permits).
Out of the 110 contractors with new swimming pool construction on record in the Orlando area last month, the following ranked as the top three for total new permits:
Builder
Total Permits
1-All Seasons
18
2-Dreamscapes Pools & Spas
18
3-Martin Pools & Spas
12
Tampa
In Tampa, there were more than 200 new swimming pool construction permits with a total value of $17.8 million added to the HBW database last month. The average value of new pool construction landed on the higher end of the spectrum (average value: $87,292) in comparison to other regions reviewed, and nearly half of all construction activity took place in the County of Hillsborough (89 permits).
Out of the 95 contractors with new pool construction on record in the Tampa area last month, the following ranked as the top three for total new permits:
Builder
Total Permits
1-Premier Pools & Spas
13
2-T&D Pool Construction
12
3-Cody Pools
10
Jacksonville
In Jacksonville, there were 170 new pool permits with a total value in excess of $17.7 million on record for the month of November. As previously noted, the average value of construction was highest in the Jacksonville area (average value: $104,388) in comparison to other regions reviewed, and the counties with the greatest amount of new pool construction included St. Johns (63 permits) and Duval (39 permits).
Out of approximately 75 pool builders with new construction activity on record last month, the following ranked as the top three for total new permits:
Builder
Total Permits
1-Blue Haven Pools
10
2-Breakwater Construction Group
8
3-Premier Pools & Spas-Jacksonville
8
To gain more information on the builders, homeowners and permits for the construction activity above, check out HBW for your copy of the latest construction data reports. To gain access to the HBW database and receive custom and detailed reports on the latest residential and commercial building activity in Florida, Georgia, Texas, Alabama, and Oklahoma, please contact HBW for details.
When reviewing the latest HBW construction data reports, we found that there were more than 7,735 new residential construction permits with a total value of approximately $2.7 billion in the Lone Star State last month. Out of the four metro areas covered in the reports (Dallas, Houston, Austin, San Antonio), the greatest concentration of new home construction took place in Dallas (3,552 permits); the Dallas area also carried the highest average value of new home construction for the month at $410,732.
Here is a breakdown of the latest permit data throughout the four major metro areas of Texas during the month of November 2024:
Dallas
Last month, the Dallas area carried more than 3,550 new residential construction permits with a total value of nearly $1.5 billion last month. The average value of new home construction was highest in the Dallas area (average value: $410,732) in comparison to other regions reviewed, and the bulk of new permits originated from Collin County (2,043 permits).
Houston
Not far behind Dallas, the Houston area has held higher levels of new residential construction in comparison to other metro areas throughout Texas. Last month, there were 3,276 new permits with a total value in excess of $927 million. The average value of new home construction was moderate at $283,048, and more than half of all new construction activity took place in Harris County where there were 1,734 new permits on record for the one-month period.
Austin
Last month, there were nearly 460 new residential construction permits with a total value in excess of $156 million on record for the Austin area. The average value of new home construction was $341,744, and nearly all new permits originated from the two counties of Travis (216 permits) and Williamson (158 permits).
San Antonio
In San Antonio, there were more than 450 new residential construction permits with a total value of approximately $112.6 million last month. The average value of new home construction was lowest in the San Antonio area (average value: $249,586) in comparison to other Texas areas reviewed, and well more than half of all new construction took place in Bexar County where there were 298 new permits on record with HBW for the one-month period.
To gain more information on the builders, homeowners and permits for the construction activity above, check out HBW for your copy of the latest construction data reports. To gain access to the HBW database and receive custom and detailed reports on the latest residential and commercial building activity in Florida, Georgia, Texas, Alabama, and Oklahoma, please contact HBW for details.
As HBW subscribers know, HBW’s construction data reports have multiple benefits for contractors’ business development and marketing efforts. From identifying areas with greatest service demand to gaining insight on competitors in any given area, HBW’s reports enable contractors to take a focused approach to identifying and capturing their targeted audience.
Today, we will be using construction data reports to identify the leading contractors that were driving new home construction throughout Texas last month.
When looking at the combined total of new permits statewide, there are three major players in the industry that are leading new residential construction across the Lone Star State. In fact, more than 21 percent of all new permits on record for November originated from the following three builders: Lennar Homes (845 permits), D.R. Horton (538 permits), and Pulte Homes (266 permits).
Taking a closer look at each metro area, we find that aside from the three industry leaders, there are a number of contractors that are holding strong in the market and contributing to new residential construction across the state. Here are the five leading home builders in each of the four major metropolitan areas of Texas during the month of November:
Houston
Last month, there were more than 330 contractors with new home construction activity on record with HBW for the Houston area, and the following ranked as the top five for total new permits:
Builder
Total Permits
Average Value
1-Lennar Homes
551
$ 235,643.00
2-D.R. Horton
430
$ 267,878.00
3-K Hovnanian Homes
120
$ 288,494.00
4-Perry Homes
118
$ 309,868.00
5-David Weekley Homes
109
$ 272,245.00
Dallas
In Dallas, there were more than 310 home builders with new construction activity on record for the month of November, and the following ranked as the top five for total new permits:
Builder
Total Permits
Average Value
1-Pulte Homes
128
$ 439,346.00
2-First Texas Homes
124
$ 438,468.00
3-Lennar Homes
120
$ 334,110.00
4-Trophy Signature Homes
119
$ 526,000.00
5-Highland Homes
115
$ 539,198.00
San Antonio
In the San Antonio area, there were more than 90 contractors with new residential construction permits on record with HBW last month, and the following ranked as the top five for total new permits:
Builder
Total No
Average Value
1-Lennar Homes
166
$ 163,542.00
2-Pulte Homes
14
$ 219,564.00
3-National Home Corp
13
$ 311,562.00
4-M/I Homes
13
$ 295,751.00
5-Perry Homes
12
$ 259,775.00
Austin
Last month, there were approximately 80 contractors with new home construction activity on record within the Austin area, and the following ranked as the top five for total new permits:
Builder
Total Permits
Average Value
1-PrimeHaven Development
55
$ 234,125.00
2-Starlight Homes Texas
32
$ 406,875.00
3-Taylor Morrison Homes
30
$ 368,000.00
4-Pulte Homes
27
$ 296,319.00
5-D.R. Horton
25
$ 195,734.00
To gain more information on the builders, homeowners and permits for the construction activity above, check out HBW for your copy of the latest construction data reports. To gain access to the HBW database and receive custom and detailed reports on the latest residential and commercial building activity in Florida, Georgia, Texas, Alabama, and Oklahoma, please contact HBW for details.
Based on the latest HBW construction data reports, there have been approximately 535 new swimming pool construction permits with a total value in excess of $36.5 million on record for the Lone Star State last month. Data from the reports were derived from permits acquired from each of the four major metro areas of Dallas, Houston, Austin, and San Antonio. Out of the four regions reviewed, the greatest concentration of new swimming pool construction could be found in Dallas (253 permits), while the highest average value of new pool construction could be found in Houston (average value: $87,396).
Here is a closer look at the total permits, average value of construction and leading contractors for new swimming pools in Texas during the month of November:
Dallas
Last month, there were 253 new swimming pool permits with a total construction value of approximately $17.6 million in the Dallas area. The average value of construction was $69,555, and more than half of all new permits originated from the two counties of Denton (71 permits) and Collin (62 permits).
Out of approximately 135 contractors with new swimming pool construction activity on record in the Dallas area last month, the following ranked as the top three for total new permits:
Builder
Total Permits
1-Riverbend Pools
19
2-Claffey Pools
12
3-BMR Pools
8
Houston
Houston ranked #2 for new pool construction having 143 new permits with a total value of $12.5 million on record last month. The average value of new swimming pool construction was highest in the Houston area (average value: $87,396) in comparison to other Texas regions reviewed, and the majority of construction took place in Harris County where there were 101 new permits for the one-month period.
Out of nearly 95 pool contractors will new construction activity on record in the Houston area last month, the following ranked as the top three for total new permits:
Builder
Total Permits
1-Avree Pools
6
2-Platinum Pools
6
3-Anthony & Sylvan Pools
6
Austin
In Austin, there were 72 new swimming pool construction permits with a total value of approximately $3.6 million on record last month. The average value of new pool permits landed on the lower end of the spectrum in Austin (average value: $49,917) in comparison to other Texas areas reviewed, and the bulk of all new permits originated from Travis County (54 permits).
Out of 45 pool builders with new construction permits on record for Austin last month, the following ranked as the top three for total new permits:
Builder
Total Permits
1-Cody Pools
11
2-Denali Pools
5
3-Paradisa Homes
5
San Antonio
Last month, there were more than 65 new swimming pool construction permits with a total value of nearly $2.9 million added to the HBW database for the San Antonio area. The average value of construction was lowest in San Antonio (average value: $43,470) compared to the other Texas regions reviewed, and the majority of construction activity took place in Bexar County (44 permits).
Out of the 30 contractors with new pool permits on record in San Antonio for the month of November, the following ranked as the top three for total new permits:
Builder
Total Permits
1-Keith Zars Pools
12
2-Blue Haven Pools
6
3-Cody Pools
5
To gain more information on the builders, homeowners and permits for the construction activity above, check out HBW for your copy of the latest construction data reports. To gain access to the HBW database and receive custom and detailed reports on the latest residential and commercial building activity in Florida, Georgia, Texas, Alabama, and Oklahoma, please contact HBW for details.
Black Friday is over and Cyber Monday has passed, so what’s next? While the month of December seems to come and go in a flash, there is still ample time to give a quick boost to your marketing efforts.
As the year winds down, contractors and construction professionals have a unique opportunity to evaluate their marketing strategies and lay the groundwork for a successful year ahead. With the right combination of reflection and preparation, you can amplify your brand visibility, strengthen client relationships, and generate leads to kickstart the new year. Here are seven actionable marketing tips tailored to construction professionals:
1. Review Your Year in Marketing
How did your marketing strategy perform in 2024? Now is the perfect time to take stock of what worked and what didn’t in your marketing efforts. How? It’s simple: Analyze key metrics like website traffic, lead conversions, and social media engagement. Review and identify campaigns that drove the most value so that you can replicate, and even improve upon, their success in the coming year.
Pro Tip: If you are not already doing so, use free and easy tools like Google Analytics or social media insights to track performance.
2. Refresh Your Website
Social media aside, your website is most often the first impression clients will have of your business. For this reason, it is critical that you take time to review it – make sure that it is updated with your latest and greatest projects, testimonials, and contact information. Do you have new products or services? Have you added a new location? Now is the time to add and update as necessary.
Additionally, you can work with your website manager to optimize content and loading speeds and ensure mobile compatibility—many prospects and clients will run a search for your company or services from their mobile devices, so at the very minimum you should check how your content and website looks from your phone.
3. Update Your Portfolio
With so many projects and locations, it is easy to overlook and forget about sharing new project successes. Showcasing your best and most recent work is crucial in the construction industry. Take some time to update your portfolio with high-quality photos, videos, or even drone footage of completed projects. Don’t forget to document the job from the start so that you can include before-and-after images that can make for a compelling story that highlights your expertise.
4. Launch a Holiday Appreciation Campaign
The holidays offer an ideal opportunity to thank clients, vendors, and industry partners. Whether you choose to send personalized holiday cards or deliver small gifts, a little gratitude can go a long way in fostering loyalty and referrals.
Pro Tip: Include a discount or special offer for repeat and/or loyal clients in the new year.
5. Create Videos
Videos are a powerful tool to showcase your work. According to HubSpot, the number of digital video viewers worldwide is more than 3.3 billion, and in 2024, 89 percent of consumers confirm that they want to see more videos from brands.
Not sure where to start? You can take first steps by creating short clips of ongoing projects, client testimonials, or behind-the-scenes tours. Social platforms including Instagram Reels, TikTok, and YouTube can help you reach a wider audience.
Pro Tip: Highlight eco-friendly practices or unique techniques to appeal to socially-conscious clients.
6. Invest in Local SEO
As most construction professionals are aware, construction is a hyper-local industry, especially for smaller operations. For this reason, it is vital that your business makes efforts to rank high in local searches. To do this, simply update your Google Business Profile with accurate information and encourage satisfied clients to leave reviews. Believe it or not, it can just take an ask or small incentive to motivate clients to provide positive feedback; share direct links to your google business profile to make it a “one-click” process.
Pro Tip: Use location-specific keywords like “best roofing contractor in [city]” on your website and social media.
7. Attend Industry Events and Network
Winter is a great time to participate in trade shows, conventions, seminars, and community events. You can utilize these networking opportunities to showcase your expertise, distribute branded marketing materials, and potentially expand your reach.
If you have been following this blog or HBW on social media, then you know that HBW follows and shares a variety of upcoming industry events. Follow us to get industry related event details delivered directly to your inbox or social feed.
Pro Tip: Take pictures at these events and share them on social media to boost credibility; don’t forget to tag companies and clients as appropriate.
By reviewing and improving your marketing efforts before the new year, and implementing some of the above listed tips, construction professionals can position their businesses for growth and success. Remember, consistency and authenticity are key in building a lasting brand. Start planning now, and you will see the benefits throughout the new year.
For more information on construction business marketing tips, stay connected with the HBW Blog. To get ahead of construction activity and gain access to the latest permitting data in Florida, Texas, Georgia, Alabama and Oklahoma, contact HBW for more information on construction data reports and industry leads.
Based on the latest HBW construction data reports, there have been 1,565 new swimming pool construction permits with a total value of approximately $132.6 million added to the HBW database for Florida last month. Out of the five regions included in the reports (Southwest, Tampa, Southeast, Orlando, Jacksonville), the southwestern region of the state held the greatest volume of new pool construction (497 permits), while the highest average value of new pool construction could be found in the southeast (average value: $95,940).
Here is a closer look at the total permits, average value, and the leading counties and contractors for new swimming pool construction in each of the five major regions of the Sunshine State during the month of October:
Southwest
Total Permits: 497 permits
Average Value of Construction: $82,729
Leading Counties (based on total permits):Lee (213 permits); Manatee (106 permits)
Top 3 Pool Builders (based on total permits):
Builder
Total Permits
1-Pinnacle USA
57
2-Trusted Pool & Spa
20
3-Holiday Pools of West Florida
19
Southeast
Total Permits: 390
Average Value of Construction: $95,940
Leading Counties (based on total permits): Palm Beach (208 permits); Miami-Dade (58 permits)
Top 3 Pool Builders (based on total permits):
Builder
Total Permits
1-Pughs Pools & Spas
26
2-Fountain Blue Pool Service
16
3-A&G Concrete Pools
13
Orlando
Total Permits: 313
Average Value of Construction: $75,408
Leading Counties (based on total permits): Lake (103 permits); Orange (85 permits)
Top 3 Pool Builders (based on total permits):
Builder
Total No
1-Bob’s Pool Service
45
2-Dreamscapes Pools & Spas
19
3-All Seasons
13
Tampa
Total Permits: 231
Average Value of Construction: $76,804
Leading Counties (based on total permits): Hillsborough (103 permits); Sumter (49 permits)
Top 3 Pool Builders (based on total permits):
Builder
Total Permits
1-T&D Pool Construction
35
2-Tampa Bay Pools on the Gulf
21
3-Cody Pools
10
Jacksonville
Total Permits: 134
Average Value of Construction: $94,775
Leading Counties (based on total permits): St. Johns (56 permits); Duval (30 permits)
Top 3 Pool Builders (based on total permits):
Builder
Total Permits
1-Blue Haven Pools
9
2-Island Pools
7
3-Anthony & Sylvan Pools
6
To gain more information on the builders, homeowners and permits for the construction activity above, check out HBW for your copy of the latest construction data reports. To gain access to the HBW database and receive custom and detailed reports on the latest residential and commercial building activity in Florida, Georgia, Texas, Alabama, and Oklahoma, please contact HBW for details.
Last week, we reviewed new residential construction activity in the Sunshine State during the month of October 2024, and as a result we reported approximately 5,260 new residential construction permits with a total value of nearly $1.7 billion on record with HBW for the one-month period. This week, we are using the same construction data reports to identify the leading home builders driving housing starts in the five regions of Florida (Southwest, Tampa, Southeast, Orlando, Jacksonville).
Statewide, there are two home builders that have consistently dominated new residential construction – Lennar Homes and D.R. Horton. From the five regions reviewed, both builders carried nearly 30 percent of all new home construction in Florida last month, having a combined total of approximately 1,500 new permits. Lennar Homes ranked #1 with 929 total new permits, while D.R. Horton ranked #2 with 569 total new permits for the month.
Here is a closer look at the leading home builders by region, along with the total new permits on record and average value of construction for the month of October:
Southwest
In the southwestern region of Florida, there were approximately 290 contractors with new residential construction permits on record with HBW for the month of October, and the following ranked as the top five for total new permits:
Builder
Total Permits
Average Value
1-Lennar Homes
299
$ 177,508.00
2-D.R. Horton
181
$ 231,379.00
3-Pulte Homes
85
$ 178,581.00
4-Taylor Morrison
67
$ 237,514.00
5-Neal Communities of SW FL
61
$ 268,913.00
Tampa
During the month of October, there were more than 180 home builders with new permits on record in the Tampa area, and the following ranked as the top five for total new permits:
Builder
Total Permits
Average Value
1-Lennar Homes
181
$ 335,022.00
2-D.R. Horton
98
$ 249,982.00
3-The Villages of Lake Sumter
53
$ 175,000.00
4-Certified General Contractors
35
$ 175,000.00
5-Pulte Homes
34
$ 429,038.00
Southeast
In the southeastern region, there were more than 120 active home builders with new construction activity on record with HBW for October, and the following ranked as the top five for total new permits:
Builder
Total Permits
Average Value
1-Lennar Homes
123
$ 268,600.00
2-Pulte Homes
96
$ 411,090.00
3-Minto Communities
88
$ 245,225.00
4-GL Building Corporation
62
$ 447,338.00
5-D.R. Horton
45
$ 171,828.00
Orlando
There were more than 150 active home builders with new construction activity on record in the Orlando area during the month of October, and the following ranked as the top five for total new permits:
Builder
Total Permits
Average Value
1-Lennar Homes
166
$ 315,665.00
2-Pulte Homes
134
$ 355,867.00
3-D.R. Horton
86
$ 291,129.00
4-M/I Homes
69
$ 491,525.00
5-Meritage Homes
52
$ 393,860.00
Jacksonville
In the Jacksonville area there were 110 active home builders with new construction activity on record with HBW during the month of October, and the following ranked as the top five for total new permits:
Builder
Total Permits
Average Value
1-Lennar Homes
160
$ 243,125.00
2-Dream Finders Construction
106
$ 250,953.00
3-D.R. Horton
79
$ 193,670.00
4-Dream Finders Homes
52
$ 232,804.00
5-Mattamy Homes
50
$ 210,258.00
To gain more information on the builders, homeowners and permits for the construction activity above, check out HBW for your copy of the latest construction data reports. To gain access to the HBW database and receive custom and detailed reports on the latest residential and commercial building activity in Florida, Georgia, Texas, Alabama, and Oklahoma, please contact HBW for details.
Last month, there were approximately 5,260 new residential construction permits with a total value of nearly $1.7 billion added to the HBW database for Florida; this reflects more than a 30 percent month-over-month decrease in new permits.
Out of the five regions reviewed (Southwest, Tampa, Orlando, Southeast, Northeast), the greatest amount of new home construction took place in the southwestern region of the state, where there were more than 1,480 new permits on record for the one-month period. Next in line, the areas of Tampa and Orlando held high amounts of new construction having 1,048 and 1,022 new permits on record respectively. On the other hand, the areas with the least amount of new residential construction permits for the one-month period were Jacksonville (931 permits) and the southeastern region (775 permits).
When looking at the average value of new home construction, Orlando (average value: $394,674) held a higher value of new residential construction projects, while the lowest average value of permits could be found in the Southwest (average value: $259,654). Here is a closer look at the average value of new home construction across the Sunshine State last month:
While certain regions predictably held higher concentrations of new home construction, when looking at HBW’s construction data reports from a county-by-county perspective, there were pockets of highly active areas dispersed throughout the state. Based on total number of new permits on record with HBW last month, the following five counties ranked as the top five for total new permits and carried more than 40 percent of all new home construction in the state:
#1. Lee County (Southwest) – 762 permits
#2. Polk County (Tampa) – 469 permits
#3. Manatee County (Southwest) – 368 permits
#4. St. Johns County (Jacksonville) – 280 permits
#5. Duval County (Jacksonville) – 278 permits
To gain more information on the builders, homeowners and permits for the construction activity above, check out HBW for your copy of the latest construction data reports. To gain access to the HBW database and receive custom and detailed reports on the latest residential and commercial building activity in Florida, Georgia, Texas, Alabama, and Oklahoma, please contact HBW for details.