Earlier this week, we examined new home construction activity across Texas using November 2025 residential construction permit data compiled by HBW. In the report, we identified 4,919 new residential permits on record across the state’s four major metro areas—Houston, Dallas, Austin, and San Antonio—representing more than $1.6 billion in total projected construction value.
Building on that foundation, this report takes a closer look at the builders driving that activity. Using the same HBW construction data reports, we have identified the leading home builders in each metro area, ranking firms based on total number of residential permits issued during the month. For the purposes of this analysis, “top” or “leading” builders are defined strictly by permit volume, offering a clear, data-driven view of market share and construction momentum.
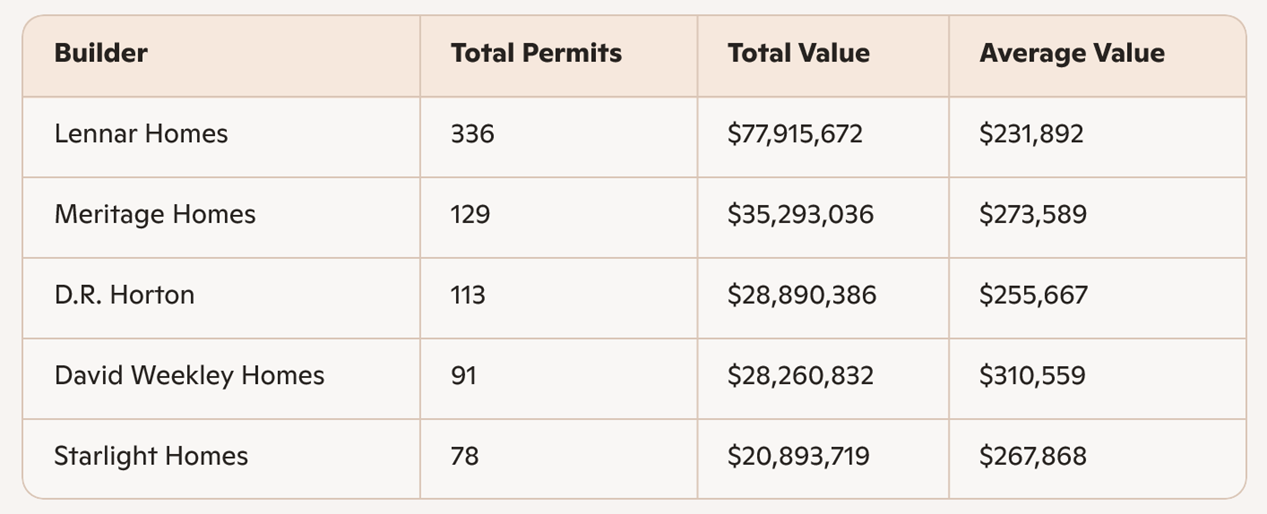
Houston
Out of approximately 310 home builders with new residential permits on record in the Houston area during November, the following firms ranked as the top five by total permit volume:
Lennar Homes led the Houston market by a wide margin, posting 350 permits with a total projected value exceeding $85.1 million. This level of activity underscores Lennar’s scale-driven production model and strong absorption across master-planned communities.
Perry Homes followed with 129 permits and an average home value above $305,000, signaling a focus on higher-priced builds within the metro. D.R. Horton ranked third with 94 permits, maintaining its consistent presence as a volume-oriented national builder.
Chesmar Homes (76 permits) and Taylor Morrison Homes (64 permits) rounded out the top five, both demonstrating steady production with average values clustered in the mid-$250,000 range—indicative of strong demand in Houston’s move-up and entry-level segments.
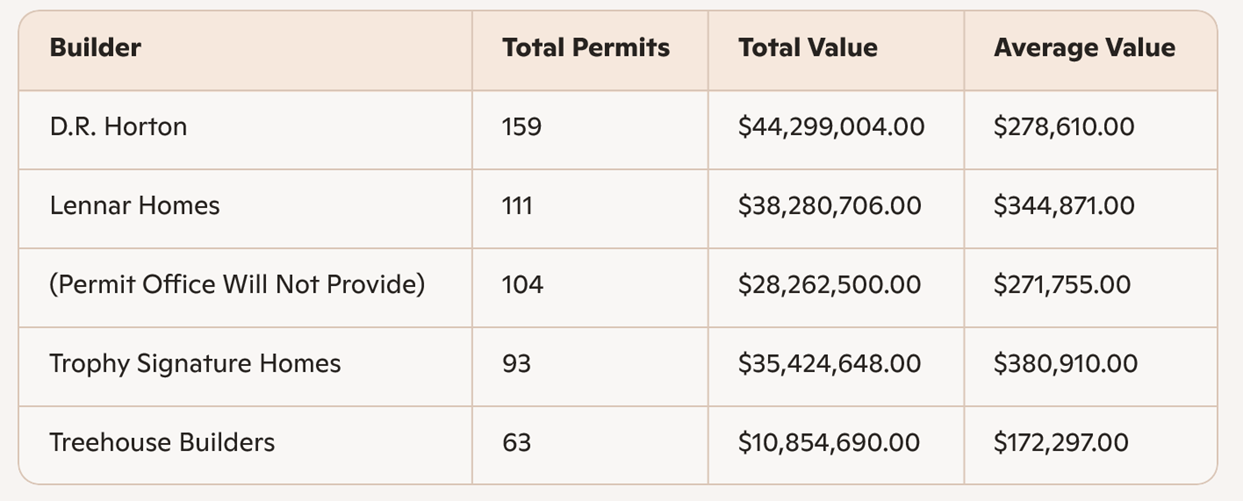
Dallas
In the Dallas area, where more than 265 builders pulled residential permits during the month, permit activity was similarly concentrated among a handful of high-volume operators.
Lennar again ranked first with 246 permits and more than $74.5 million in projected construction value. Trophy Signature Homes secured the second position with 140 permits and an average valuation exceeding $310,000.
D.R. Horton placed third with 124 permits, reinforcing its statewide footprint. The fourth-ranked entry is listed as “Permit Office Will Not Provide”, accounting for 106 permits and $27.56 million in total value.
Regarding this designation:
In some jurisdictions, permit offices may withhold or anonymize contractor names due to data privacy policies, administrative limitations, or incomplete filings at the time of reporting. While the builder identity is not disclosed, the permit volume and valuation data remain valid and highly useful. For contractors, developers, and suppliers, this information still provides meaningful insight into market demand, competitive intensity, and construction velocity, even when a specific firm name is unavailable.
Treehouse Builders completed the Dallas top five with 78 permits, operating at a lower average valuation point, which is expected with their focus on smaller homes and unique product.
Austin
Austin’s residential construction market remains more concentrated, with just over 65 builders pulling permits in November. Within that environment, competition among leading firms is notably tight.
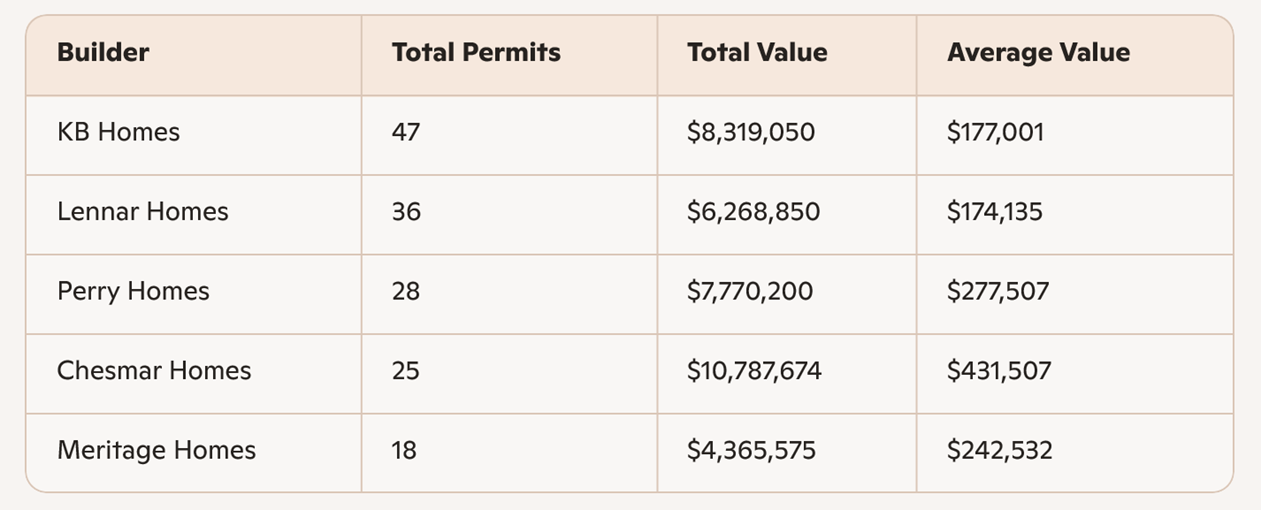
Lennar again took the top position with 51 permits, closely followed by KB Homes at 45 permits. Pulte Homes ranked third with 41 permits, posting one of the stronger average valuations (average value: $292,675) among Austin’s high-volume builders.
LCB Construction matched Pulte in permit count but at a lower average value of $213,454, while Ashton Woods Homes stood out with the highest average home value in the Austin top five, exceeding $400,000 per permit—a clear indicator of exposure to higher-end product and premium submarkets.
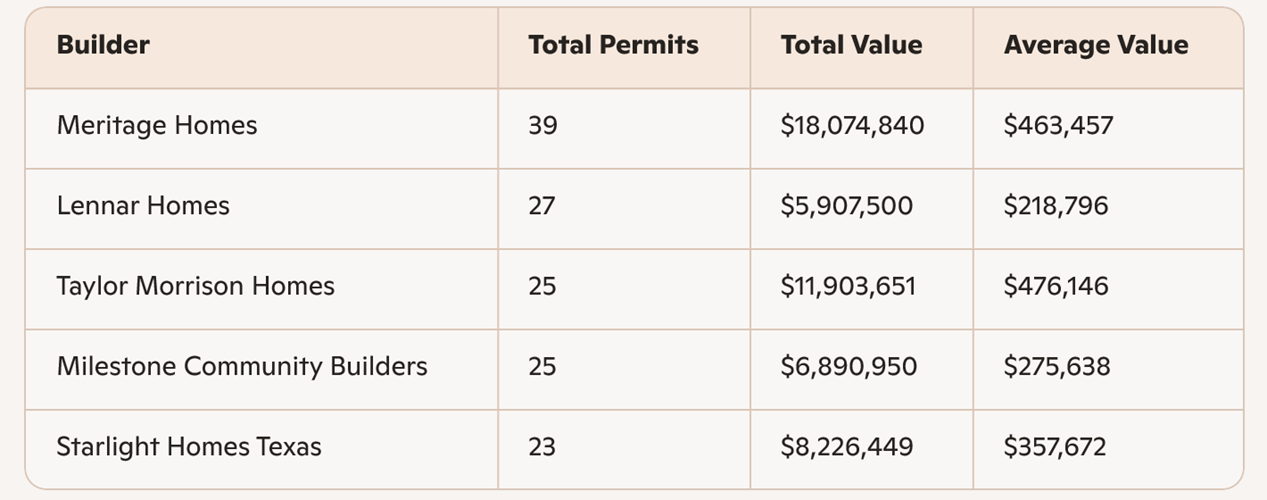
San Antonio
In San Antonio, where 65 builders recorded new residential permits, Lennar once again led the field with 75 permits and nearly $16 million in total value.
KB Homes secured the second position with 32 permits, followed by Starlight Homes (17 permits) in third. AHV Vertical (16 permits) ranked fourth, notable for an average valuation approaching $300,000, suggesting more vertically integrated or higher-complexity projects. Perry Homes (14 permits) completed the top five, reinforcing its presence across multiple Texas metros.
A key takeaway from last month’s data is the dominance of builders with multi-market reach. Lennar appears in the top five across all four metro areas, consistently ranking first in each. KB Homes, Perry Homes, and D.R. Horton also demonstrate significant cross-market penetration, underscoring the competitive advantage of scale, standardized construction processes, and strong land pipelines.
From a valuation perspective, average permit values vary meaningfully by metro and builder, reflecting differences in land costs, product mix, and buyer demographics. Recognizing the given patterns provides valuable signals for subcontractors, material suppliers, and service providers evaluating where demand is strongest and which builders are driving it.
To gain more information on the builders, homeowners and permits for the construction activity above, check out HBW for your copy of the latest construction data reports. To gain access to the HBW database and receive custom and detailed reports on the latest residential and commercial building activity in Florida, Georgia, Texas, Alabama, and Oklahoma, please contact HBW for details.