A review of permit data for new swimming pool construction in Florida during the month of September 2021

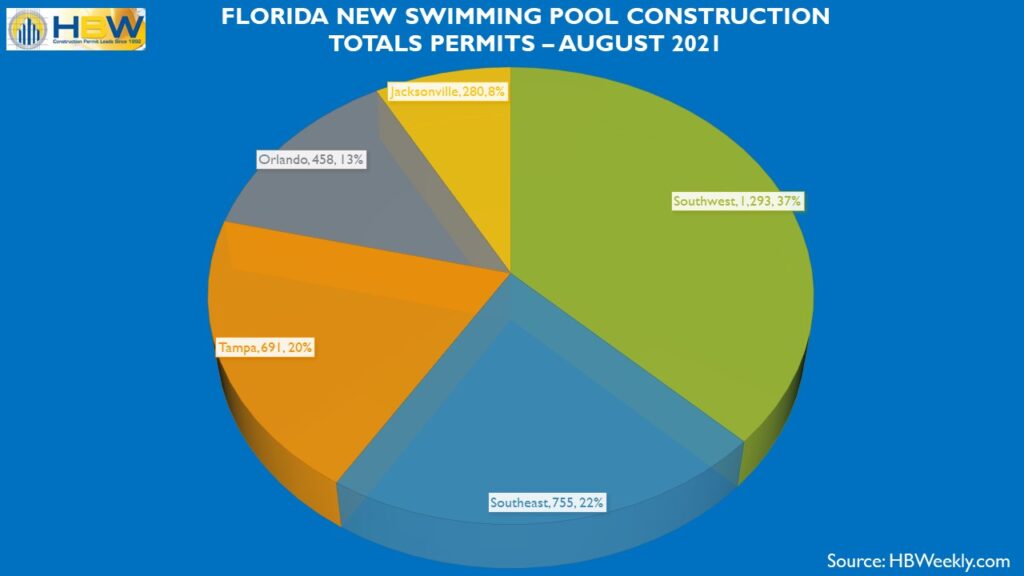
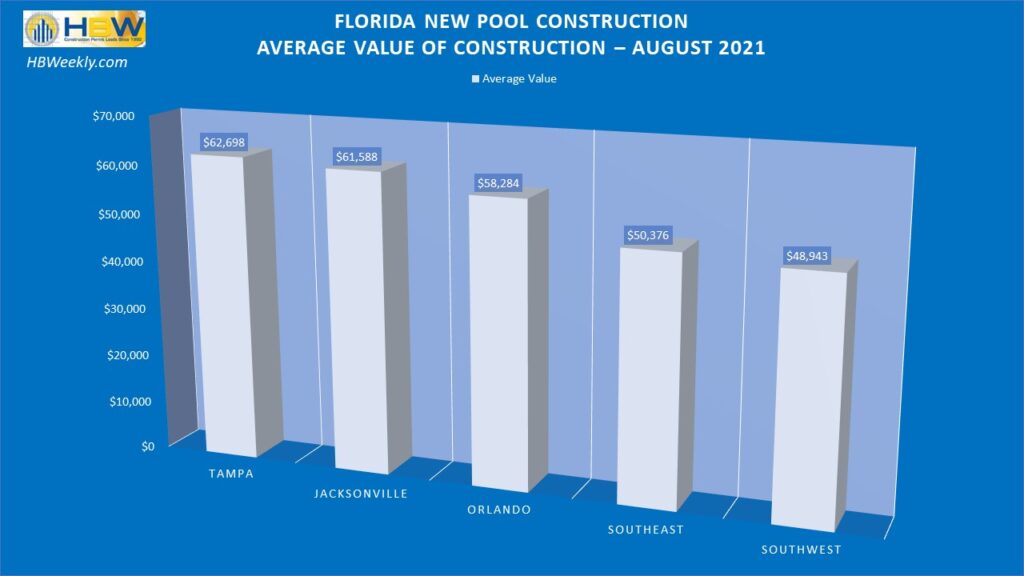
Based on the latest construction data reports from HBW, last month there were nearly 2,870 new swimming pool construction permits with a total value in excess of $160 million added to the HBW database for Florida. Out of five major regions reviewed (Tampa, Southwest, Orlando, Southeast, Jacksonville), the southwestern region (1,146 permits) carried the highest volume of new swimming pool construction, while Jacksonville (average value: $69,141) carried the highest average value of construction.
Here is a breakdown of new pool construction activity, by region, across the Sunshine State during the month of September 2021:
Southwest
As previously noted, the southwestern region of Florida ranked #1 for new pool construction, having 1,146 new permits with a total construction value of nearly $59.7 million on record for the month of September. The average value of construction landed on the lower end of the spectrum (average value: $52,071) in comparison to other Florida regions reviewed, and more than half of all new permits originated from the counties of Lee (379 permits) and Collier (300 permits).
Out of the 180 contractors with new pool construction activity on record in the area last month, the following ranked as the top three for total new permits:
| Builder | Total Permits |
| 1-Aragon Pools & Spas | 187 |
| 2-Coast to Coast Pools | 97 |
| 3-Pinnacle USA | 69 |
Southeast
Last month, there were more than 600 new swimming pool construction permits with a total value of $30.7 million on record for the southeastern region of Florida. The average value of new pool construction was $51,101, which was lowest in comparison to other Florida regions reviewed, and more than half of all new permits originated from the two counties of Miami-Dade (186 permits) and Palm Beach (182 permits).
Out of the 210 pool builders with new construction activity on record in the area last month, the following ranked as the top three for total new permits:
| Builder | Total Permits |
| 1-A&G Concrete Pools | 26 |
| 2-Fountain Blue Pool Service | 20 |
| 3-Apex Pavers & Pools | 18 |
Tampa
In Tampa, there were more than 550 new swimming pool permits with a total value of nearly $36 million added to the HBW database last month. The average value of new pool construction was $64,966, and more than half of all new construction activity took place in the counties of Hillsborough (185 permits) and Pasco (116 permits).
Out of approximately 145 contractors with new pool construction on record in the Tampa area last month, the following ranked as the top three for total new permits:
| Builder | Total Permits |
| 1-Challenger Pools | 33 |
| 2-T&D Pool Construction | 30 |
| 3-Pointer Pools & Spas | 21 |
Orlando
Last month, there were more than 315 new swimming pool construction permits with a total value of approximately $16.6 million on record for the Orlando area. The average value of new pool construction was $52,452, and nearly half of all new permits originated from Orange County (145 permits).
Out of the more than 85 contractors with new swimming pool construction on record in the area last month, the following ranked as the top three for total permits:
| Builder | Total Permits |
| 1-Dreamscapes Pools & Spas | 21 |
| 2-Legacy Pools | 16 |
| 3-Holland Pools | 16 |
Jacksonville
In Jacksonville, there were more than 250 new pool permits with a total value in excess of $69 million last month. The average value of new pool construction was highest in the Jacksonville area (average value: $69,141) in comparison to other Florida regions reviewed, and the bulk of new construction activity took place in St. Johns County and Duval County where there were 115 and 61 permits respectively.
Out of 75 pool builders with new construction activity on record in Jacksonville last month, the following ranked as the top three for total new permits:
| Builder | Total Permits |
| 1-Pools by John Clarkson | 22 |
| 2-Palace Pools | 11 |
| 3-Kerry Martin Pools | 9 |
For more information on the builders, homeowners and permits for the construction activity above, check out HBW for your copy of the latest construction data reports. To gain access to the HBW database and receive custom and detailed reports on the latest residential and commercial building activity in Florida, Georgia, Texas, Alabama, and Oklahoma, please contact HBW for details.