In the first quarter of this year, the HBW database was replenished with nearly 8,000 new swimming pool permits from Florida, Texas and the Metro Atlanta areas combined. Here’s a look at Florida’s jumpstart on 2017.

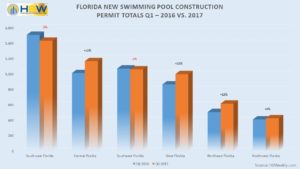
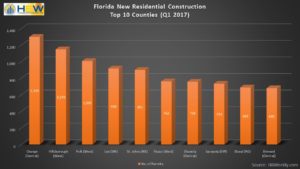
The Sunshine State is off to a sunny start for new pool construction in 2017. With more than 5,700 pool starts in the first quarter of the year, Florida is ahead of last year by 6%. Out of the six major regions reviewed, the southwest had the highest concentration of swimming pool starts (1,434 permits). Even with the 5% dip in new pool construction in comparison to Q1 2016, the southwest is leading the market. The southwestern county of Lee is also leading the state and ranked #1 for new pool construction. With close to 460 new swimming pool permits on file with HBW, Lee County is just about 2% ahead of Q1 2016.
Coming in at a not so distant second, Central Florida continues to boom in residential construction and swimming pools. Already more than 15% ahead of last year, there were approximately 1,170 pool starts in Central Florida during the first quarter of 2017. The city-central county of Orange ranked second highest in the state with more than 360 pool starts, a 2% increase over the previous year.
Southeast Florida is holding steady and consistent with last year as there were just over 1,060 new pool permits added to the HBW database in the first quarter. While Palm Beach and Miami-Dade counties account for more than 50% of new pool construction, areas like Indian River and St. Lucie are showing healthy signs of growth as they are well ahead of last year’s figures.
The Tampa area and surrounding counties that make up the West portion of the state have seen the greatest increases in new swimming pool construction at the start of the year. With a 16% year-over-year increase in new pool construction, the western region of Florida had 1,000 swimming pool starts, with more than 300 taking place in Hillsborough County. The counties of Polk and Citrus had their best quarter on record over the last year with year-over-year increases up to 41%; on the other end of the spectrum, Sumter County has maintained its decline in swimming pool construction as it had a 23% decrease in new pools in comparison to last year.
While Northeast Florida does not have the highest number of pool starts, it is the area with the greatest increase in pool construction (+22%). With nearly 620 new swimming pool permits, all northeastern counties, with the exception of Marion, are ahead of or on target with Q1 2016. The greatest amount of new construction could be found in St. Johns County where there were more than 210 pool starts in the first quarter of this year, reflective of a 34% increase over last year.
Finally, we took a gander at the northwestern portion of the state, including a couple of bordering counties from Alabama. In the northwest, while pool construction has not been abundant, it has been on the rise over the last five years. In the first quarter, the NW region exhibited a 4% year-over-year increase and has more than 420 new swimming pool permits on file for the period. Baldwin County in Alabama saw the greatest gains in pool construction with a 43% year-over-year increase, and in Florida, Walton County is holding steady and experiencing the greatest amount of new pool construction out of all northwestern counties reviewed.
Information utilized for the graphs and above listed figures for swimming pool construction in Florida was directly derived from HBW construction data reports. To gain access to the HBW database and receive custom and detailed reports on the latest residential and commercial building activity in Florida, Georgia, Texas, Alabama, and Oklahoma, please contact HBW for details.


