
An HBW report on new swimming pool construction permits in the Atlanta area for 2018
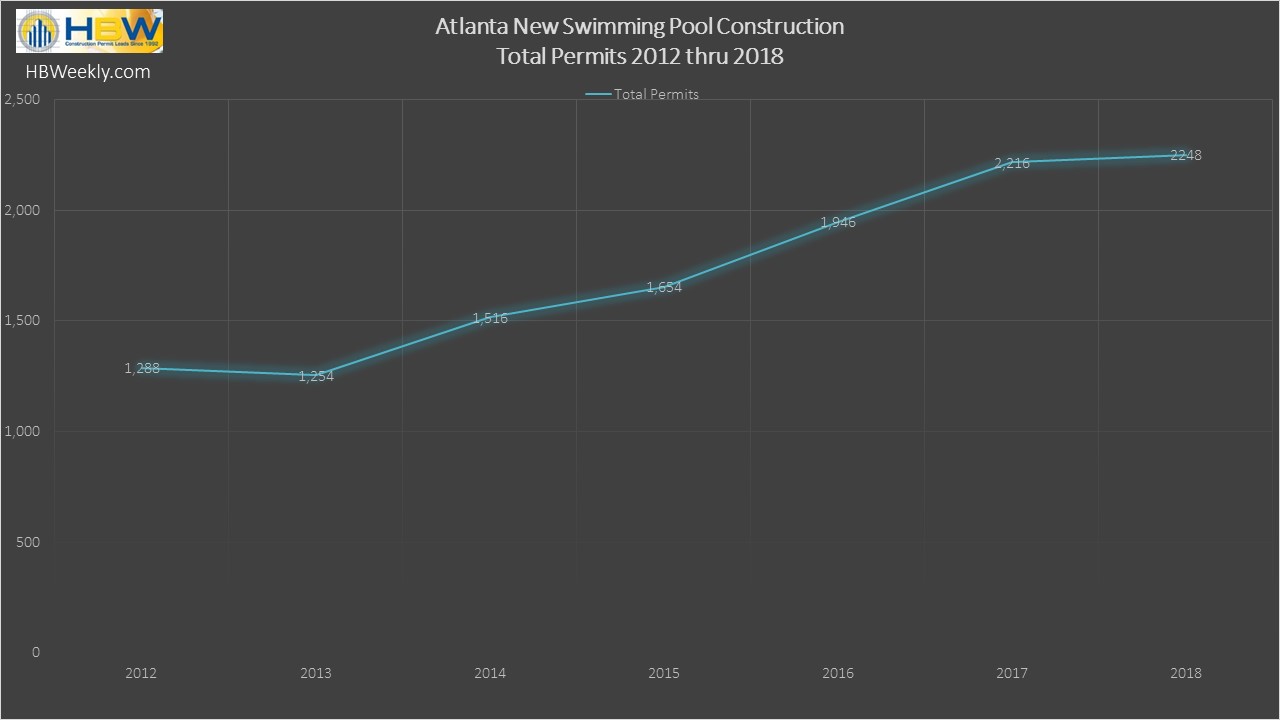
Atlanta Pool Permits 2012 thru 2018
Since 2013, swimming pool construction has been on the rise in the Metro Atlanta area. While the overall annual increase in new swimming pool construction was nominal (+1%) in the Atlanta area last year, the upward trend is still holding steady. In 2018, the slight annual increase in new pool permits resulted in nearly 2,250 new pool permits being added to the HBW database.
Counties that have the highest concentration of new swimming pool construction activity include Fulton and Cobb. Fulton County exhibited a year-over-year increase of 6% in new pool construction, resulting in nearly 420 pool starts, and while new swimming pool activity in Cobb County was down by 6% since the previous year, it still ranked second-highest for new swimming pool construction having more than 285 pool starts last year. Other counties with higher levels of new pool construction include Gwinnett (221 permits, +12%) and Cherokee (198 permits, -4%). Here is a closer look at how the top ranked Atlanta-area counties for new pool construction stacked up from 2017-2018.
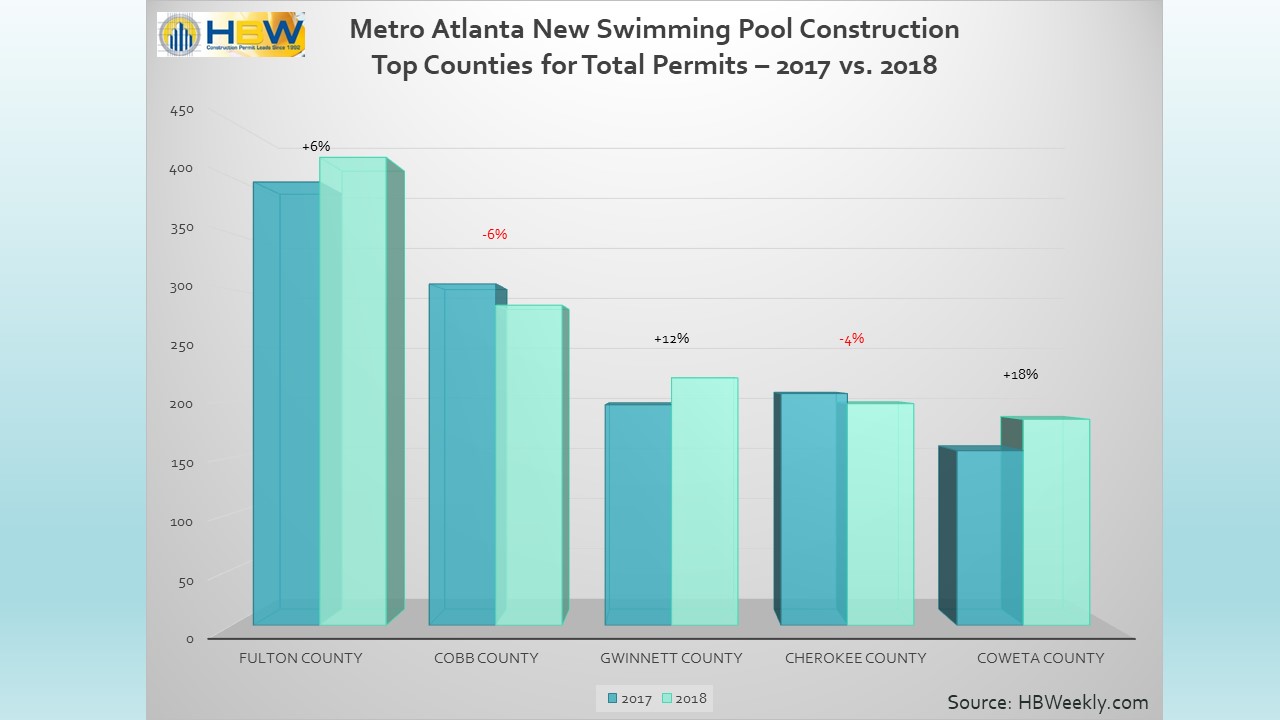
ATL Top 5 Counties for Total Pool Permits (2017 vs. 2018)
When looking at the year ahead, we reviewed Metro Atlanta counties for highest levels of growth and potential. For example, while Walton County was on the lower end of total swimming pool starts (92 permits), it has recovered from the major drop it experienced in 2017 to now having an annual increase of nearly 120% in new pool construction (YTD-2018). Another county on a growth track is Hall. Since 2014, Hall County has been exhibiting annual increases ranging from 19% to 30% in pool starts; last year, there were nearly 110 swimming pool starts in Hall County, reflecting a 23% annual increase in new pool construction. Similar and consistent growth also took place in Coweta County. Since 2014, the area has consistently experienced increases in new swimming pool construction ranging from 3% to 31%; in 2018, Coweta County was back on the mid to higher end of its upswing with an 18% annual increase, resulting in nearly 185 new swimming pool permits for the area.
Information utilized for the graphs and above listed figures for Metro Atlanta swimming pool construction was directly derived from HBW construction data reports. To gain access to the HBW database and receive custom and detailed reports on the latest residential and commercial building activity in Florida, Georgia, Texas, Alabama, and Oklahoma, please contact HBW for details.